


Training your team is vital—but are you tracking how your budget is being utilized?
Whether you’re managing corporate learning programs, department-level trainings, or monthly trainer performance, you need more than scattered spreadsheets to make informed decisions.
📊 Introducing the Training Budget Dashboard in Excel – a ready-to-use, fully interactive Excel template designed to help HR professionals, L&D managers, and finance teams track training budgets, utilization, and program effectiveness in one smart dashboard.
Built with dynamic visuals and slicers, this dashboard puts all your data into one sleek, intuitive file. No extra software. No coding required.
✅ Key Features of Training Budget Dashboard in Excel
🧭 Page Navigator – Seamless Navigation Across Insights
Located on the left side, the Page Navigator allows users to switch effortlessly between five analytical pages:
Overview
Department Analysis
Program Analysis
Trainer Analysis
Monthly Trends
Just click and explore!
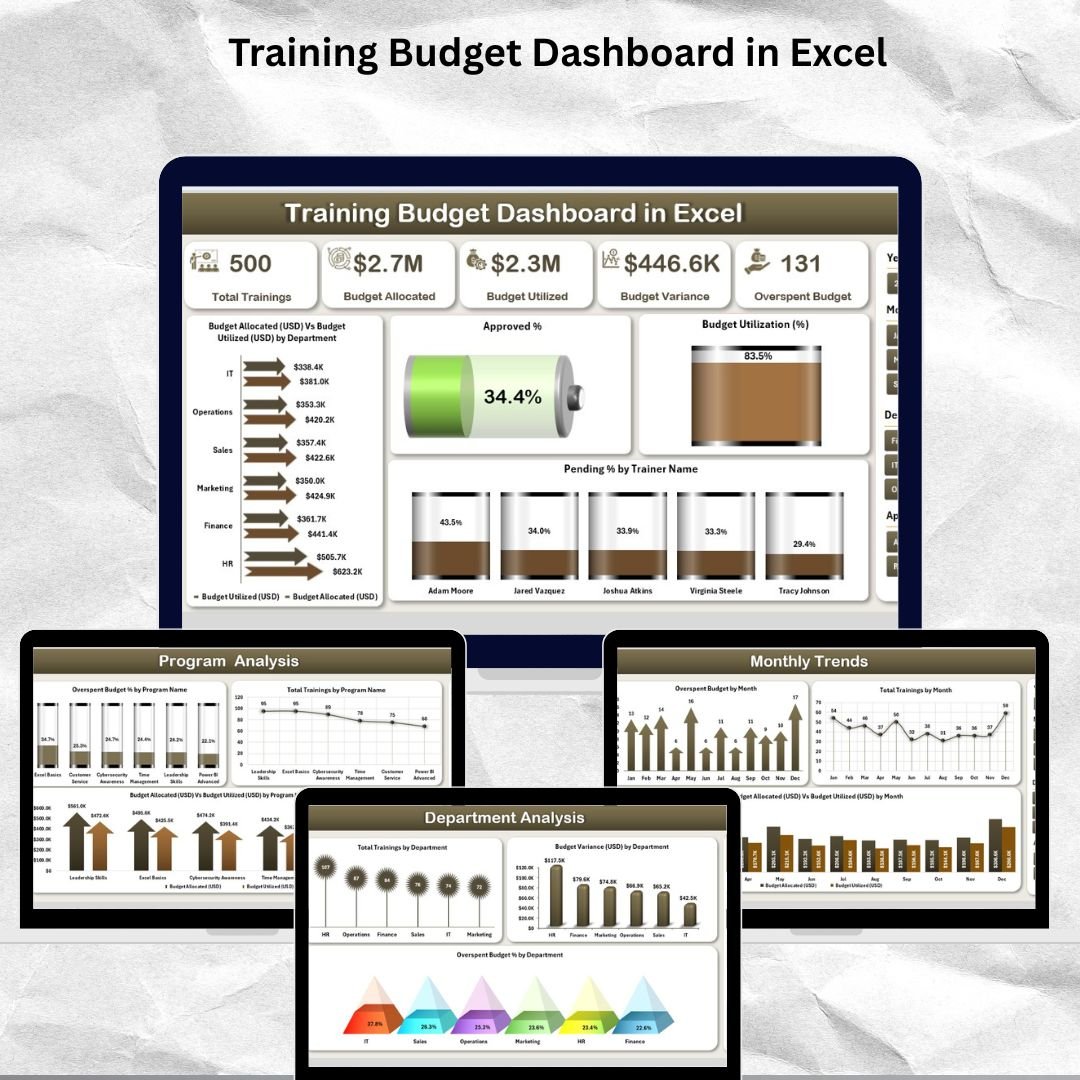
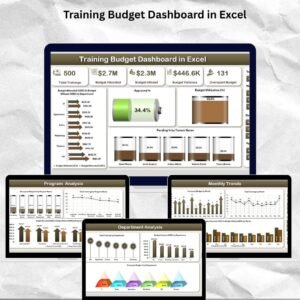
🏠 Overview Page – A Snapshot of Overall Training Health
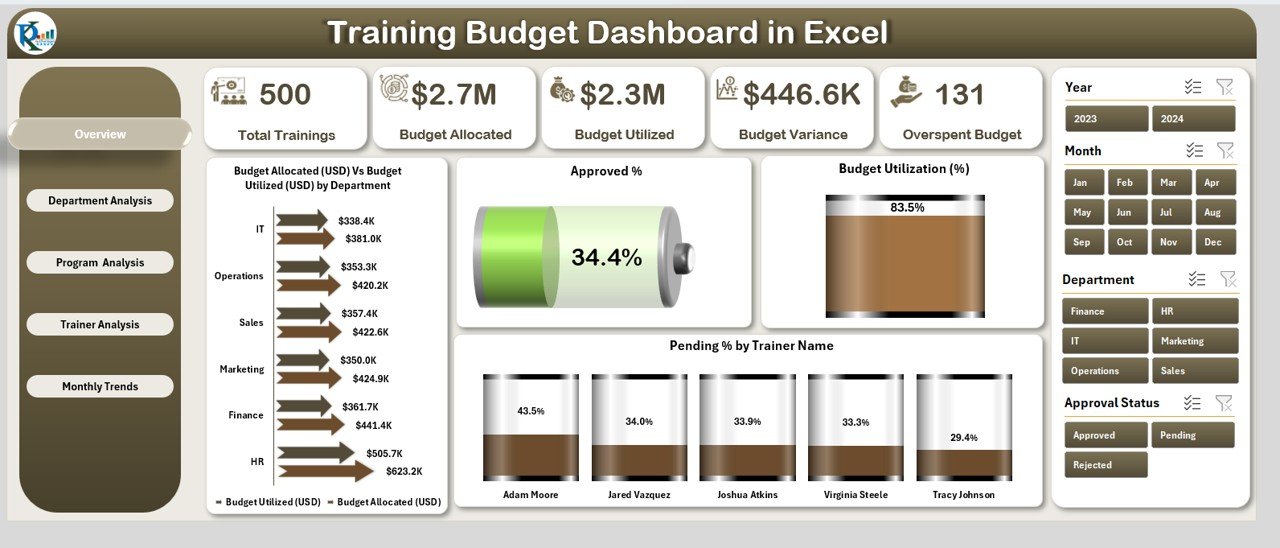
Gain high-level insights into your training operations with:
🟢 5 KPI Cards: Budget Allocated, Budget Utilized, Utilization %, Approved %, Pending %
📈 4 Key Charts:
Budget Allocation vs Utilization by Department
Approved %
Budget Utilization %
Pending % by Trainer Name
Use this page to make quick, informed decisions.
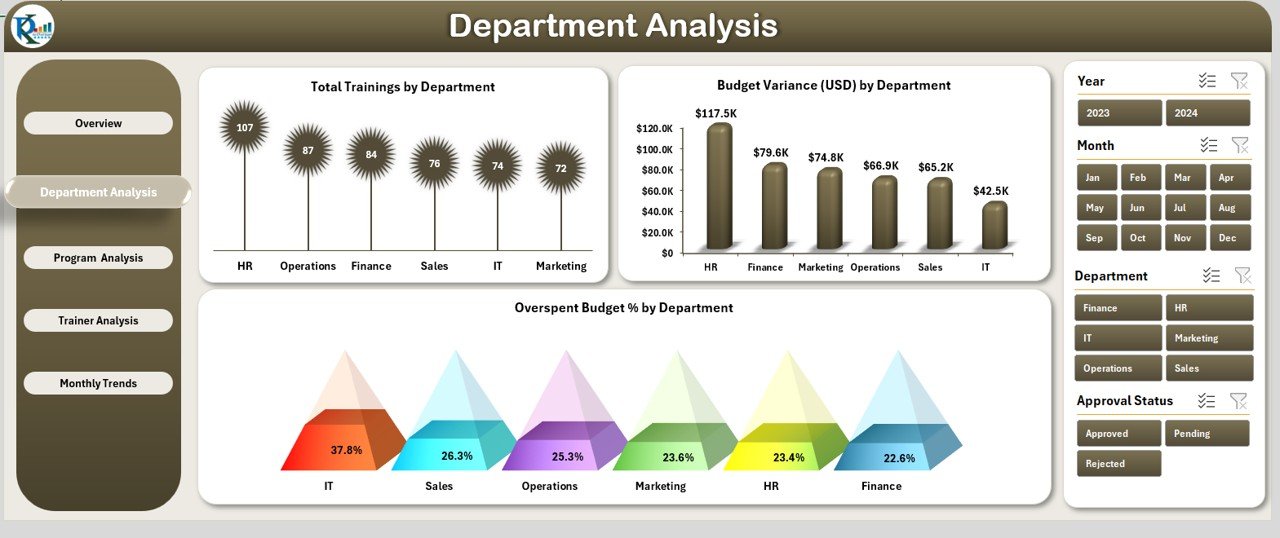
🏢 Department Analysis – Drill Into Department-Wise Insights
See how different departments are managing their training budgets:
📊 3 Visuals:
Total Trainings by Department
Budget Variance (USD)
Overspend Budget %
Perfect for identifying gaps and setting accountability.
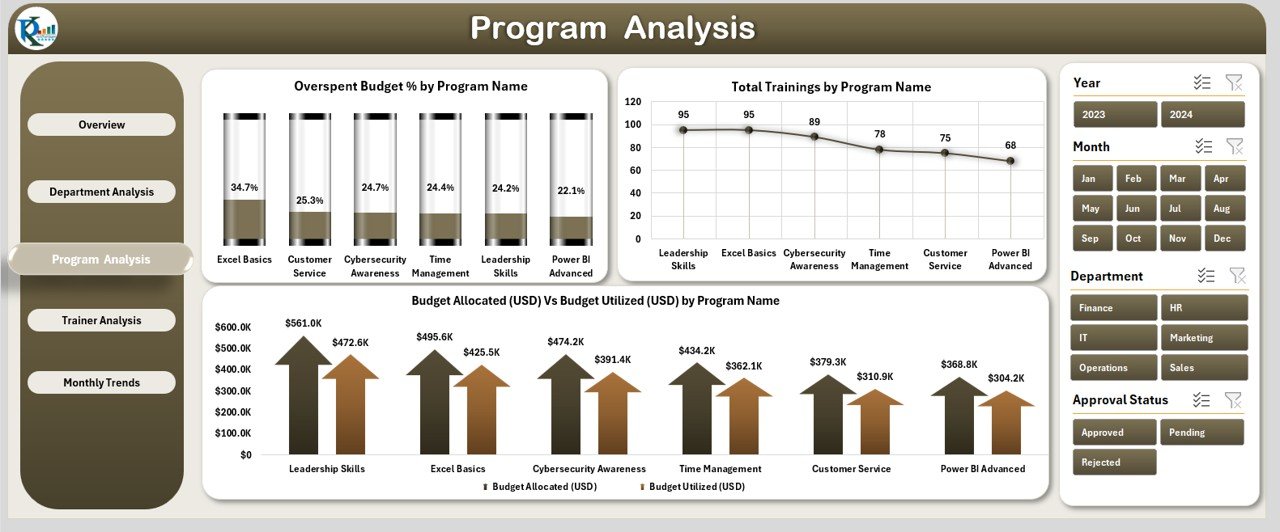
📚 Program Analysis – Optimize Your Training Offerings
Evaluate program performance and cost-efficiency:
📈 Charts Include:
Overspend Budget % by Program Name
Total Trainings by Program
Budget Allocation vs Utilization by Program
Use this data to adjust programs and maximize ROI.
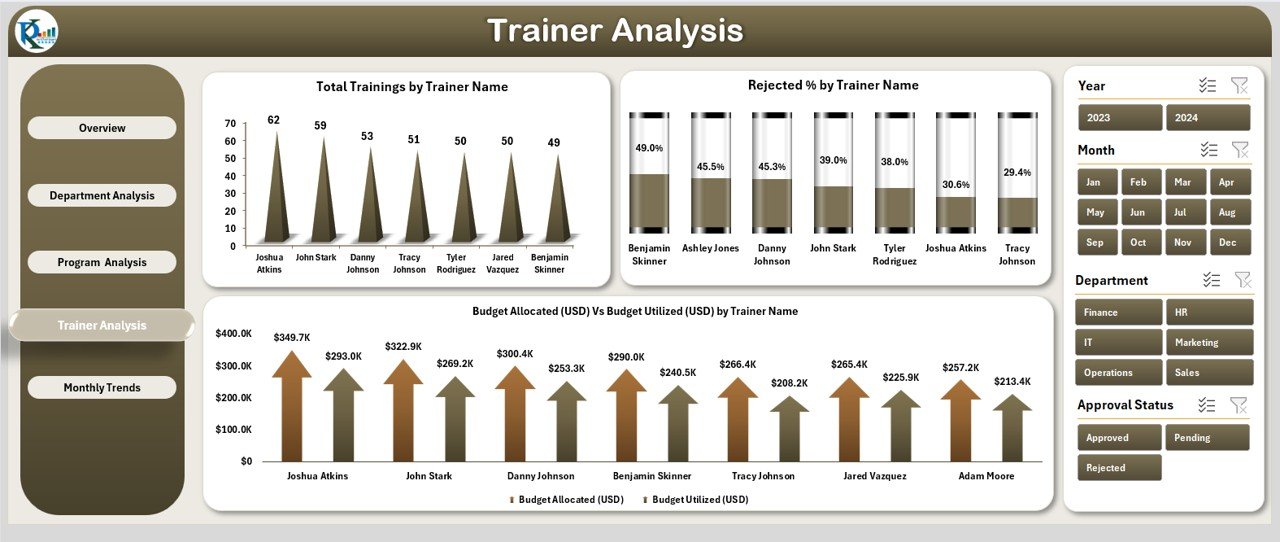
👨🏫 Trainer Analysis – Track Trainer-Level Performance
Get insights into trainer effectiveness and budget impact:
📉 3 Charts:
Total Trainings by Trainer
Reject % by Trainer
Budget Allocation vs Utilization by Trainer
Great for trainer evaluations and planning future sessions.
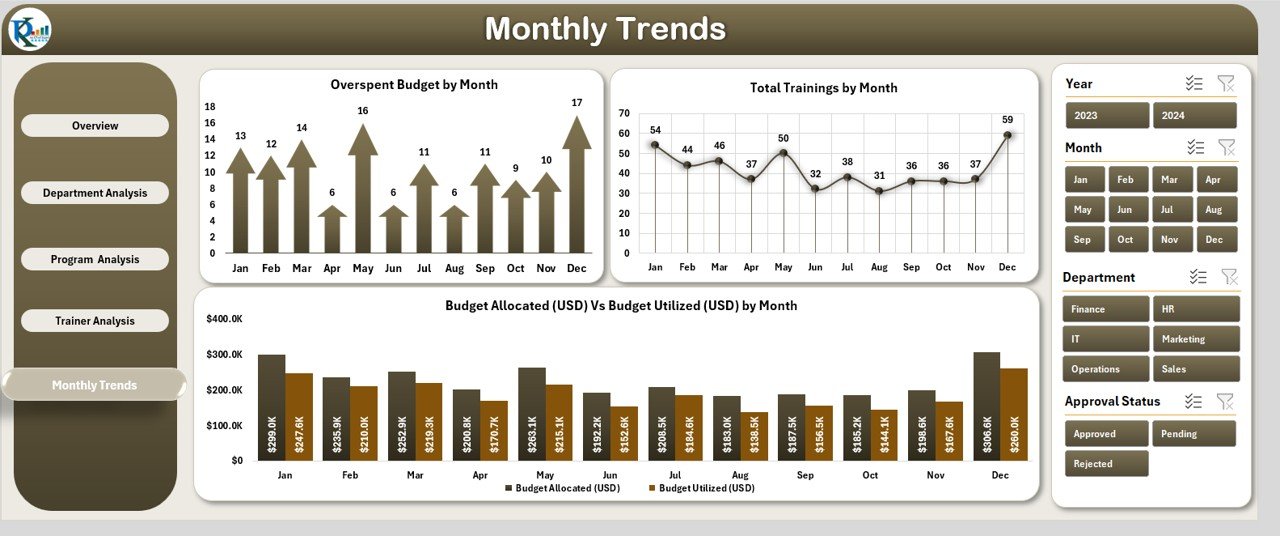
📅 Monthly Trends – Analyze Budget Flow Over Time
See how training metrics evolve month-to-month:
📊 Charts include:
Overspend Budget by Month
Total Trainings by Month
Budget Allocation vs Utilization by Month
Ideal for planning, forecasting, and spotting trends.
📂 What’s Inside the Training Budget Dashboard?
✅ 5 Dashboard Pages:
Overview
Department Analysis
Program Analysis
Trainer Analysis
Monthly Trends
📑 2 Backend Sheets:
Data Sheet – Where you input your actuals
Support Sheet – Manage dropdowns and slicer values
🧮 100% Excel-driven using Pivot Charts, Slicers & Formulas. No VBA required.
🛠️ How to Use the Training Budget Dashboard
📥 Download & Open the Excel file
📊 Enter Data in the Data Sheet (departments, programs, budgets, trainings)
🔄 Update Dropdowns via the Support Sheet
🧭 Navigate Pages using the left-side Page Navigator
📈 Review Insights and export visuals for reports
No technical skills needed—just Excel basics.
👥 Who Can Benefit from This Dashboard?
🧑💼 HR Professionals & Training Managers
🏢 Department Heads
📈 L&D & Finance Teams
📋 Consultants & Analysts
🧑🏫 Corporate Trainers
🧳 SMEs & Enterprises
If you’re planning, managing, or analyzing training budgets—this is your go-to tool.
📚 Click here to read the Detailed blog post
📺 Visit our YouTube channel to learn step-by-step video tutorials
Watch the step-by-step video tutorial:
Compatibility and Requirements
- Works in Microsoft Excel desktop (Excel 2016 or later, or Microsoft 365).
- Microsoft’s guide Use slicers to filter data explains the Excel feature this file is built on.
Frequently Asked Questions
Which pages are in the Training Budget Dashboard?
Five pages: Overview, Department Analysis, Program Analysis, Trainer Analysis and Monthly Trends. A Data sheet and a Support sheet sit behind them.
Which KPI cards are on the Overview page?
Budget Allocated, Budget Utilized, Utilization %, Approved % and Pending %.
Where do I enter my training data?
In the Data sheet: departments, programs, budgets and trainings. Dropdown and slicer values are managed in the Support sheet.
Can I compare trainers?
Yes. The Trainer Analysis page shows total trainings, reject % and budget allocation against utilization for each trainer.
Related Training Budget Templates
- Training Budget Dashboard in Power BI: the same dashboard in Power BI
- Training Budget Dashboard in Google Sheets: the training budget dashboard in Google Sheets
- Training Budget Report in Excel: a printable training budget report in Excel
- Training and Development Dashboard in Excel: track training and development in Excel
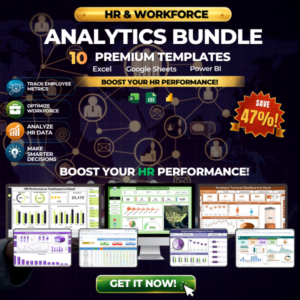
- HR & Workforce Analytics Bundle: HR and workforce templates in one bundle
Browse all Excel dashboards or the Excel financial tools.
























Reviews
There are no reviews yet.