Transmission line construction projects demand precision, coordination, strict cost control, and continuous monitoring. These projects involve land acquisition, tower erection, conductor stringing, substation connectivity, safety management, and regulatory compliance. Transmission Line Construction KPI Dashboard in Power BI However, many teams still rely on scattered Excel sheets and manual reporting. As a result, managers struggle to monitor progress accurately, identify delays early, and control budget overruns.
The Transmission Line Construction KPI Dashboard in Power BI provides a centralized, interactive, and fully automated performance monitoring solution designed specifically for power transmission infrastructure projects. Transmission Line Construction KPI Dashboard in Power BI This ready-to-use Power BI dashboard transforms structured Excel data into dynamic visuals, enabling project managers, EPC contractors, engineers, and executives to track monthly and yearly performance in real time.
Instead of reviewing multiple reports, users can monitor MTD (Month-to-Date) and YTD (Year-to-Date) performance, compare actual vs target values, analyze previous year trends, and drill through KPI definitions — all from one powerful interface.
With dynamic slicers, automated calculations, and professional visuals, this dashboard enhances transparency, improves accountability, and supports proactive decision-making.
🚀 Key Features of Transmission Line Construction KPI Dashboard in Power BI
📊 Interactive Summary Page – Centralized KPI monitoring with instant filtering.
📅 Month & KPI Group Slicers – Dynamic filtering for focused analysis.
📈 MTD & YTD Performance Tracking – Monitor short-term and long-term results.
🎯 Target vs Actual Comparison – Instantly identify performance gaps.
📉 Previous Year Benchmarking – Compare growth and improvement trends.
🟢🔴 Conditional Performance Indicators – Green & red icons highlight status.
📊 KPI Trend Page with Combo Charts – Visualize performance over time.
📘 Drill-Through KPI Definition Page – Access formulas and logic instantly.
⚡ Automated Calculations – Reduce manual reporting errors.
📦 What’s Inside the Transmission Line Construction KPI Dashboard in Power BI
This ready-to-use solution includes 3 structured Power BI pages and a connected Excel data model.
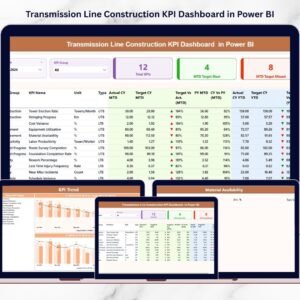
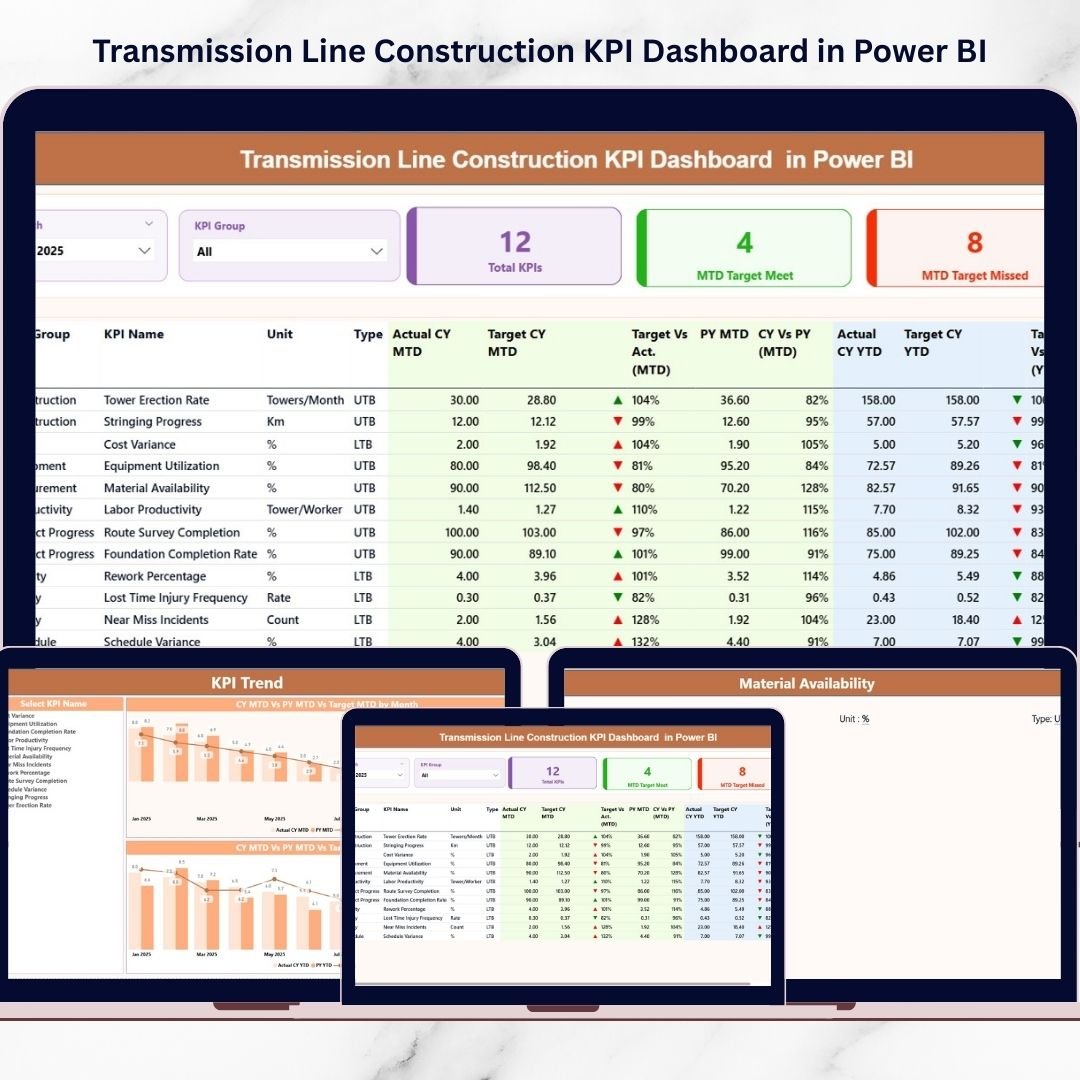
📊 1️⃣ Summary Page – Main Performance Control Center
The Summary Page provides a complete project overview.
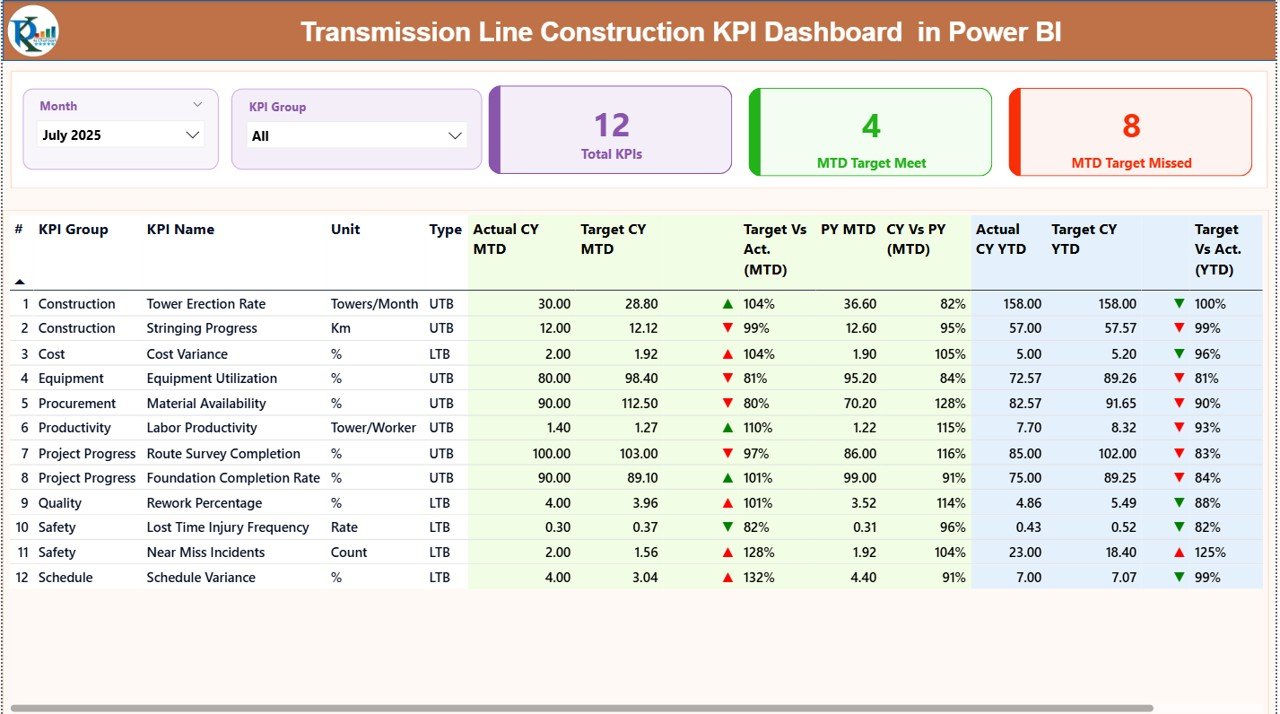
🔹 Top Slicers
-
Month Selection
-
KPI Group Selection
Once selected, the entire dashboard updates automatically.
🔹 KPI Cards
-
Total KPI Count
-
MTD Target Meet Count
-
MTD Target Missed Count
These cards provide instant project health visibility.
🔹 Detailed KPI Table
Includes:
-
KPI Number
-
KPI Group
-
KPI Name
-
Unit
-
Type (LTB / UTB)
🔹 MTD Section
Displays:
-
Actual CY MTD
-
Target CY MTD
-
PY MTD
-
Target vs Actual %
-
CY vs PY %
-
Performance Icon (▲ / ▼)
🔹 YTD Section
Displays:
-
Actual CY YTD
-
Target CY YTD
-
PY YTD
-
Target vs Actual %
-
CY vs PY %
-
Performance Icon
Managers instantly understand whether performance improves or declines.
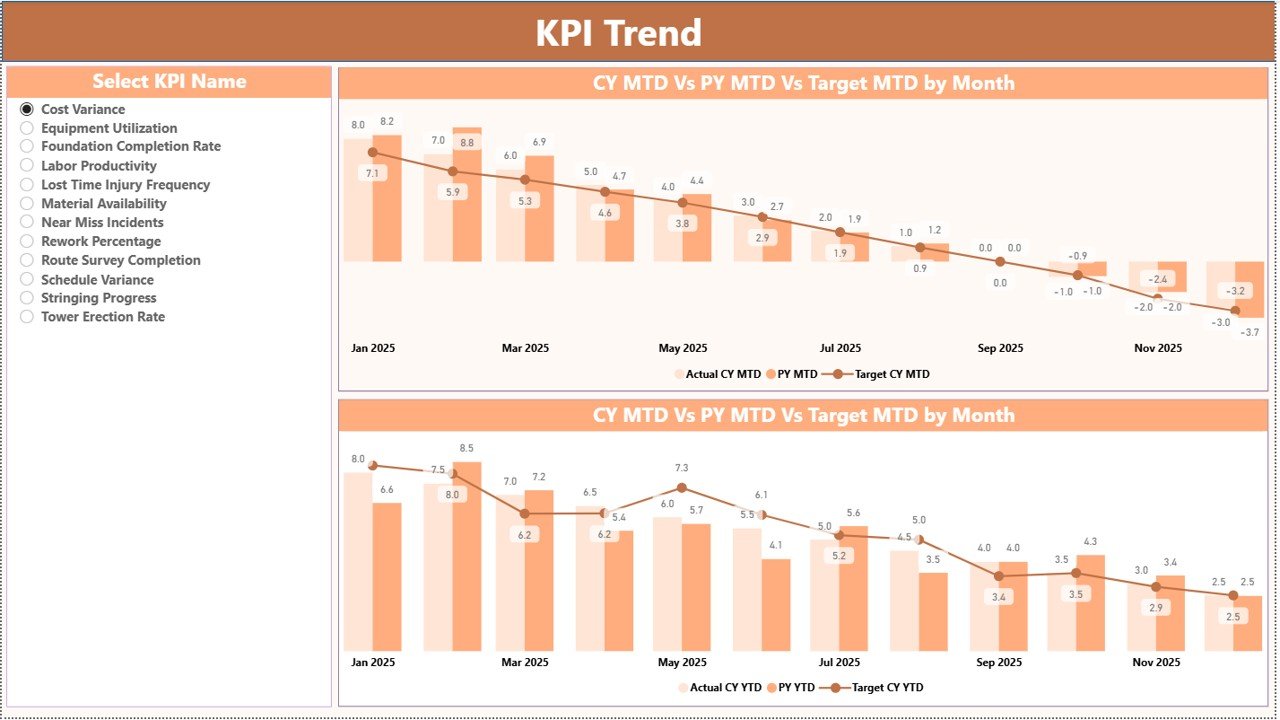
📈 2️⃣ KPI Trend Page – Performance Visualization
The KPI Trend Page allows focused KPI analysis.
🔹 KPI Selection Slicer
Select any KPI and both charts update automatically.
🔹 Two Combo Charts
-
MTD Trend (Actual vs Target vs PY)
-
YTD Trend (Actual vs Target vs PY)
This enables long-term performance pattern analysis for:
🏗 Tower Installation Progress
⚡ Stringing Completion
💰 Cost per KM
🦺 Safety Incident Rate
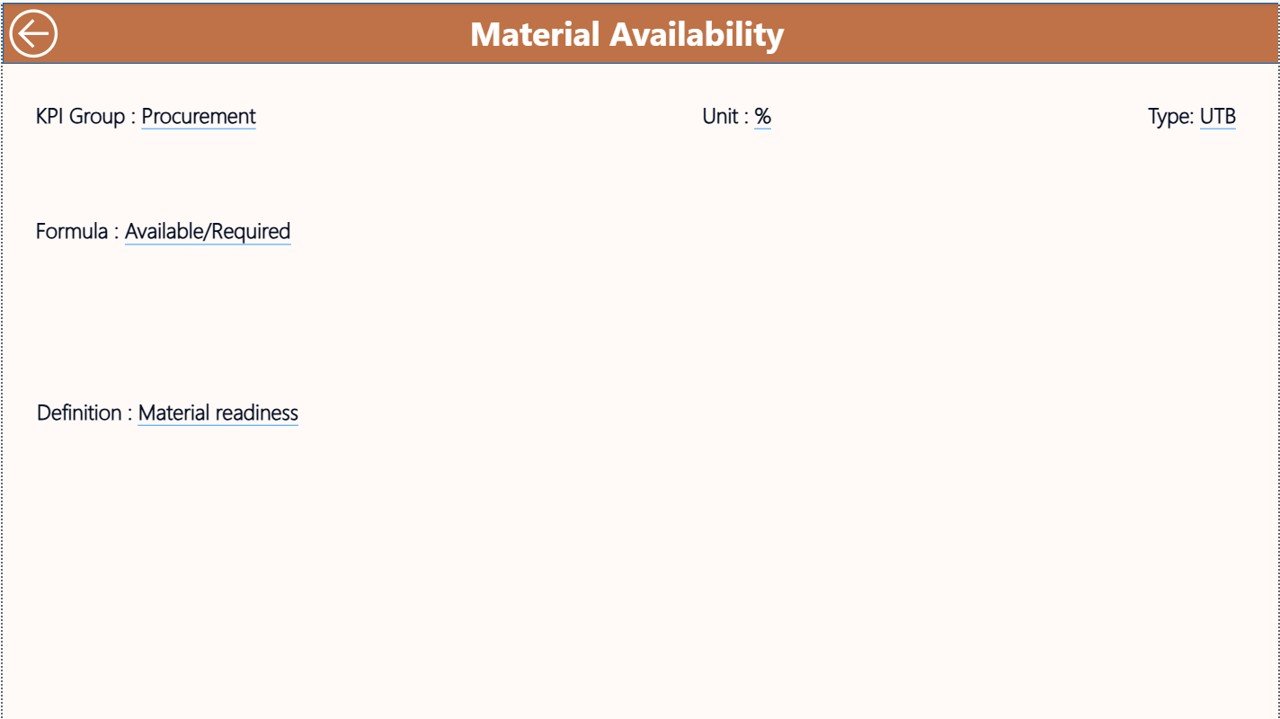
📘 3️⃣ KPI Definition Page – Drill-Through Insights
Accessible via drill-through.
Displays:
-
KPI Formula
-
KPI Definition
-
KPI Group
-
KPI Type (LTB / UTB)
Ensures transparency and clarity in reporting logic.
🗂 Excel Data Structure (Connected Backend)
The dashboard connects to a structured Excel file containing:
1️⃣ Input Actual Sheet
-
KPI Name
-
Month
-
MTD Value
-
YTD Value
2️⃣ Input Target Sheet
-
KPI Name
-
Month
-
Target MTD
-
Target YTD
3️⃣ KPI Definition Sheet
-
KPI Number
-
KPI Group
-
KPI Name
-
Unit
-
Formula
-
Type
Simple data entry → Refresh Power BI → Dashboard updates automatically.
👥 Who Can Benefit from This Dashboard
🏗 Transmission Project Managers
⚡ EPC Contractors
📊 Construction Controllers
🏢 Utility Companies
🦺 Site Engineers
🏛 Government Infrastructure Agencies
📈 Senior Executives
Suitable for both single and multi-project environments.
⭐ Advantages of Transmission Line Construction KPI Dashboard in Power BI
✅ Centralized Project Monitoring
✅ Real-Time Performance Visibility
✅ Automated KPI Calculations
✅ Professional Visual Reporting
✅ Trend & Historical Comparison
✅ Drill-Through Insights
✅ Improved Budget & Safety Control
🛠 Best Practices for Implementation
✔ Define measurable KPIs clearly
✔ Update Excel data monthly
✔ Validate inputs before refreshing
✔ Categorize KPIs correctly
✔ Review trends regularly
✔ Share dashboard insights during project meetings
✔ Use LTB & UTB classification properly
### Click here to read the Detailed blog post
🎥 Visit our YouTube channel to learn step-by-step video tutorials
👉 https://youtube.com/@PKAnExcelExpert