


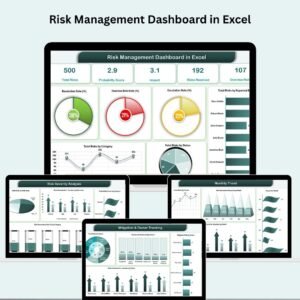
In today’s volatile business environment, ignoring risk is no longer an option. You need a smart, visual, and proactive way to identify, assess, and manage potential threats before they derail your objectives. That’s exactly what the Risk Management Dashboard in Excel delivers!
This ready-to-use, fully customizable Excel dashboard gives you real-time visibility into risk exposure, helping you make confident, data-backed decisions. Say goodbye to scattered spreadsheets or expensive software—and hello to one centralized risk command center.
✨ Key Features of the Risk Management Dashboard in Excel
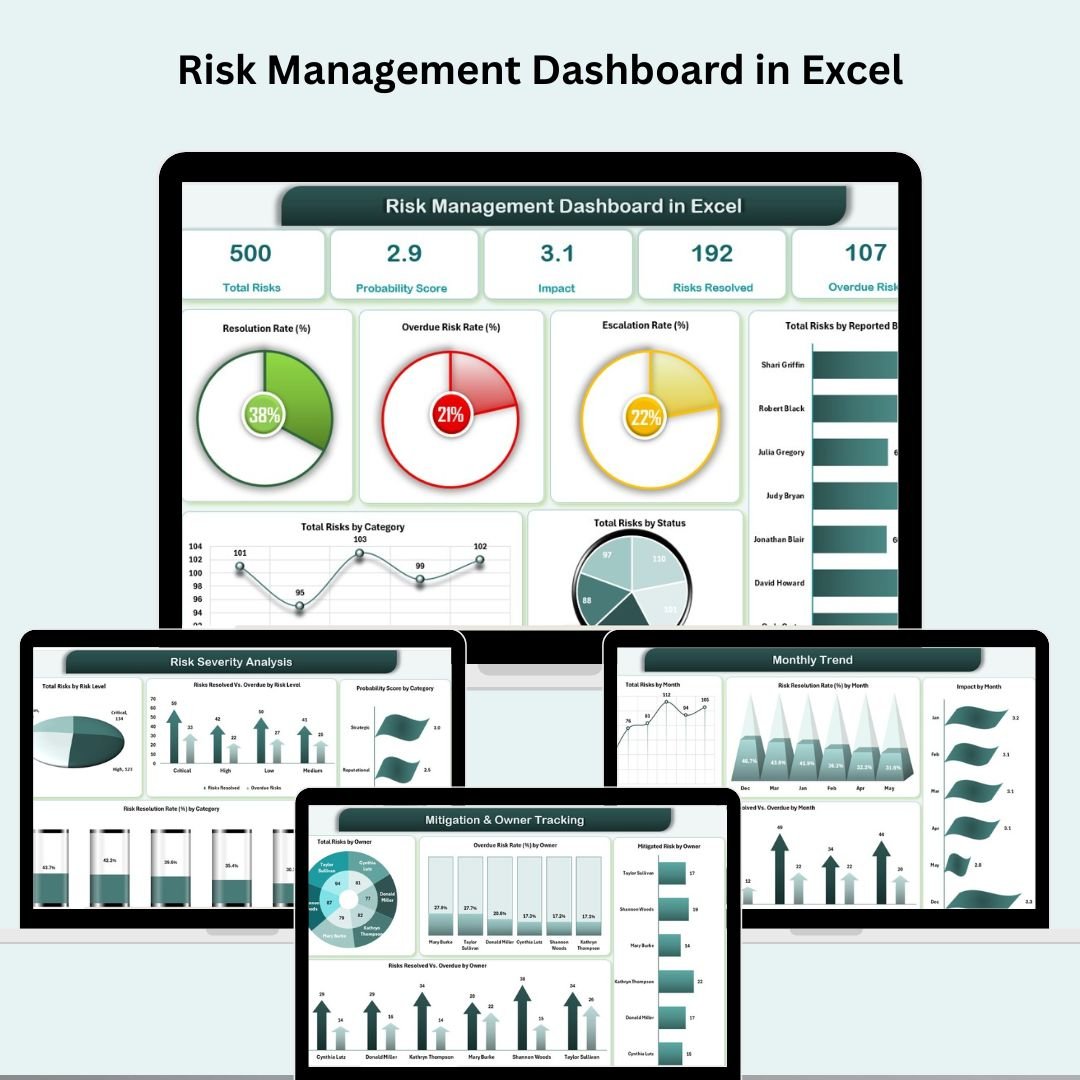
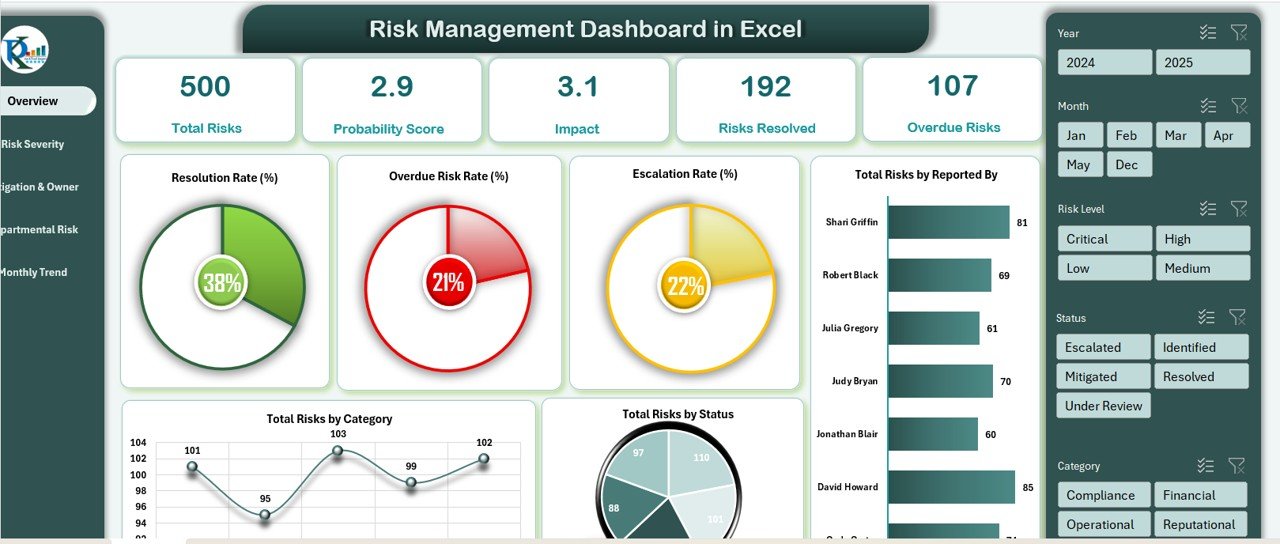
📌 Comprehensive KPI Cards
Total Risks
Average Probability Score
Average Impact Score
Risks Resolved
Overdue Risks
📊 Visual Dashboards
Resolution Rate %
Overdue Risk Rate %
Escalation Rate %
Risks by Reporter, Category, Status
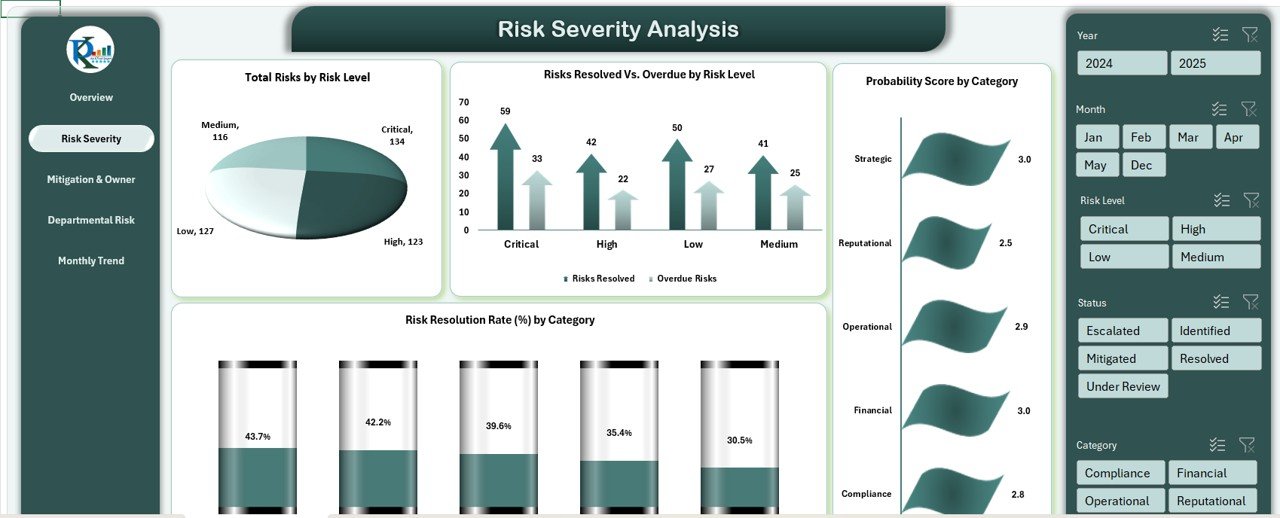
📉 Risk Severity Analysis
Risks segmented by severity: Low, Medium, High, Critical
Breakdown by Probability & Resolution effectiveness
Category-wise threat visibility
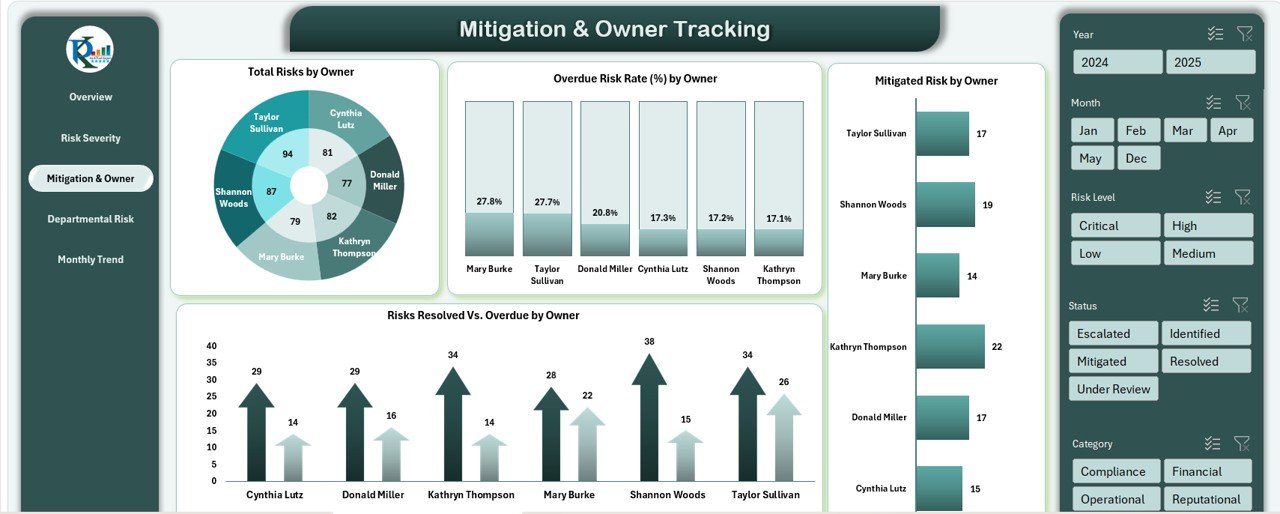
🧍 Mitigation & Ownership Tracking
Owner-wise risk counts, performance, and overdue rates
Accountability for each open or escalated risk
Progress tracking by individual or team
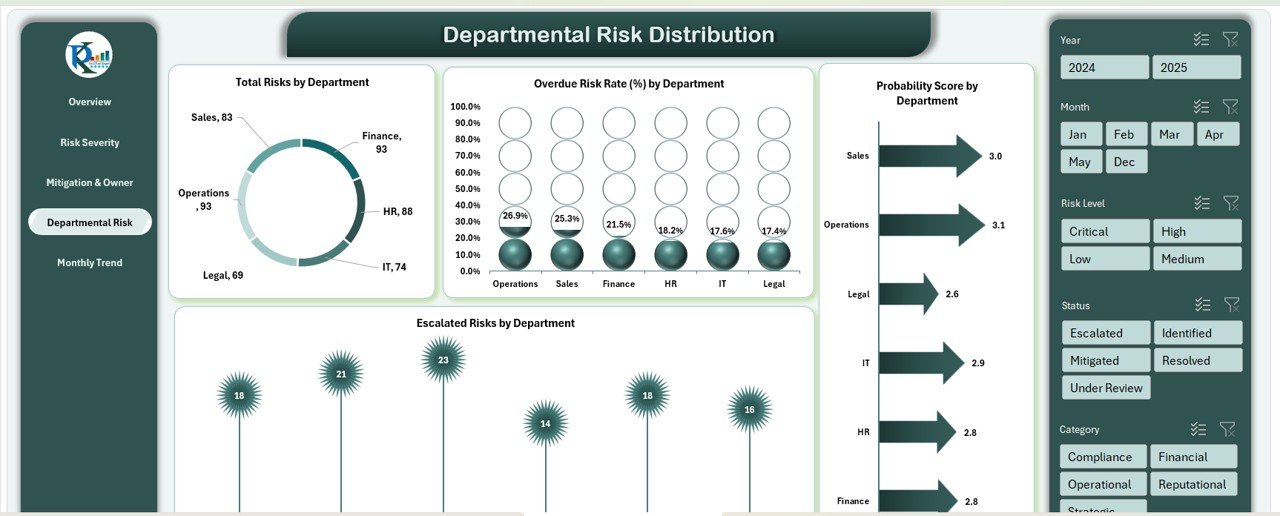
🏢 Departmental Distribution View
Risk concentration by department
Overdue/Escalated rate by department
Resource planning made easy
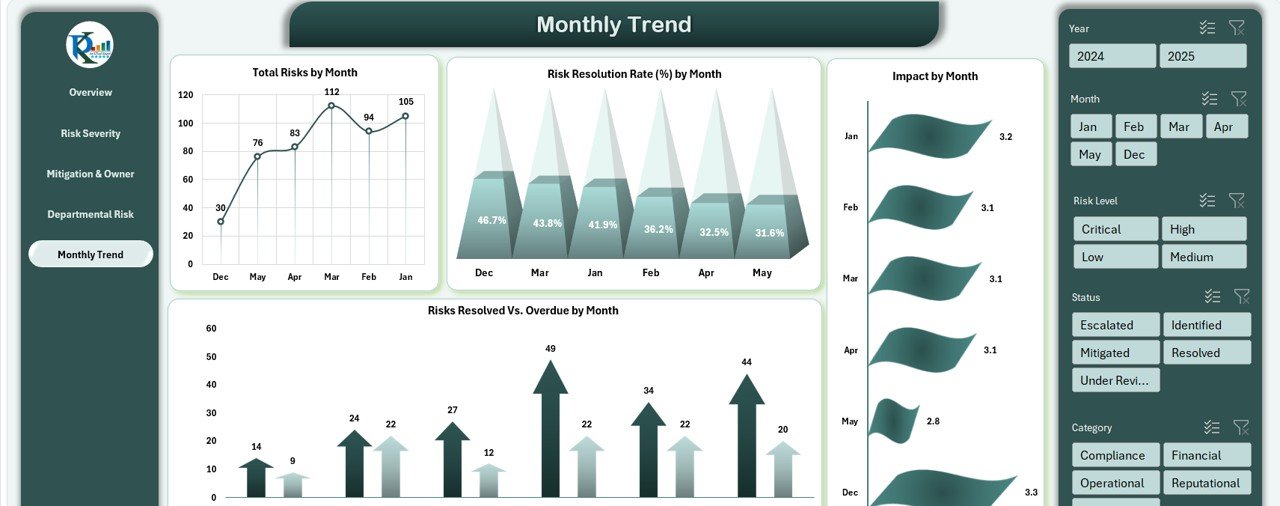
📅 Monthly Trends
Trends in total risks, resolution rates, and impact
Monthly resolved vs. overdue comparison
Performance review insights at your fingertips
📦 What’s Inside the Risk Management Dashboard
🟩 Overview Page
Track risk KPIs and analyze dashboard-wide visuals in one place. Identify bottlenecks, overdue tasks, and high-risk categories instantly.
🟥 Risk Severity Sheet
Evaluate threats based on severity and probability to prioritize mitigation actions.
🟨 Owner Tracking Page
Assign accountability with metrics for resolution success, overdue risks, and owner performance.
🟦 Departmental Risk Summary
Assess risk density across departments and know where to focus attention.
🟧 Monthly Trends Tab
Visualize risk trends month-by-month. A must-have for board reviews and strategic sessions.
🗂️ Data Entry Sheet
Centralized risk logging: includes risk title, category, owner, probability, impact, deadline, resolution date, and mitigation plan.
🚀 How to Use the Risk Management Dashboard in Excel
1️⃣ Log Each Risk
Enter every identified risk in the Data Sheet, including severity and deadlines.
2️⃣ Assign Responsibility
Designate a team member to own the resolution of each risk.
3️⃣ Monitor KPIs Automatically
Charts and summaries update instantly as new data is entered.
4️⃣ Track Overdue and Escalated Risks
Use dashboard visuals to spot delays or serious threats that need immediate attention.
5️⃣ Review Monthly Trends
Use insights from the Monthly Trend tab to adjust your mitigation strategy over time.
👥 Who Can Benefit from This Risk Management Dashboard?
✅ Project Managers overseeing complex portfolios
✅ Operations Teams managing logistics and compliance risks
✅ IT & Cybersecurity Teams tracking technical threats
✅ Finance Departments monitoring credit or investment risks
✅ Business Owners seeking transparency across departments
✅ Internal Auditors documenting risk reviews and mitigations
Whether you’re a startup or a global enterprise—this Excel template keeps your team focused, accountable, and prepared.
💡 Why This Dashboard Is a Game-Changer
✔ No Expensive Software Needed – All in Excel
✔ Beginner-Friendly – No complex tools or coding
✔ Instant Visuals – Auto-updated charts for quick decision-making
✔ Fully Customizable – Add fields, ratings, automation, or Power Query integrations
✔ Collaborative – Share via OneDrive or SharePoint for cross-functional access
✔ Scalable – Works for any industry and any size of team
🔗 Click here to read the Detailed blog post
Click here to read the Detailed blog post
Watch the step-by-step video Demo:
🎥 Visit our YouTube channel to learn step-by-step video tutorials
Compatibility and Requirements
- Works in Microsoft Excel desktop (Excel 2016 or later, or Microsoft 365).
- For help with the Excel features it uses, see Microsoft’s guide Create a chart from start to finish.
Frequently Asked Questions
Which KPIs does the Risk Management Dashboard show?
KPI cards for Total Risks, Average Probability Score, Average Impact Score, Risks Resolved and Overdue Risks, plus Resolution Rate %, Overdue Risk Rate % and Escalation Rate %.
What do I record for each risk?
The Data Entry Sheet holds the risk title, category, owner, probability, impact, deadline, resolution date and mitigation plan.
How are risks grouped by severity?
Risks are split into Low, Medium, High and Critical, with a breakdown by probability and by how well they were resolved.
Which pages are included?
An Overview page, a Risk Severity sheet, an Owner Tracking page, a Departmental Risk Summary, a Monthly Trends tab and the Data Entry Sheet.
Related Risk Management Templates
- Risk Management Dashboard In Google Sheets: the Google Sheets edition.
- Risk Management KPI Dashboard in Power BI: risk KPIs in Power BI.
- Risk Management Report in Excel: a report-style risk summary in Excel.
- Risk Management Checklist in Excel: a checklist for risk reviews.
- Project Management Pro Bundle: 9 project templates for Excel and Google Sheets.
Browse all Excel dashboards or the Excel project management templates.






























Reviews
There are no reviews yet.