

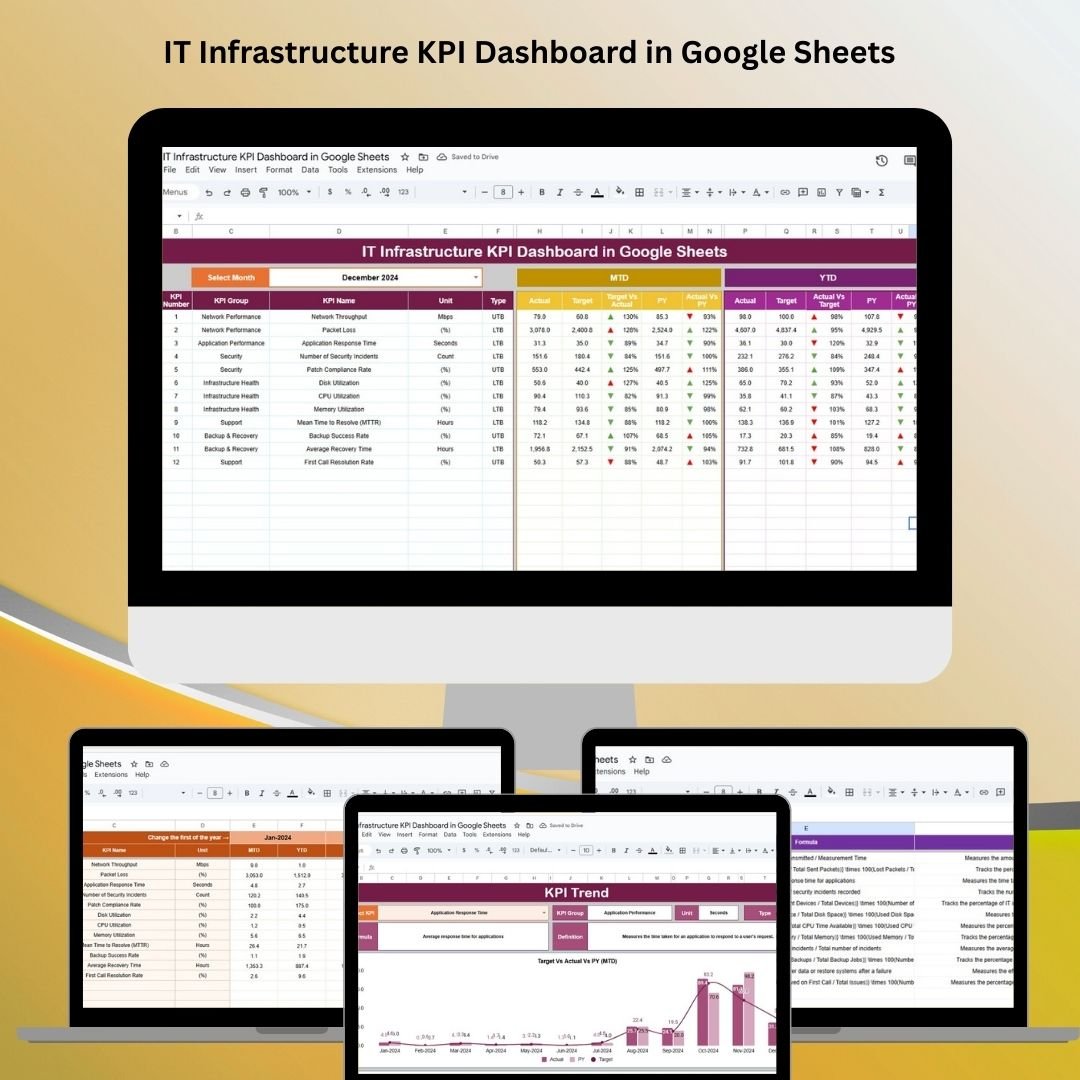

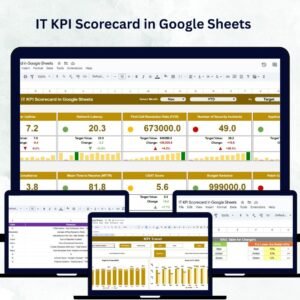
The IT Infrastructure KPI Dashboard in Google Sheets is a powerful, customizable tool that helps IT professionals track, monitor, and optimize the performance of key IT infrastructure metrics. Whether you manage a small business or a large corporation, this ready-to-use dashboard provides real-time insights into system health, uptime, response times, and more. It helps you quickly identify issues, assess performance trends, and make data-driven decisions for your organization’s IT operations.
📊 What’s Inside the IT Infrastructure KPI Dashboard 📊
The IT Infrastructure KPI Dashboard consists of six key worksheets that allow you to track essential KPIs related to your IT infrastructure’s performance:
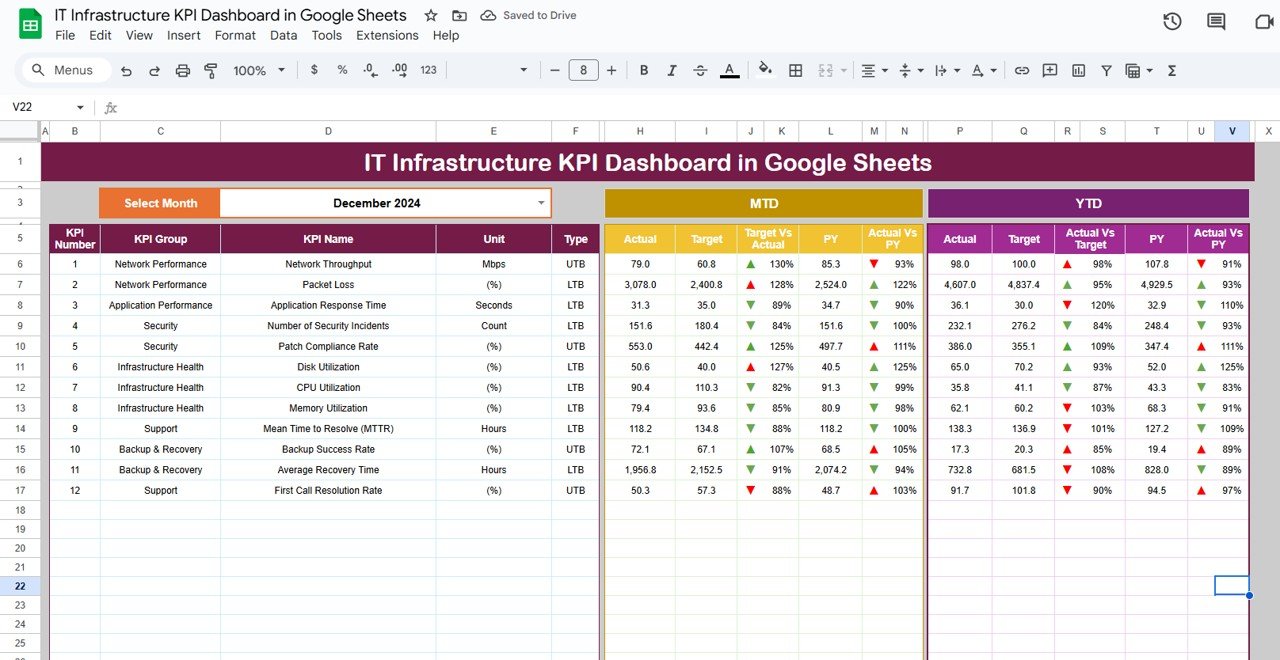
Dashboard Sheet Tab
Key Metrics Overview: The Dashboard Sheet displays all the critical KPIs in a visual format, offering an instant snapshot of your IT infrastructure’s health.
MTD (Month-to-Date) vs YTD (Year-to-Date): Compare actual performance with target and previous year data.
Performance Indicators: Track system uptime, response time, network latency, server performance, etc.
Comparative Analysis: Use conditional formatting to highlight KPIs that are underperforming, meeting targets, or exceeding expectations.
Month Dropdown (D3): Select the month for which you want to view updated data across all KPIs.
KPI Trend Sheet Tab
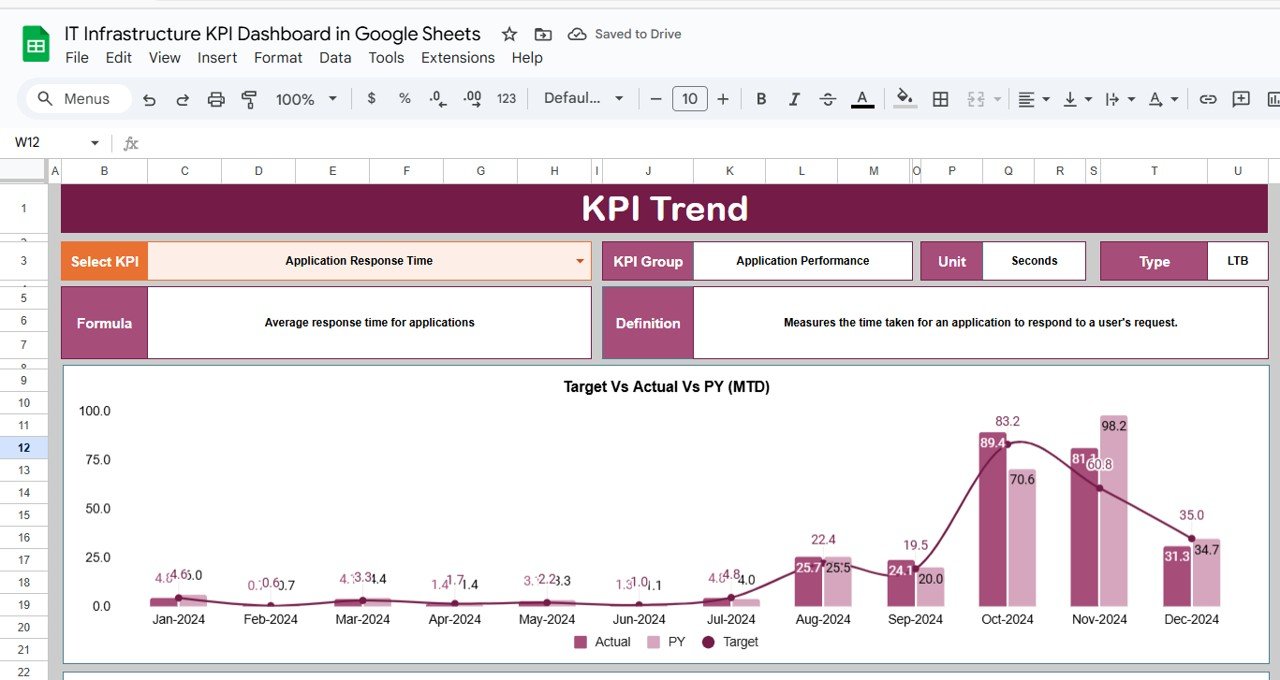
Trend Analysis: Track KPI performance over time with detailed trend lines.
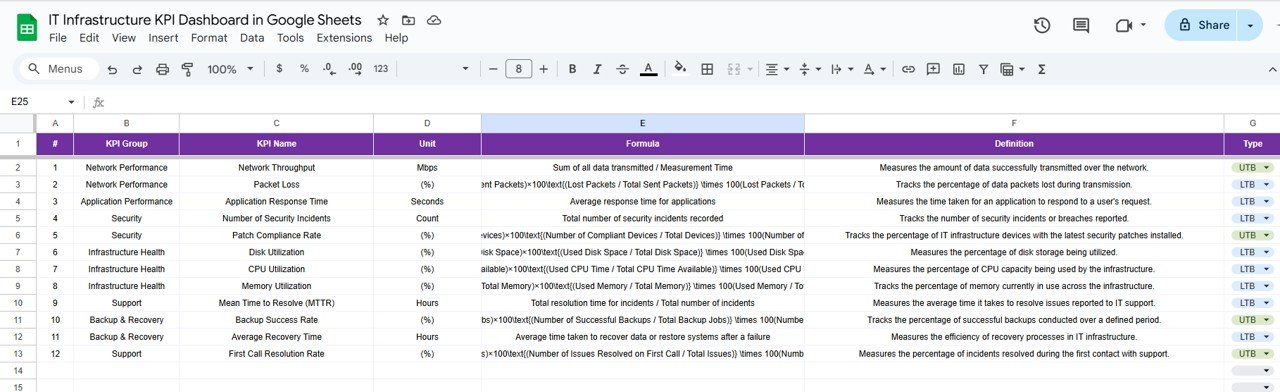
KPI Insights: View each KPI’s unit of measurement, type (e.g., “Lower the Better” or “Upper the Better”), and formula used to calculate it.
KPI Selection: Choose any KPI from the dropdown in Range C3 to analyze its trend over the last several months.
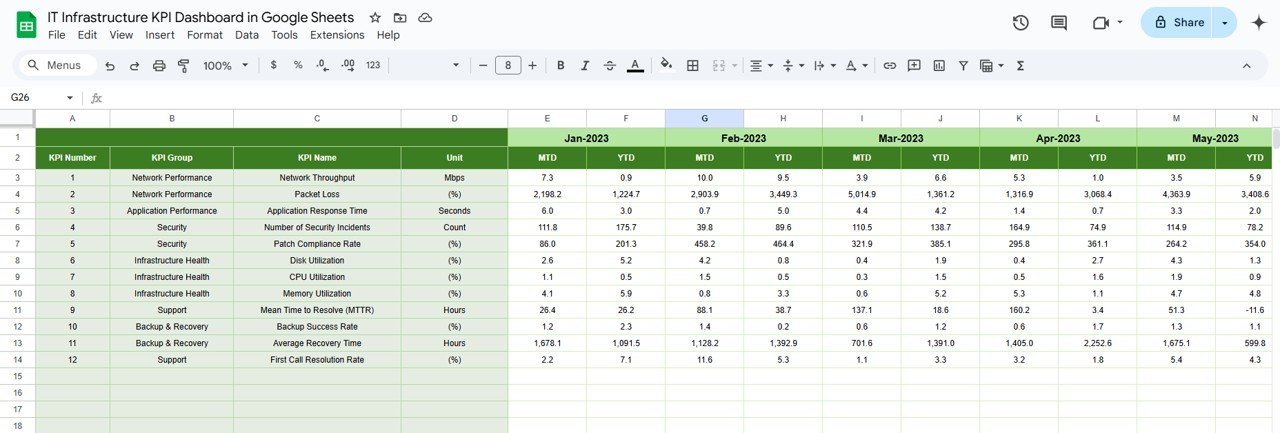
Actual Numbers Sheet Tab
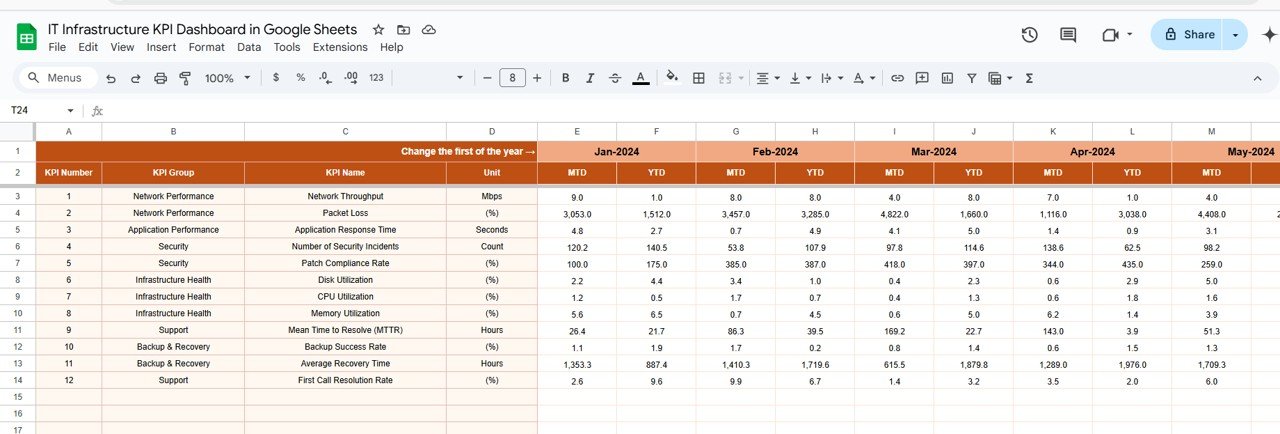
Data Input: Enter actual performance data for MTD and YTD to update the dashboard in real-time.
Month Selection: Choose the starting month of the year, and the data will update across the dashboard for easy tracking.
Target Sheet Tab
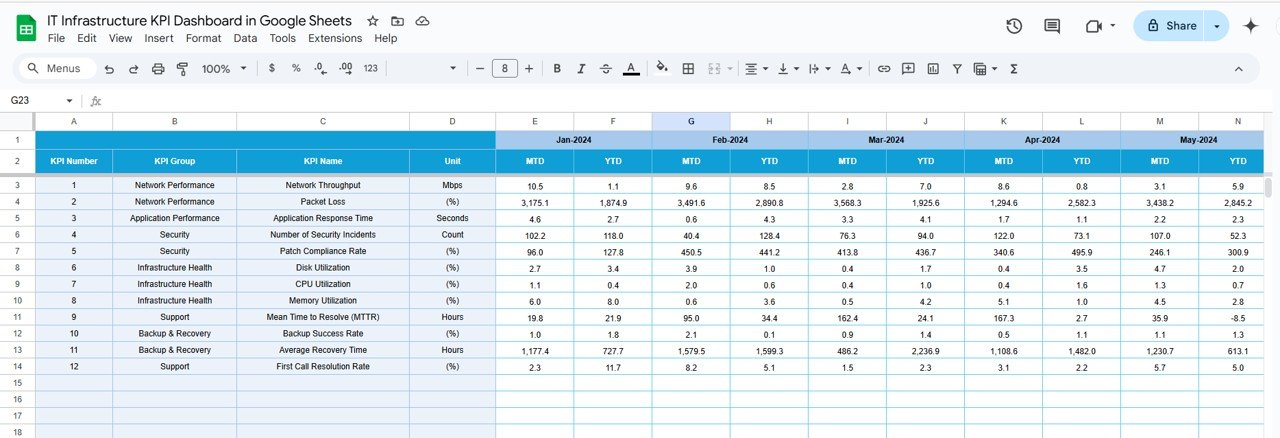
Set and Track Targets: Input target values for each KPI (both MTD and YTD) to compare against actual performance and evaluate progress.
Performance Monitoring: Quickly assess whether you’re meeting your IT goals.
Previous Year Numbers Sheet Tab
Historical Data: Track the previous year’s performance and use it for comparison against current year data, helping you identify trends and improvements.
KPI Definition Sheet Tab
KPI Definitions: This sheet provides a comprehensive list of each KPI’s definition, group, unit, and formula to ensure clarity in your data analysis.
⚙️ How to Use the IT Infrastructure KPI Dashboard ⚙️
Input Actual Data: Enter your monthly performance data in the Actual Numbers Sheet to update the dashboard in real-time.
Set Targets: Input target values for each KPI in the Target Sheet to track whether you’re meeting your IT goals.
Track and Visualize: Use the Dashboard Sheet to monitor KPIs, track progress against targets, and view performance comparisons.
Analyze Trends: Use the KPI Trend Sheet to view historical performance and track the evolution of your IT infrastructure metrics.
Review and Adjust: Regularly update your data and use the Previous Year Numbers Sheet to evaluate the performance against last year’s data and identify opportunities for improvement.
🔧 Who Can Benefit from This IT Infrastructure KPI Dashboard 🔧
IT Managers: Track system performance, ensure uptime, and optimize infrastructure for improved efficiency.
Network Engineers: Monitor network latency, traffic, and response times to maintain smooth operations.
System Administrators: Use this dashboard to ensure server performance, uptime, and capacity utilization meet expectations.
CIOs and CTOs: Gain high-level insights into IT infrastructure health to make data-driven decisions.
Business Analysts: Analyze trends in IT performance to predict potential bottlenecks and recommend corrective actions.
🌟 Benefits of Using the IT Infrastructure KPI Dashboard 🌟
Real-Time Monitoring: Track KPIs in real-time to identify performance bottlenecks and fix issues quickly.
Data-Driven Decision Making: Make informed decisions based on accurate, up-to-date data about your IT systems.
Improved Reporting: Automate the process of tracking performance metrics, saving time on manual data entry and reducing errors.
Enhanced Team Collaboration: Google Sheets allows for easy collaboration among team members, so everyone stays aligned on performance goals.
Comprehensive KPI Tracking: Monitor all key metrics in one centralized dashboard for a comprehensive view of your IT infrastructure.
Customizable: Tailor the dashboard to meet your organization’s unique IT needs by adding or removing KPIs as required.
Click here to read the detailed blog post
Watch the step-by-step video Demo:
Visit our YouTube channel to learn step-by-step video tutorials
Compatibility and Requirements
- Works in Google Sheets. You need a free Google account and a web browser.
- You pick the month from a dropdown in cell D3 of the Dashboard sheet. Google explains dropdowns in Create an in-cell dropdown list.
Frequently Asked Questions
Which sheets are included?
Six sheets: Dashboard, KPI Trend, Actual Numbers, Target, Previous Year Numbers and KPI Definition.
Which metrics can I track?
Metrics such as system uptime, response time, network latency and server performance, with MTD and YTD actuals against targets and previous year data.
How do I check the trend for one KPI?
Pick the KPI from the dropdown in cell C3 of the KPI Trend sheet. It also shows the unit, the type (Lower the Better or Upper the Better) and the formula.
Can my year start in a month other than January?
Yes. Choose the starting month in the Actual Numbers sheet and the dashboard follows it.
Is there an Excel or Power BI version?
Yes. See the IT Infrastructure KPI Dashboard in Excel and the IT Infrastructure KPI Dashboard in Power BI.
Related IT Templates
- IT Infrastructure KPI Dashboard in Excel: the same KPIs in Excel
- IT Infrastructure KPI Dashboard in Power BI: the Power BI edition
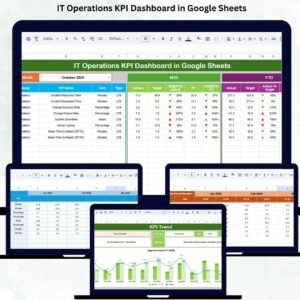
- IT Operations KPI Dashboard in Google Sheets: KPIs for day to day IT operations
- Network Performance KPI Dashboard in Google Sheets: focus on network KPIs
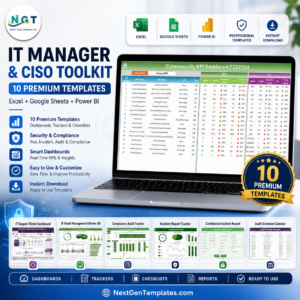
- IT Manager & CISO Toolkit: 10 IT templates in one download
Browse all Google Sheets KPI dashboards.













Reviews
There are no reviews yet.