


The IT Infrastructure KPI Dashboard in Power BI is an essential tool for IT managers, system administrators, and organizations looking to monitor and optimize their IT infrastructure. This Power BI-based dashboard provides real-time insights into critical IT metrics such as system uptime, network performance, server health, application performance, and more. By visualizing key performance indicators (KPIs) in a centralized location, businesses can ensure the efficiency and reliability of their IT operations.
This dashboard enables proactive management of IT infrastructure, helping teams quickly identify issues, optimize resources, and minimize downtime. Whether you’re overseeing a small office network or a large-scale enterprise IT system, this tool is designed to help you monitor, report, and improve the performance of your IT infrastructure efficiently.
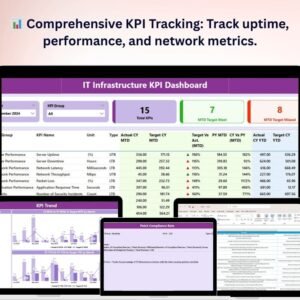
Key Features of the IT Infrastructure KPI Dashboard in Power BI
📊 Comprehensive KPI Tracking
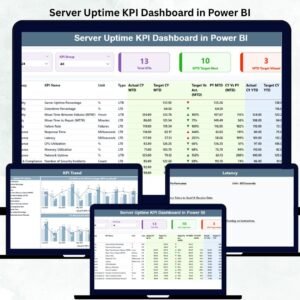
Track key IT metrics such as server uptime, network latency, application performance, bandwidth utilization, and system errors. Monitor the health and performance of your infrastructure in real-time to ensure optimal operation.
⚙️ Proactive Issue Identification
Identify potential issues before they affect system performance. The dashboard allows you to monitor various IT components such as servers, networks, and applications, alerting you to any performance degradation or potential failures.
📅 Time-Based Performance Analysis
Analyze your IT infrastructure performance over different periods (daily, weekly, monthly). Use this time-based data to identify trends and patterns, allowing you to make informed decisions about resource allocation and system optimization.
🛠 System & Network Monitoring
Monitor critical components of your IT infrastructure such as servers, network devices, and applications. Gain visibility into network traffic, server load, and application performance to ensure systems are running at peak efficiency.
🔑 Real-Time Data Integration
Integrate data from your IT systems, including monitoring tools, servers, and network devices, to get real-time insights into your infrastructure’s performance. This ensures that you’re always working with the most accurate and up-to-date data.
⚙️ Customizable Dashboards
Customize the dashboard to reflect your specific IT infrastructure requirements. Add or modify KPIs and metrics based on your company’s technology stack, making it adaptable to various industries and IT environments.
Why You’ll Love the IT Infrastructure KPI Dashboard in Power BI

✅ Real-Time Monitoring of IT Health
Stay on top of the performance of your IT infrastructure with real-time monitoring of servers, network devices, and applications. Detect and address issues before they become major problems.
✅ Optimize Resource Allocation
Track system performance and identify areas where resources can be optimized, helping you to make informed decisions about hardware upgrades and system scaling.
✅ Increase Operational Efficiency
By monitoring KPIs and identifying potential issues early, you can reduce system downtime and improve overall operational efficiency. Keep your IT systems running smoothly and efficiently.
✅ Data-Driven Decisions for IT Improvements
Use the data and insights gathered from the dashboard to make data-driven decisions that improve IT infrastructure, enhance performance, and align with business goals.
✅ Customizable for Your IT Needs
The dashboard is highly customizable and can be adapted to suit the unique requirements of your IT infrastructure. Whether you’re managing cloud-based services, on-premises servers, or hybrid environments, this tool provides the flexibility you need.
What’s Inside the IT Infrastructure KPI Dashboard in Power BI?
-
Comprehensive KPI Tracking: Monitor system uptime, server performance, and network latency.
-
Proactive Issue Identification: Detect potential issues in real-time and take proactive action.
-
Time-Based Performance Analysis: Review performance over various timeframes to identify trends.
-
System & Network Monitoring: Track critical IT components and their health in real-time.
-
Real-Time Data Integration: Integrate data from monitoring tools, servers, and networks for accurate insights.
-
Customizable Metrics & Dashboards: Tailor the dashboard to reflect your organization’s IT needs.
How to Use the IT Infrastructure KPI Dashboard in Power BI
1️⃣ Download the Template: Get access to the IT Infrastructure KPI Dashboard in Power BI instantly.
2️⃣ Integrate Your Data Sources: Link the dashboard to your IT monitoring tools, servers, and network systems for real-time data.
3️⃣ Track KPIs & Performance: Monitor key IT metrics such as uptime, network performance, and server health.
4️⃣ Analyze Trends & Insights: Use time-based performance analysis to understand trends and areas for improvement.
5️⃣ Optimize Your IT Infrastructure: Leverage insights to optimize resources, prevent issues, and improve overall IT performance.
Who Can Benefit from the IT Infrastructure KPI Dashboard in Power BI?
🔹 IT Managers & System Administrators
🔹 Network Engineers & Technicians
🔹 IT Infrastructure & Operations Teams
🔹 Chief Information Officers (CIOs)
🔹 Small & Medium Enterprises (SMBs)
🔹 Large Enterprises with Complex IT Environments
🔹 Managed Service Providers (MSPs)
Take control of your IT infrastructure’s performance with the IT Infrastructure KPI Dashboard in Power BI. Monitor key metrics, identify issues early, and optimize your resources for better efficiency and reliability.
Click here to read the Detailed blog post
Visit our YouTube channel to learn step-by-step video tutorials
Youtube.com/@PKAnExcelExpert


Reviews
There are no reviews yet.