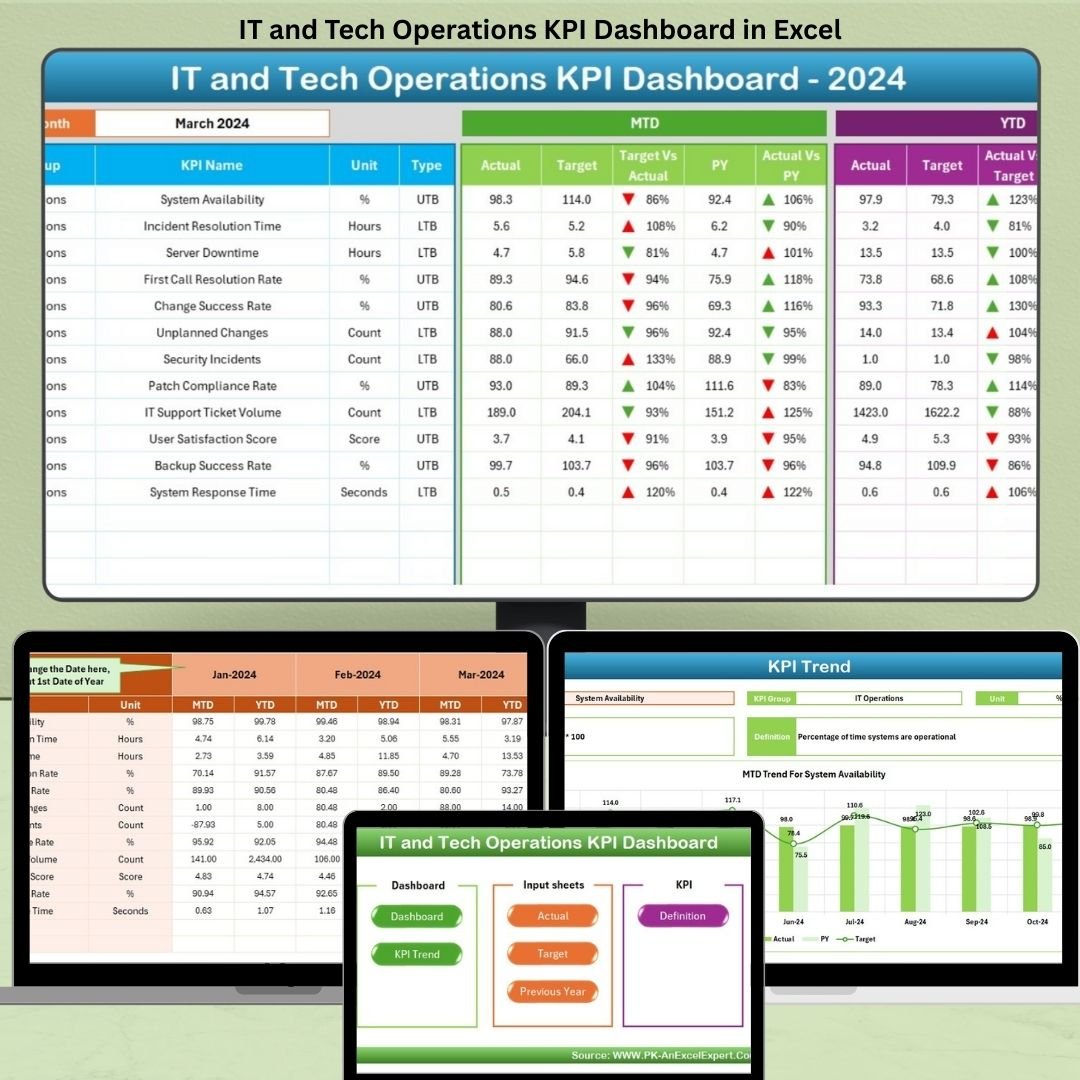
This plug-and-play Excel dashboard helps IT and Tech Operations KPI Dashboard, analysts, and tech leads monitor critical KPIs with clarity and precision. Whether you’re tracking system uptime, helpdesk response times, or project delivery, this tool turns raw data into actionable insights—no expensive software or complex setups required.
✨ Key Features of IT & Tech Operations KPI Dashboard
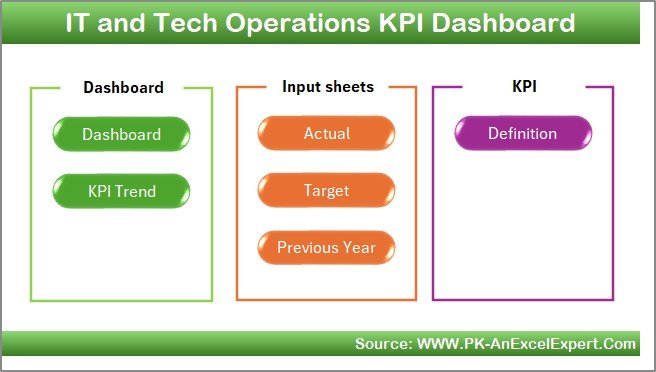
🏠 Home Sheet – One-Click Navigation
Access every section of the dashboard from one central hub using 6 easy buttons.
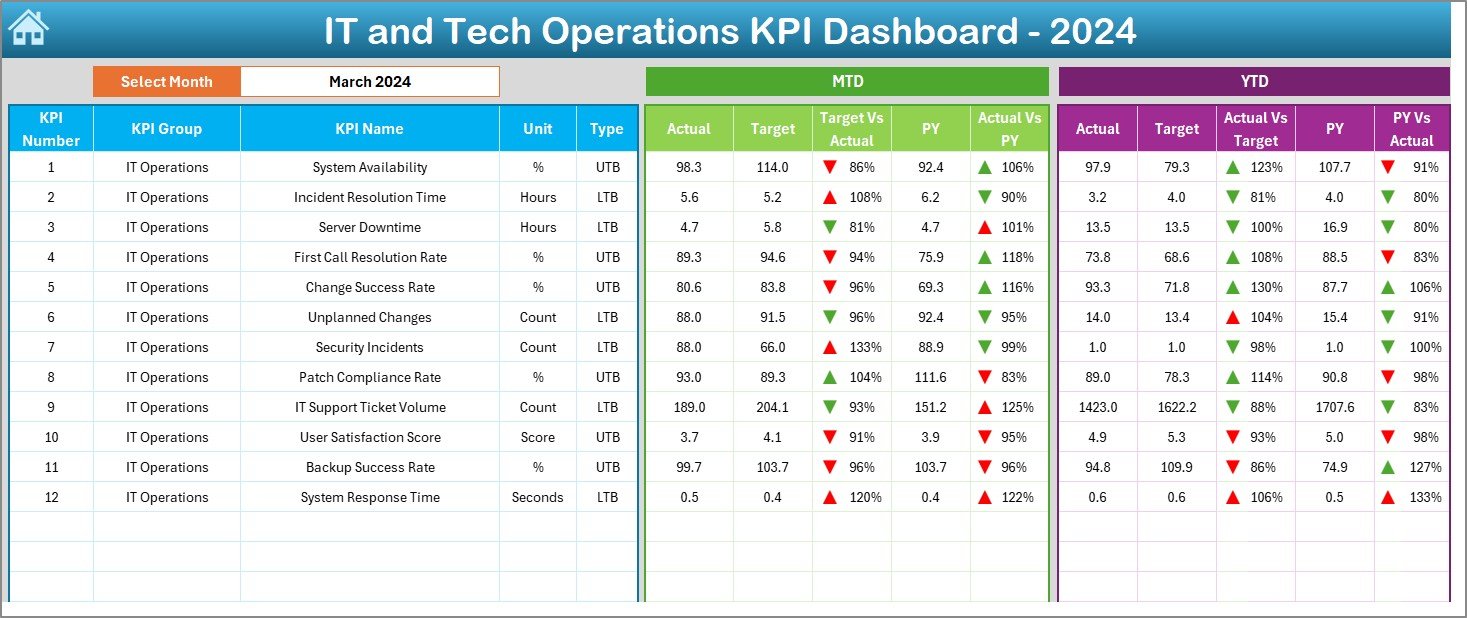
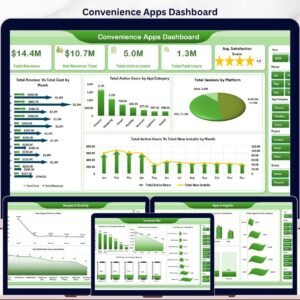
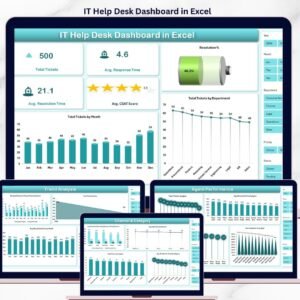
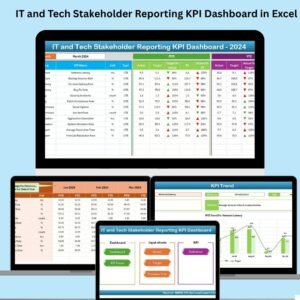
📊 Dashboard Sheet – Real-Time Performance Snapshot
Select any month and view:
-
✅ MTD (Month-To-Date) Actual vs Target vs Previous Year
-
📅 YTD (Year-To-Date) performance with visual indicators
-
🔺🔻 Conditional arrows for quick trend spotting
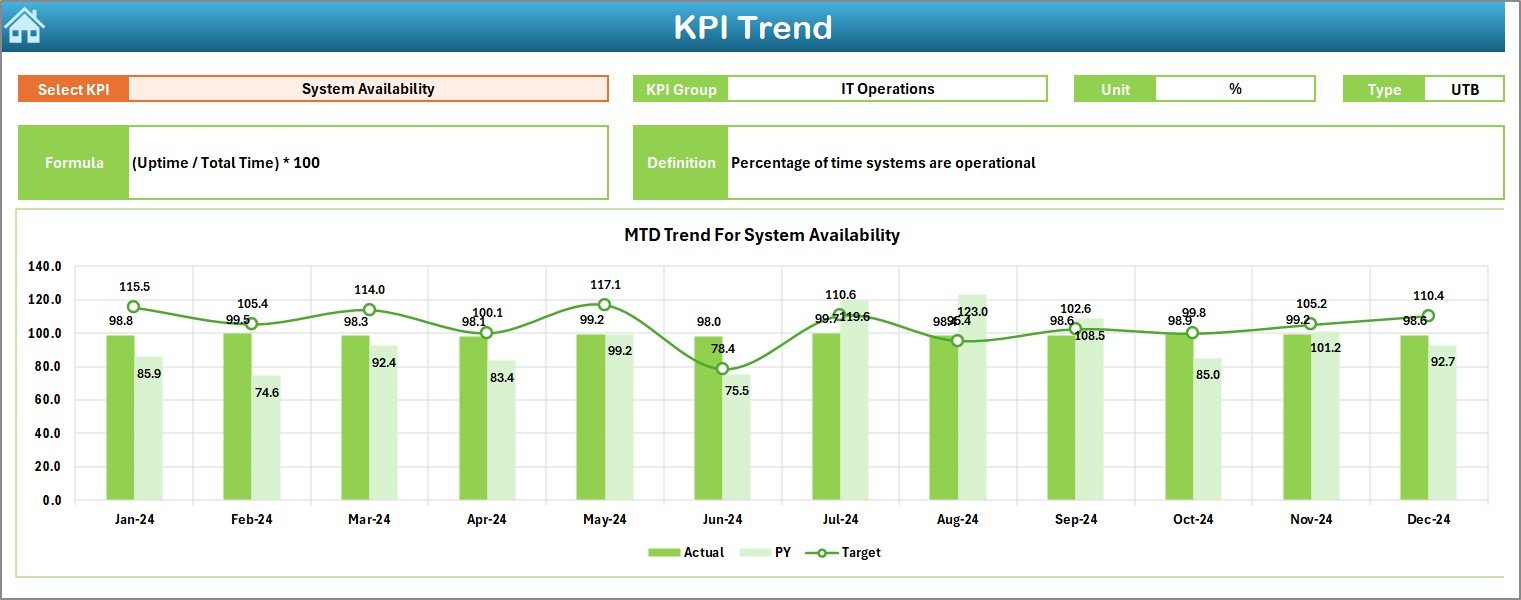
📈 KPI Trend Sheet – Analyze Growth Over Time
Choose any KPI and see:
-
KPI Group, Unit, Formula, Type (LTB/UTB)
-
MTD and YTD trends with easy-to-read charts
-
Comparative data vs Target and Previous Year
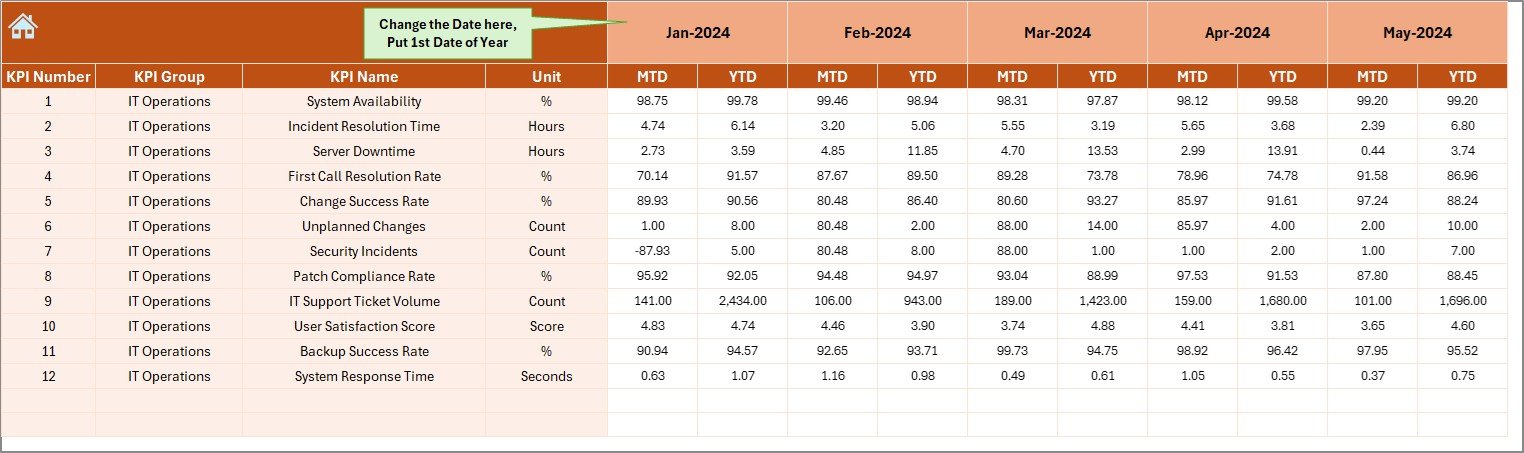
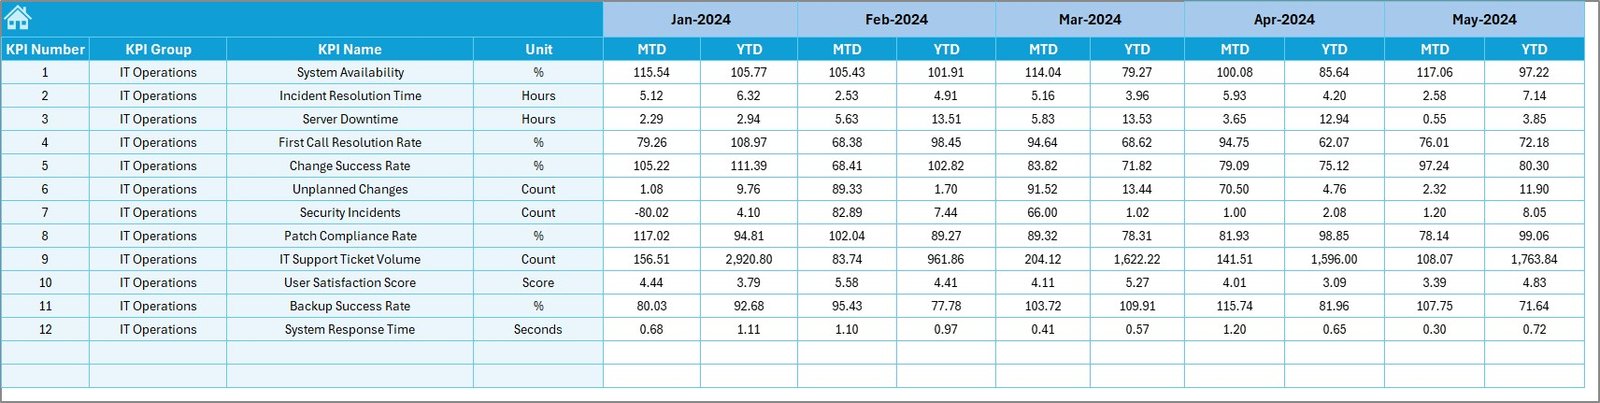
📥 Actual Numbers Input Sheet
Input your latest MTD and YTD values. Adjust the starting month in one cell and update numbers with ease.
🎯 Target Sheet
Enter monthly targets for each KPI. This allows for performance benchmarking within the dashboard.
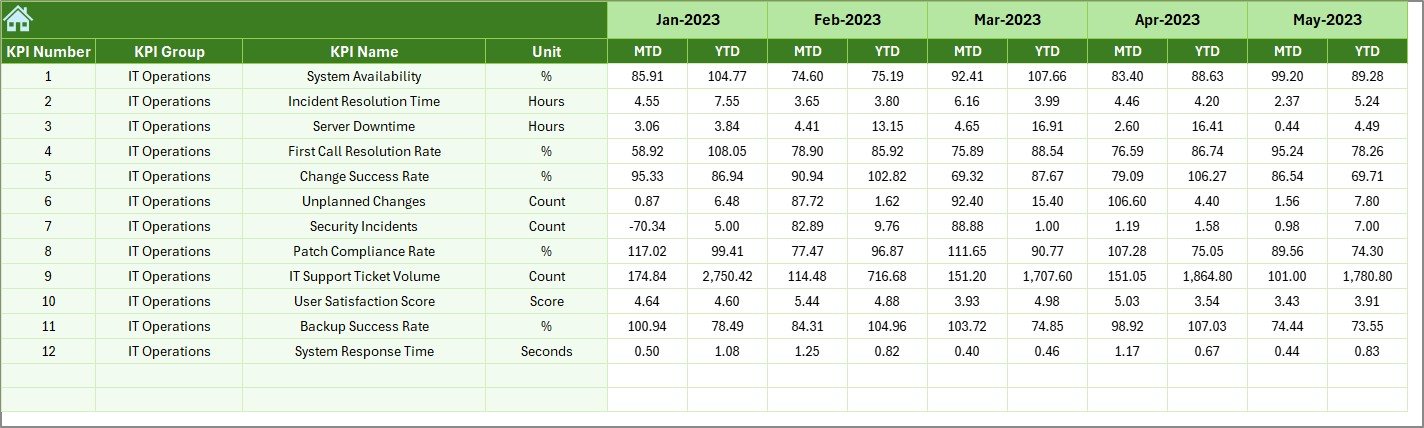
🕘 Previous Year Numbers Sheet
Add prior-year data to enable historical analysis and improve forecasting accuracy.
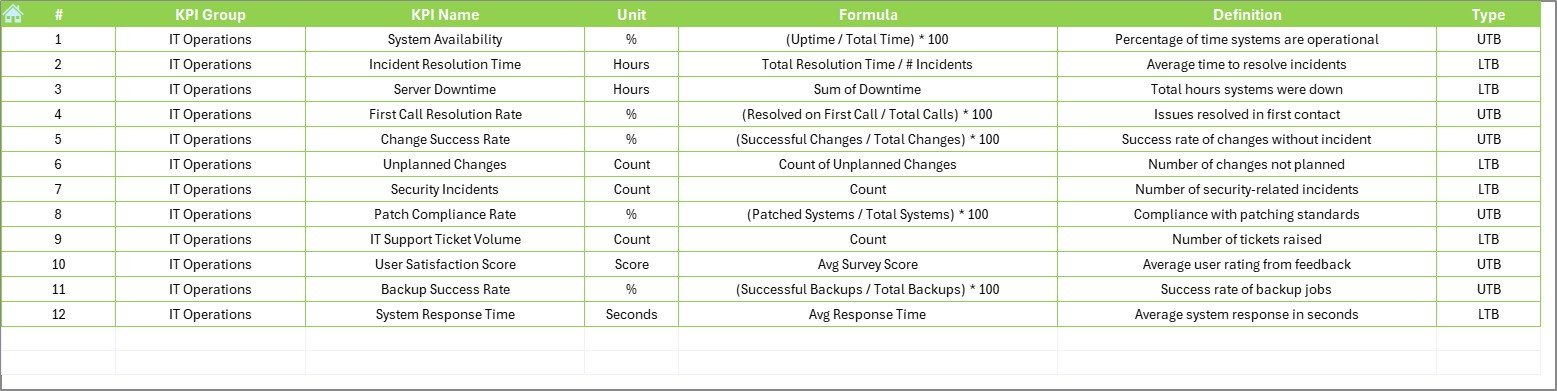
📘 KPI Definition Sheet
Define all your KPIs clearly with:
-
Name, Unit, Formula
-
Group & Performance Type
-
Simple definitions your whole team can understand
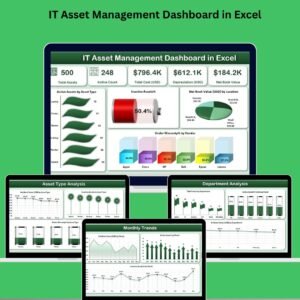
📦 What’s Inside the IT KPI Dashboard?
-
Excel file (.xlsx) with 7 fully linked worksheets
-
Built-in slicers, drop-downs, and charting tools
-
Conditional formatting for performance flags
-
Auto-calculated trends and comparisons
-
Editable fields for full customization
-
No VBA or coding required
🛠 How to Use the Dashboard
-
Define KPIs
Start with the KPI Definition Sheet. Add names, types, formulas, and measurement units. -
Input Historical Data
Fill in the Previous Year Numbers Sheet to enable year-over-year comparisons. -
Set Your Targets
Add monthly goals in the Target Sheet to track performance gaps. -
Update Actuals Monthly
Enter current data in the Actual Numbers Input Sheet. Everything else updates automatically. -
Review Your Dashboard
Head to the Dashboard Sheet and select your reporting month. Analyze progress with ease. -
Dive into KPI Trends
Use the KPI Trend Sheet to monitor changes and performance across time.
👥 Who Should Use This Template?
✅ IT Managers – Get full visibility into operations and performance metrics
✅ System Admins & Tech Leads – Monitor uptime, response times, and issue resolution
✅ Project Managers – Track timelines, delivery rates, and backlog
✅ CIOs & Executives – Present clear, visual insights to stakeholders
✅ Helpdesk Teams – Improve service levels with measurable KPIs
This tool works for businesses of all sizes—whether you’re managing a small tech team or a global IT infrastructure.
📘 Click here to read the Detailed blog post
🎥 Visit our YouTube channel to learn step-by-step video tutorials


Reviews
There are no reviews yet.