

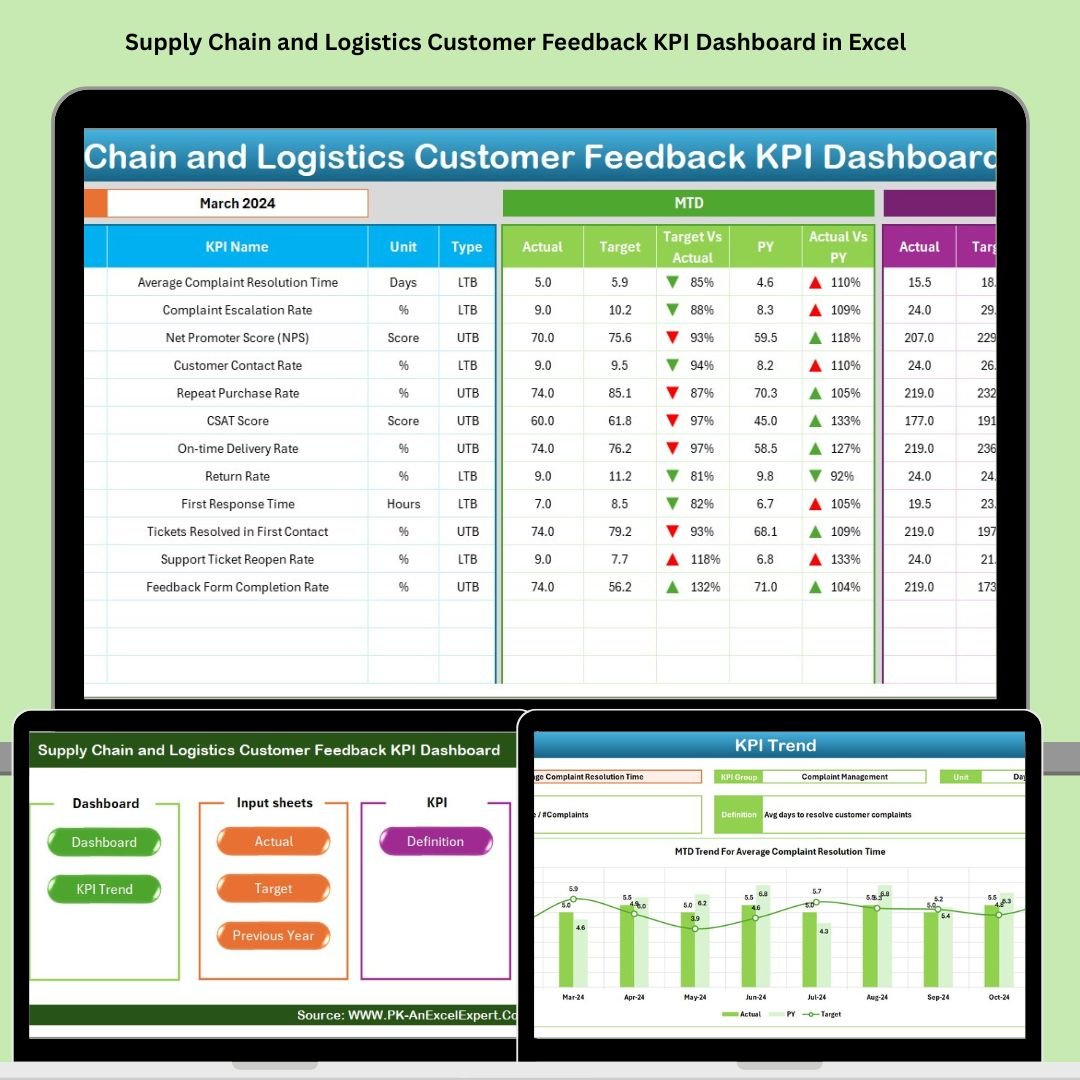
In supply chain and logistics, customer feedback is your most powerful performance indicator. If you’re serious about improving delivery satisfaction, resolving complaints faster, and tracking customer sentiment—then the Supply Chain and Logistics Customer Feedback KPI Dashboard in Excel is your go-to tool.
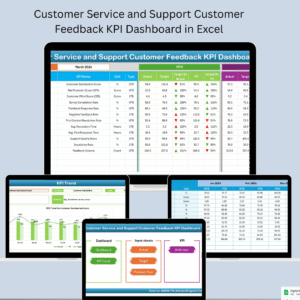
This smart, ready-to-use dashboard helps you monitor the KPIs that matter most to your customers. Built in Excel with dynamic visuals, drop-down selectors, and automated charts, it gives you real-time visibility into Monthly (MTD) and Year-to-Date (YTD) performance—without needing any coding or expensive software.
✨ Key Features of the Dashboard
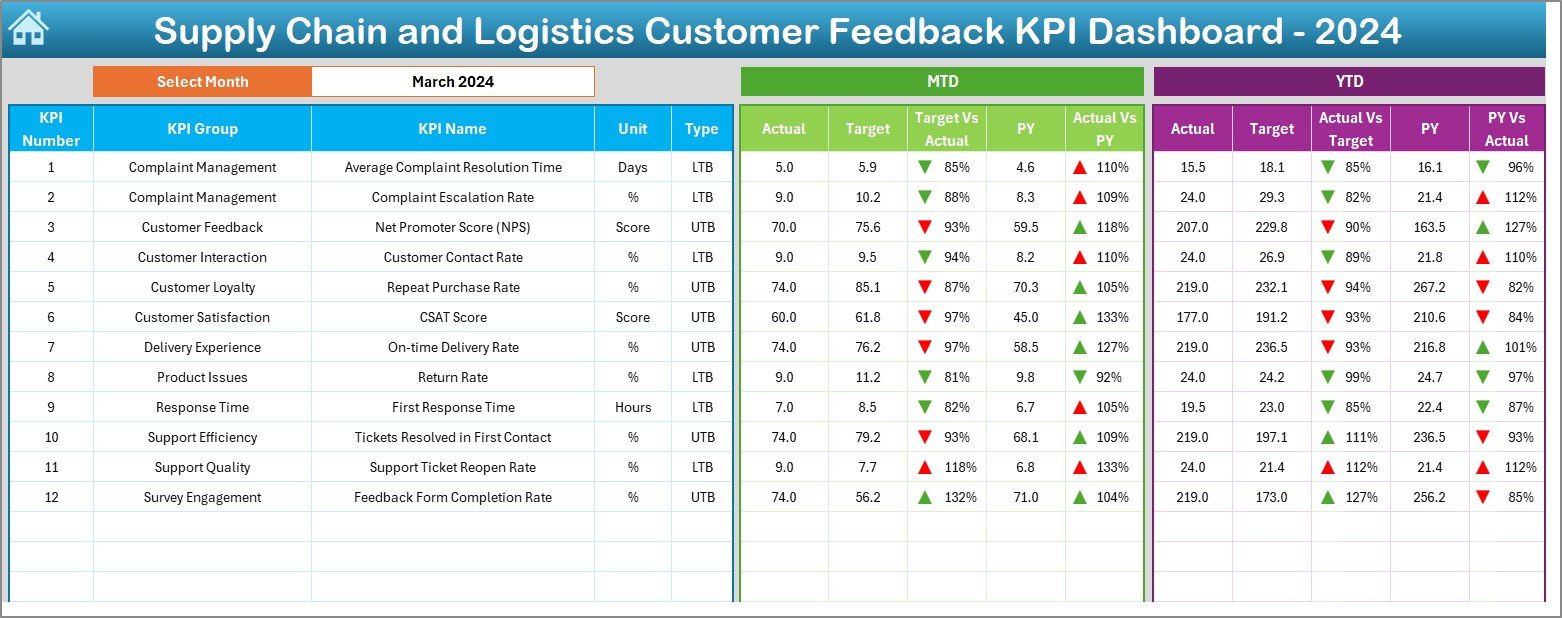
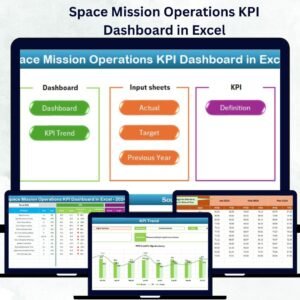
📋 Interactive Dashboard Sheet
Select any month using a drop-down (cell D3)
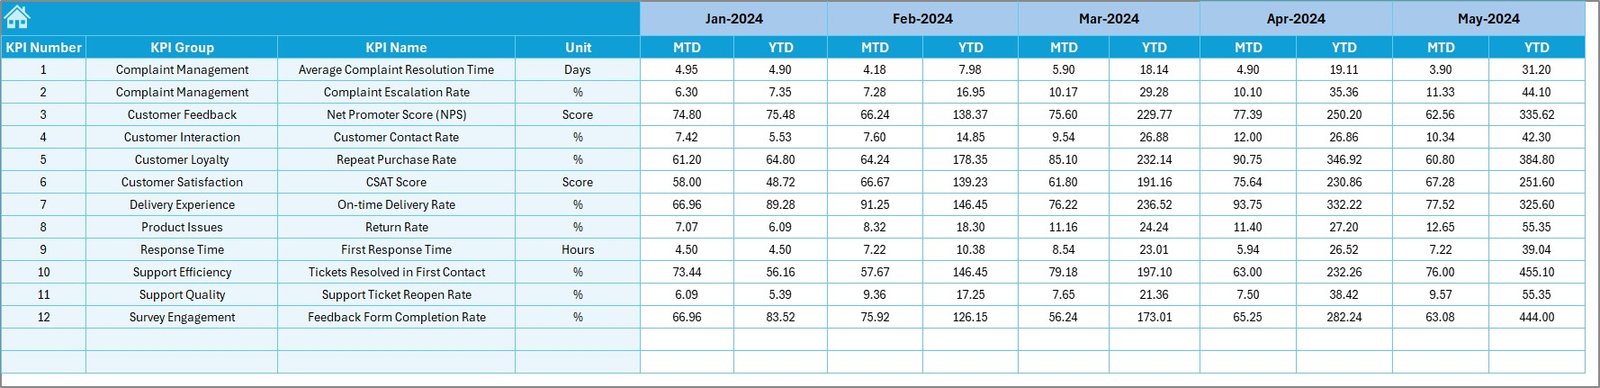
Automatically updates Actual vs. Target vs. Previous Year data
Shows arrows and formatting to flag performance issues
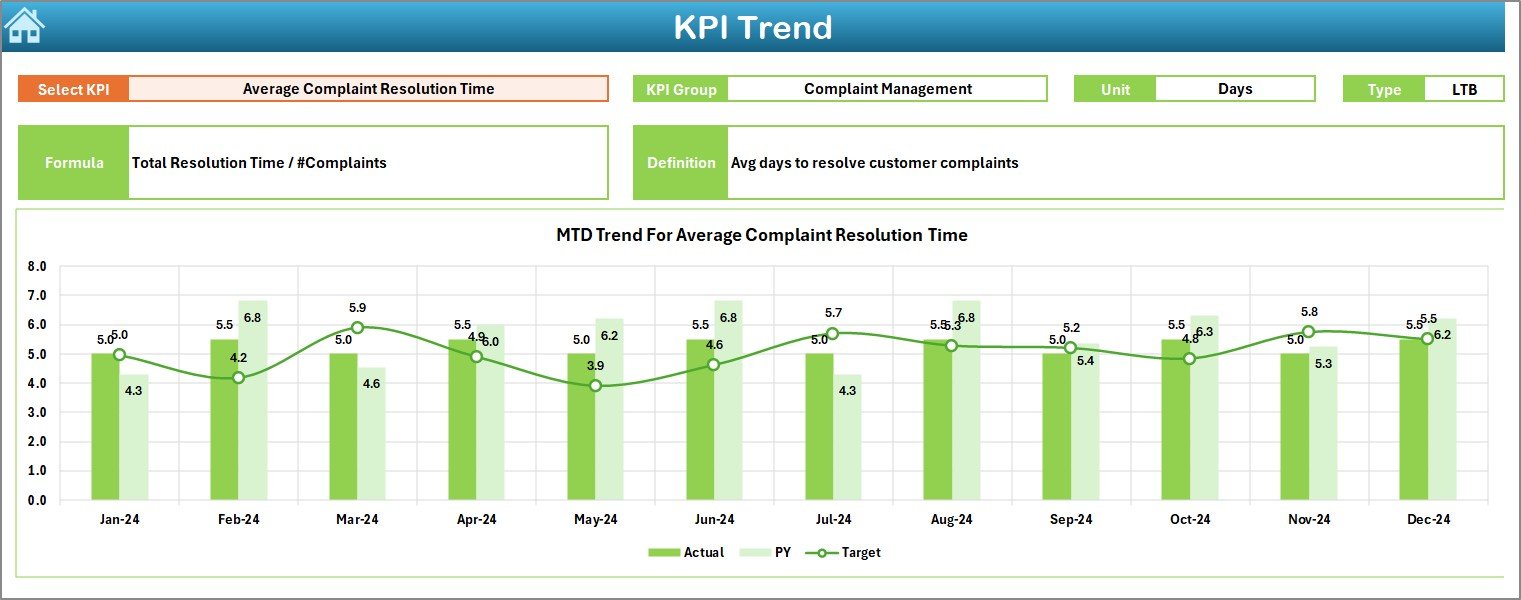
📈 KPI Trend Sheet
Choose any KPI from a drop-down menu
View trend charts for MTD/YTD performance over time
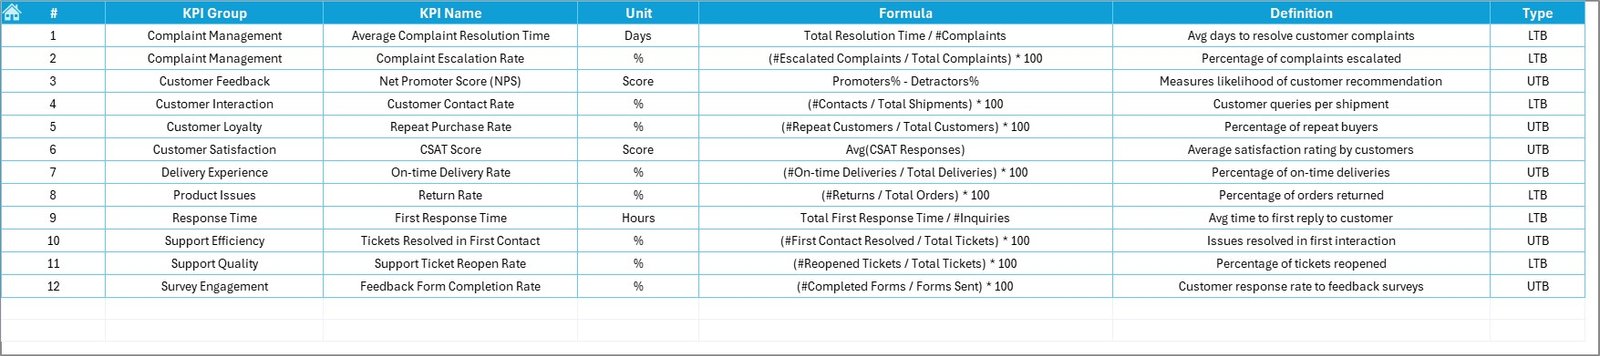
Get details like KPI type (UTB/LTB), unit, formula, and definition
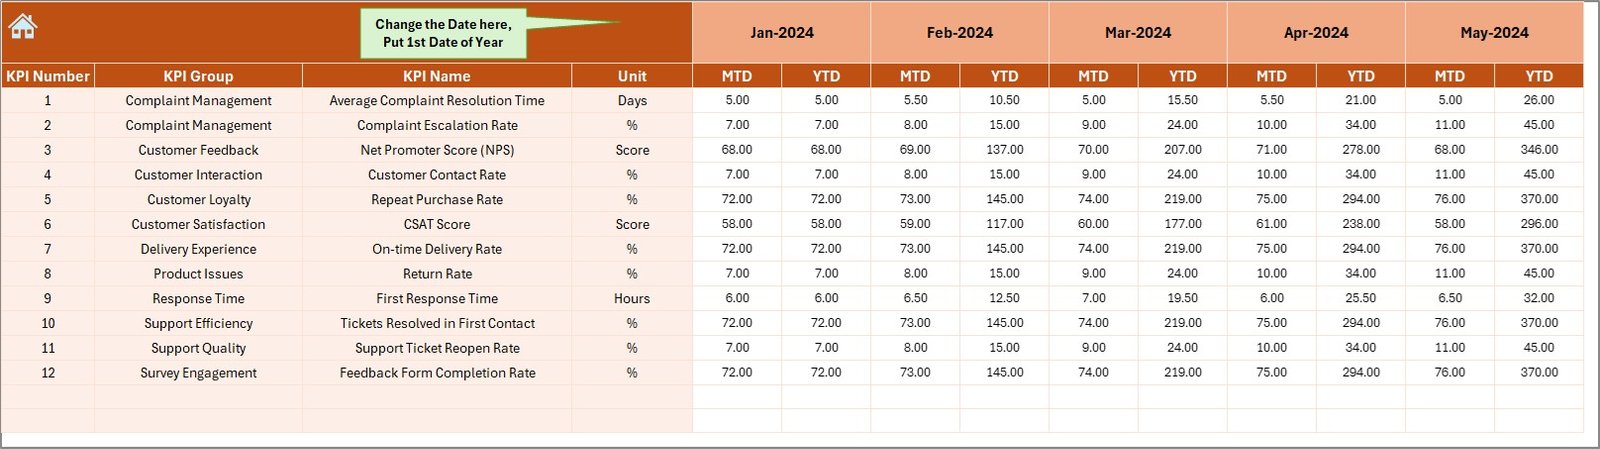
🧾 Input and Comparison Sheets
Actual Numbers Input – Enter KPI results monthly
Target Sheet – Set MTD and YTD goals for each KPI
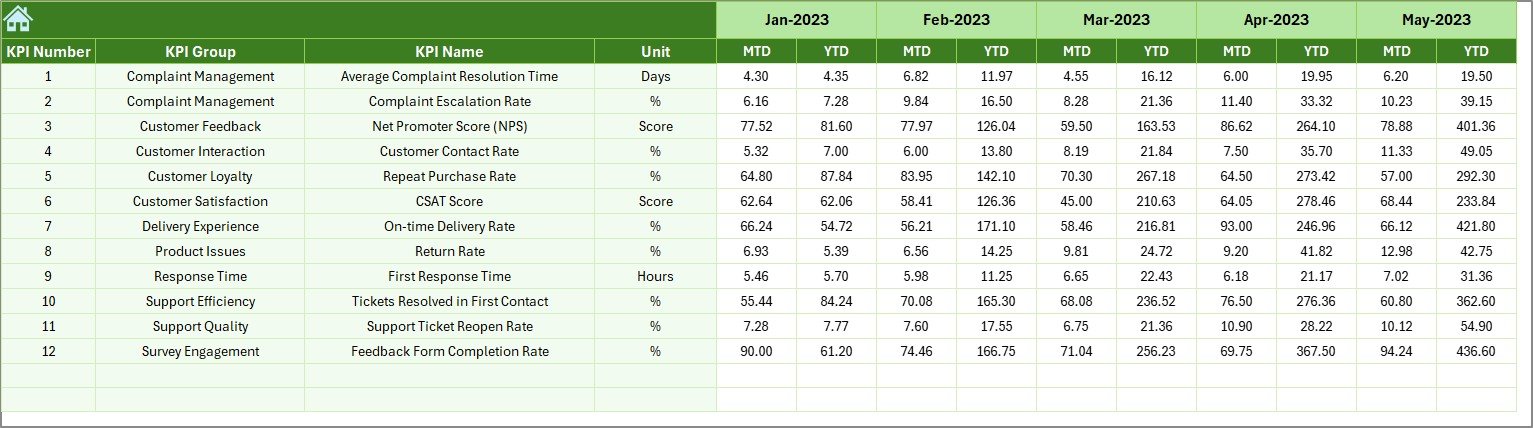
Previous Year Sheet – Maintain historic values for comparison
📘 KPI Definition Sheet
Document every KPI’s group, formula, and goal
Maintain clarity and team-wide understanding
🏠 Home Sheet with Quick Access
Navigate through the dashboard in one click
Simple layout for first-time users
📂 What’s Inside the Dashboard Package?
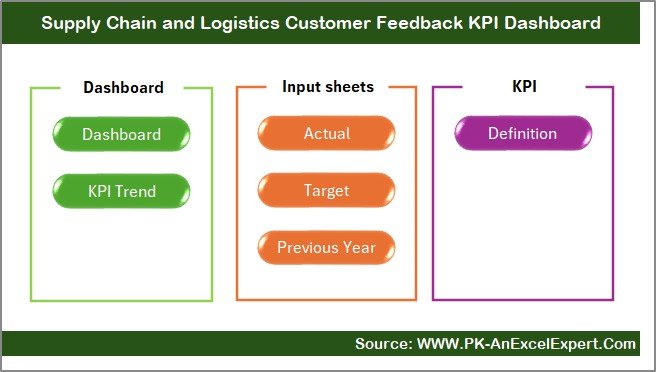
✔️ 7 Pre-built Excel Worksheets
✔️ Auto-calculating MTD/YTD Visuals
✔️ Up/Down Arrows to Spot Issues Instantly
✔️ Trend Charts for KPI Analysis
✔️ Flexible Drop-downs and Monthly Selectors
✔️ Fully Customizable Design and Fields
👥 Who Should Use This Dashboard?
🚛 Logistics Managers – Monitor delivery satisfaction and complaint resolution KPIs
💬 Customer Service Leads – Track issue resolution time, feedback scores, and NPS
📦 Operations Heads – Ensure processes are aligned with customer expectations
📊 Business Analysts – Use trend insights for monthly reports or improvement plans
📌 Popular KPIs You Can Track
✅ Delivery Satisfaction Score
✅ Net Promoter Score (NPS)
✅ Customer Complaint Rate
✅ Average Resolution Time
✅ Return Handling Accuracy
✅ First-Time Delivery Success Rate
✅ Issue Escalation Rate
✅ Time to Acknowledge Complaints
✅ Refund Time per Case
✅ Feedback Response Rate
Each KPI is labeled as UTB (Upper the Better) or LTB (Lower the Better) based on business targets.
🔧 How to Use the Dashboard in 5 Easy Steps
Download the Excel File
Go to the Actual Numbers Input Sheet and enter monthly data
Set your MTD/YTD Targets in the Target Sheet
Enter Last Year’s Data for comparison
View Results in the Dashboard & KPI Trend Sheets
Watch the visuals change in real time when you switch months!
🔗 Click here to read the Detailed blog post
📺 Visit our YouTube channel to learn step-by-step video tutorials









Reviews
There are no reviews yet.