

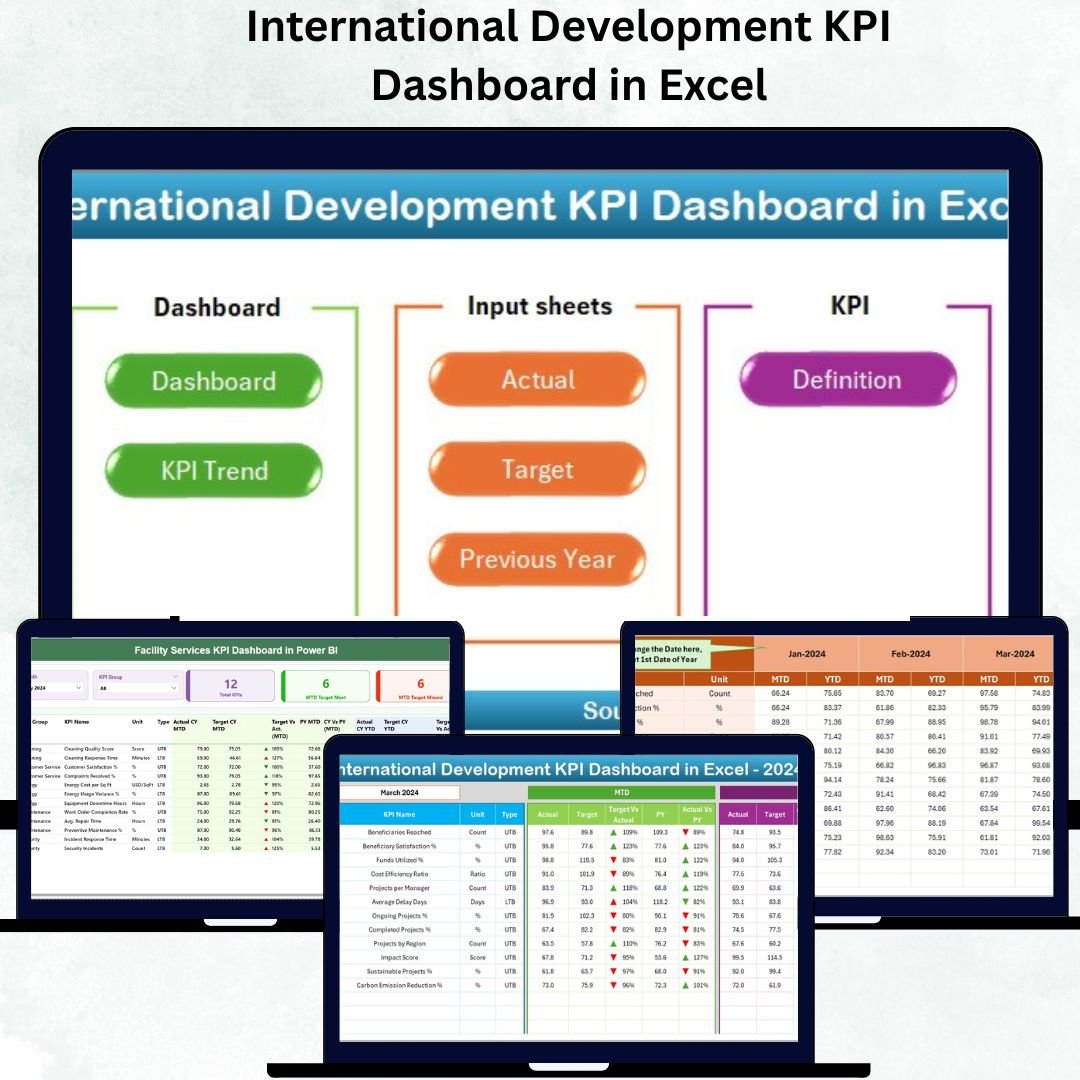


In the world of global development, data transparency and measurable results are essential for impact-driven decision-making. That’s exactly what the International Development KPI Dashboard in Excel delivers — a ready-to-use, professional, and interactive Excel tool that helps NGOs, government agencies, and donor-funded programs monitor progress, evaluate results, and make informed strategic decisions.International Development KPI Dashboard in Excel
This smart dashboard turns complex data into clear visual insights — empowering project managers and M&E professionals to track KPIs, compare performance against targets, and enhance accountability across all programs.
🧩 Key Features of the International Development KPI Dashboard in Excel
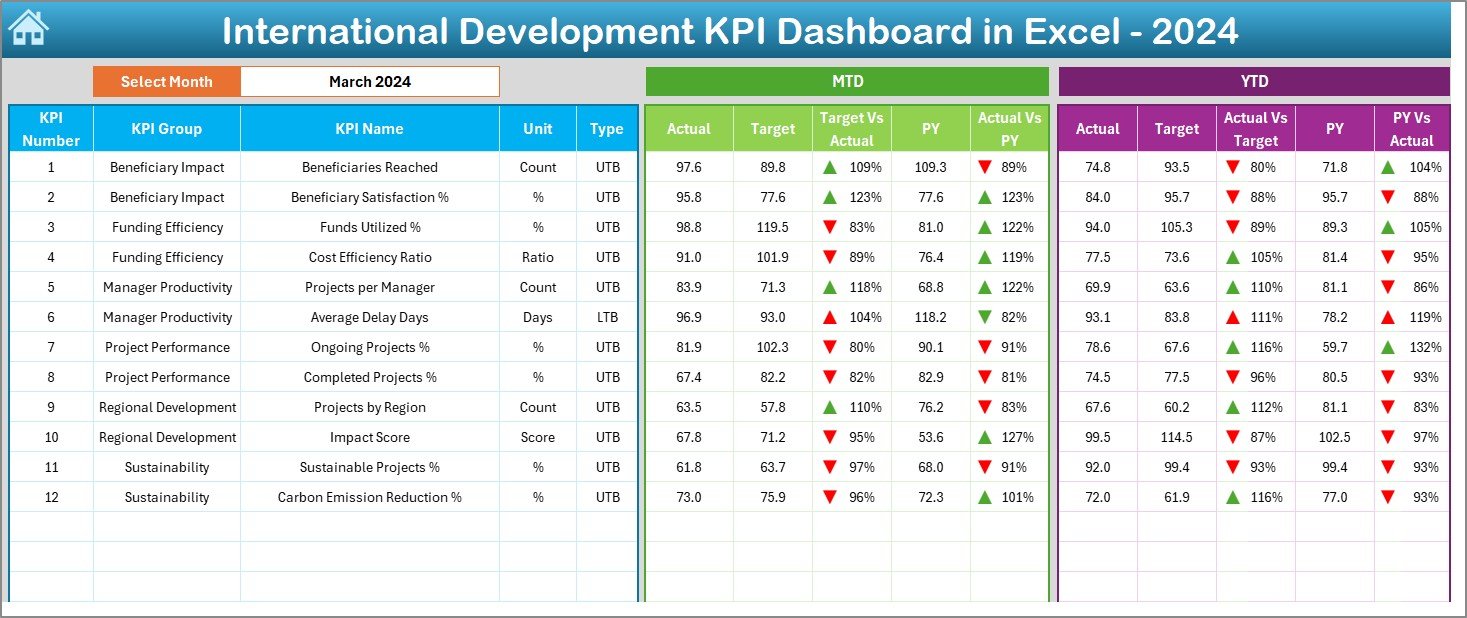
✨ Interactive Month Selector – Choose any month and watch the entire dashboard refresh automatically with updated MTD and YTD numbers.
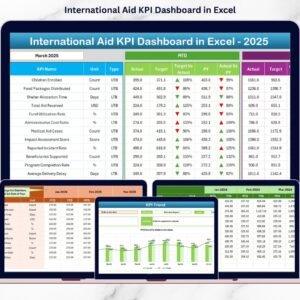
📊 MTD & YTD Analysis – Instantly compare Month-to-Date and Year-to-Date performance with Actual, Target, and Previous Year metrics.International Development KPI Dashboard in Excel
🎯 Conditional Formatting Indicators – Visual up/down arrows highlight performance trends at a glance.
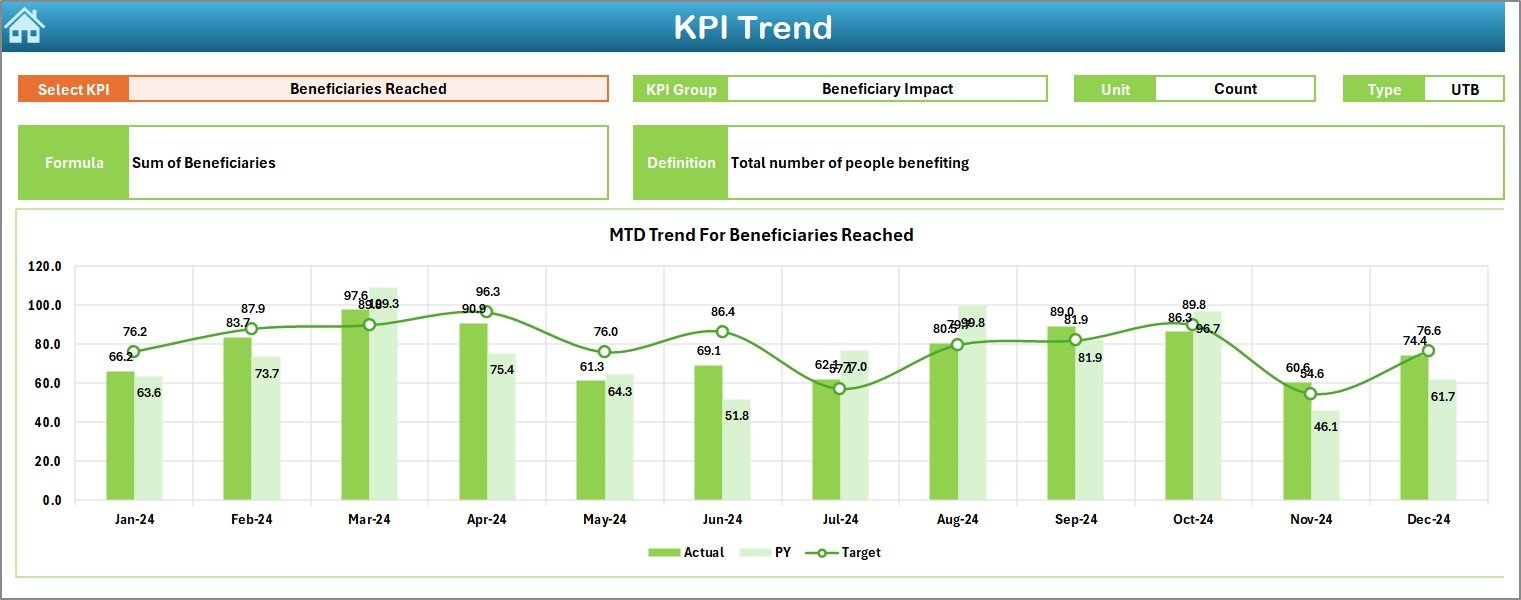
📈 Dynamic KPI Trend Charts – Dive deeper into each KPI with dynamic charts and performance visuals.
🧮 Auto-Updated Calculations – Built-in formulas compute comparisons automatically, eliminating manual effort.
💼 Professional Layout – Clean and visually appealing design suitable for donor reports and board reviews.
🧾 KPI Definition Reference – Clear KPI formulas, units, and descriptions for easy interpretation.
🖥️ No Coding or VBA Needed – Fully Excel-based, works offline, and requires no special installation.
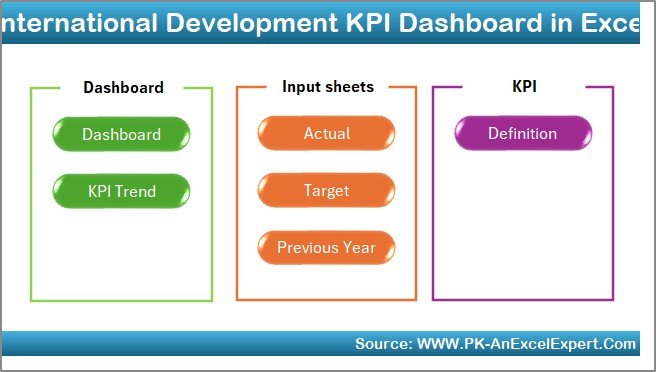
📁 Comprehensive Sheets – Includes Home, Dashboard, KPI Trend, Actual, Target, Previous Year, and Definition sheets.
📂 What’s Inside the International Development KPI Dashboard in Excel
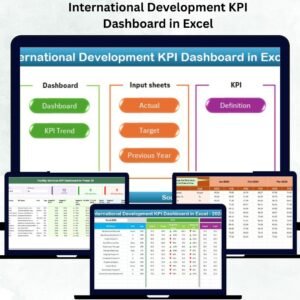
This template is structured with 7 powerful worksheets, each designed for efficiency and clarity:International Development KPI Dashboard in Excel
1️⃣ Home Sheet – Acts as the central navigation panel with clickable buttons to jump across sections.
2️⃣ Dashboard Sheet – The main analytics page that visualizes MTD, YTD, Actual vs Target, and PY comparisons with color-coded arrows.
3️⃣ KPI Trend Sheet – Analyze individual KPIs with drop-down selectors, dynamic trend charts, and historical data.
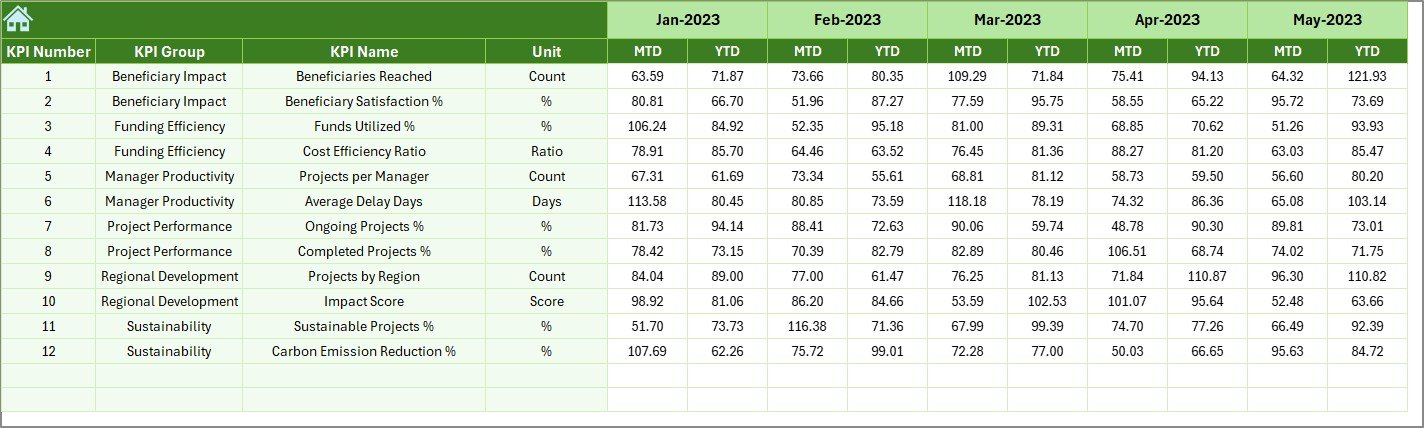
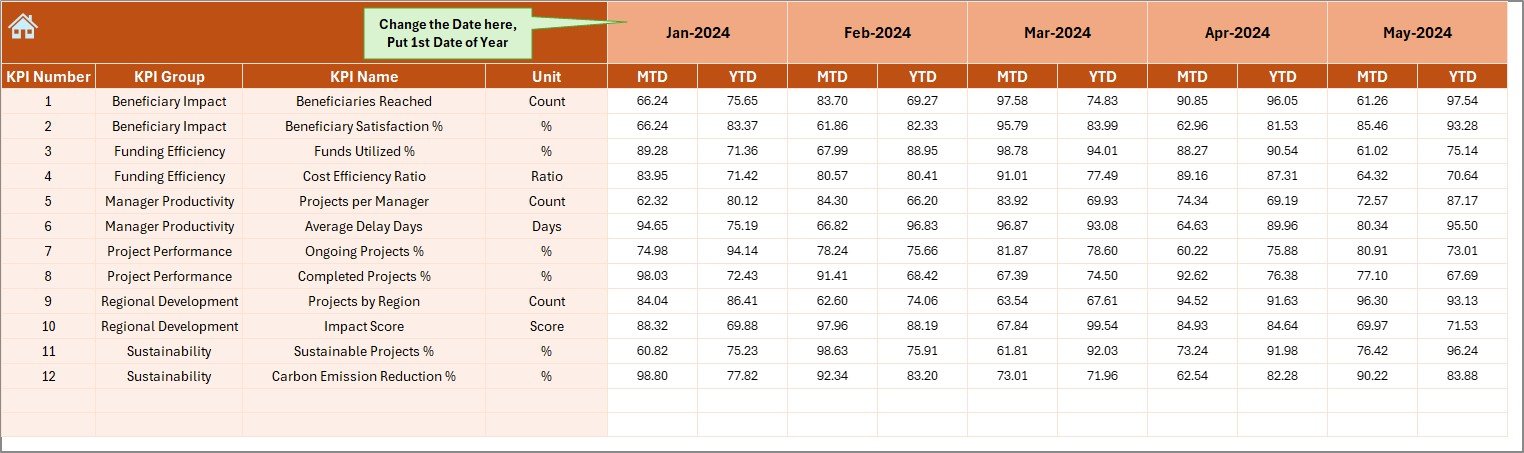
4️⃣ Actual Numbers Sheet – Enter real-time data for monthly performance tracking.
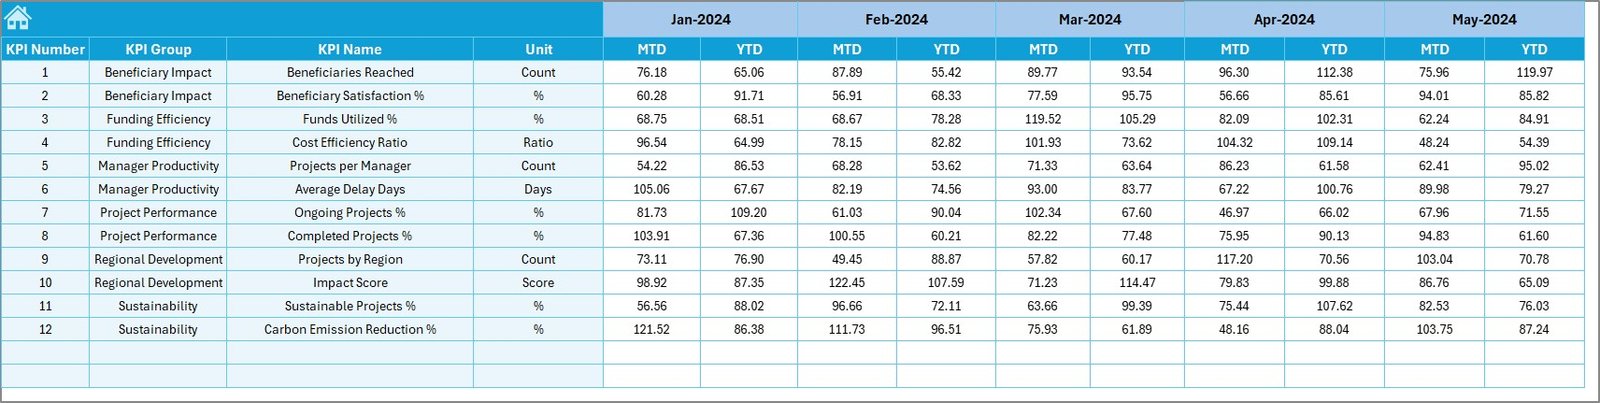
5️⃣ Target Sheet – Define monthly and annual targets to measure progress effectively.
6️⃣ Previous Year Sheet – Benchmark growth against last year’s achievements.
7️⃣ KPI Definition Sheet – Lists KPI names, formulas, units, and types (UTB/LTB) for transparency and consistency.
Everything is automated — just update your data, and the visuals refresh instantly!
⚙️ How to Use the International Development KPI Dashboard in Excel
🚀 Step 1: Open the Home Sheet and use navigation buttons to explore.
📅 Step 2: Select the reporting month to view dynamic KPI updates.
✍️ Step 3: Enter Actual Data in the “Actual Numbers” sheet.
🎯 Step 4: Set performance goals in the “Target Sheet.”
📊 Step 5: Add Previous Year values for benchmarking.
📘 Step 6: Update KPI Definitions to match your organization’s framework.
📈 Step 7: Analyze MTD and YTD trends using the main dashboard and KPI trend views.
No advanced Excel skills required — the dashboard is plug-and-play ready!
👥 Who Can Benefit from This International Development KPI Dashboard
🌐 NGOs & Donor Agencies: Track funding utilization, project outcomes, and beneficiary reach.
🏛️ Government Programs: Evaluate policy implementation across departments and regions.
🤝 International Aid Organizations: Monitor field performance and regional development results.
📚 Educational & Health Initiatives: Measure progress toward key social and economic targets.
💼 M&E Professionals: Streamline reporting, visualize trends, and make data-backed recommendations.
📈 Project Managers: Instantly see which KPIs are improving or declining.
Whether you’re managing programs in Africa, Asia, or Latin America — this Excel tool gives you the clarity and confidence to manage global development projects effectively.
Click here to read the Detailed Blog Post
Watch the step-by-step video tutorial:
Visit our YouTube Channel to learn step-by-step video tutorials
Compatibility and Requirements
- Works in Microsoft Excel desktop (Excel 2016 or later, or Microsoft 365).
- Month selection and KPI selection use dropdowns. Microsoft explains them in Create a drop-down list.
Frequently Asked Questions
Which sheets are included?
Seven sheets: Home, Dashboard, KPI Trend, Actual Numbers, Target, Previous Year and KPI Definition.
How do I update the dashboard?
Enter your monthly figures in the Actual Numbers sheet and your goals in the Target sheet. Then select the reporting month and the Dashboard sheet refreshes the MTD and YTD numbers.
Can I compare results with last year?
Yes. Add last year’s values to the Previous Year sheet. The Dashboard shows them next to Actual and Target, with arrows that mark the trend.
How do I look at one KPI in detail?
Open the KPI Trend sheet and choose the KPI from the dropdown. The chart and history for that KPI update. The KPI Definition sheet lists each KPI’s formula, unit and type (UTB or LTB).
Is there a Power BI or Google Sheets version?
Yes. See the International Development KPI Dashboard in Power BI and the International Development Dashboard in Google Sheets.
Related International Development Templates
- International Development KPI Dashboard in Power BI: the same KPI dashboard in Power BI
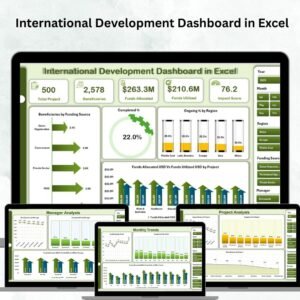
- International Development Dashboard in Excel: another Excel dashboard for development programs
- International Development Report in Excel: a report layout for program results
- International Development Dashboard in Google Sheets: a Google Sheets edition
- Nonprofit & NGO Operations Bundle: 7 templates for nonprofit teams in one download
Browse all Excel KPI dashboards.














Reviews
There are no reviews yet.