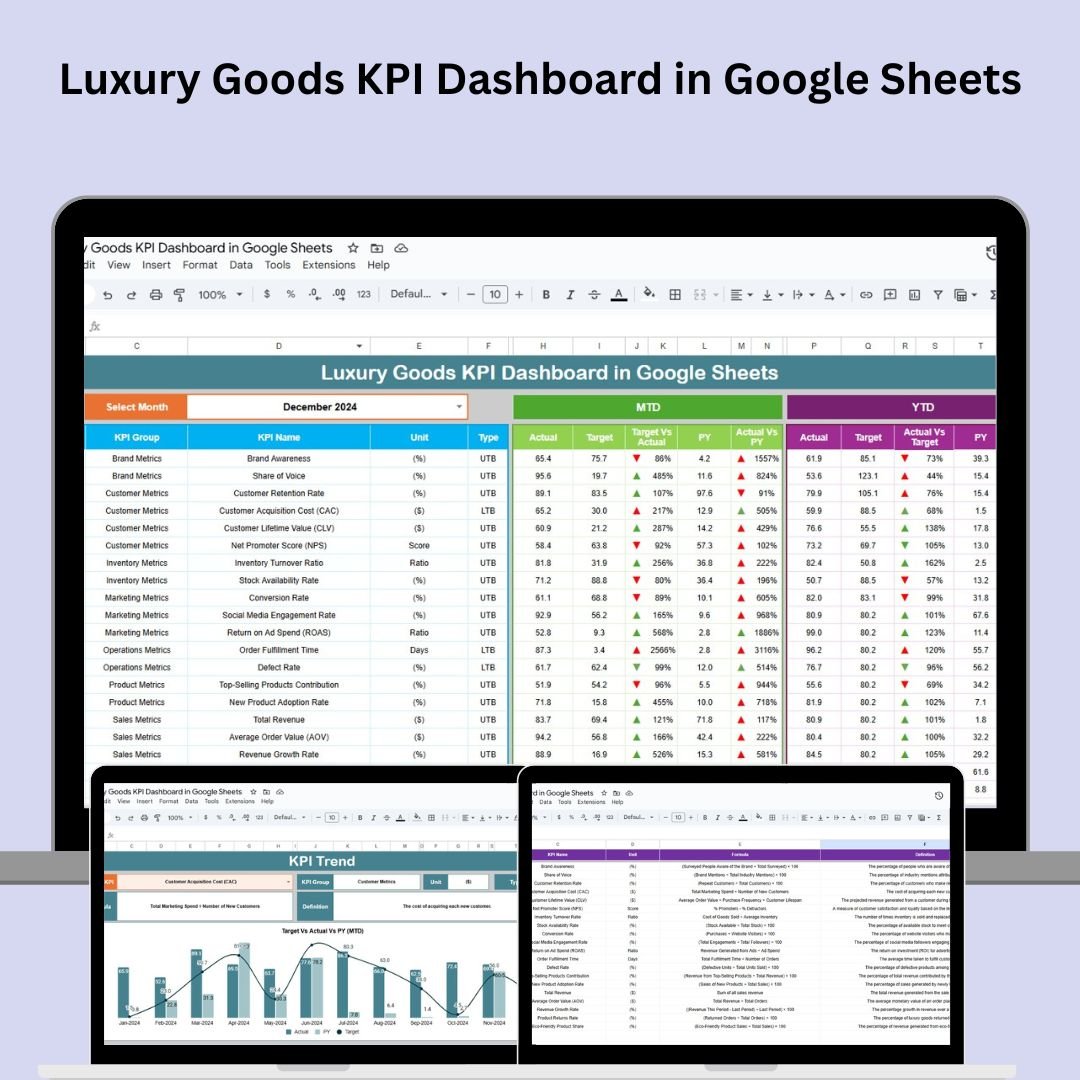
The Luxury Goods KPI Dashboard in Google Sheets is a powerful and easy-to-use tool designed to help luxury brands track and analyze essential business metrics. Whether you’re monitoring sales revenue, customer satisfaction, or inventory turnover, this dashboard gives you real-time insights into your business’s performance. By consolidating key performance indicators (KPIs) into one centralized view, this tool enables informed decision-making to ensure your brand stays competitive in a constantly evolving market.
🔑 Key Features of the Luxury Goods KPI Dashboard:
-
Real-Time Data Updates: Stay up-to-date with monthly and yearly performance data, allowing you to make immediate adjustments.
-
Target vs Actual Comparison: Easily compare your current performance to your targets and previous year’s data using clear visual indicators (up/down arrows).
-
Customizable Structure: Tailor the dashboard to your specific business needs, adjusting KPIs, targets, and input data.
-
Sales Performance Tracking: Monitor sales performance month-to-month, identifying trends and areas for improvement.
-
Customer Satisfaction Insights: Track customer satisfaction and retention rates to ensure you’re delivering a superior experience.
-
Market Share Analysis: Analyze your brand’s market share and performance across different regions, helping identify opportunities for global expansion.
What’s Inside the Luxury Goods KPI Dashboard 🏷️💼
Inside the Luxury Goods KPI Dashboard, you’ll find six essential worksheets designed to streamline your business performance monitoring:
-
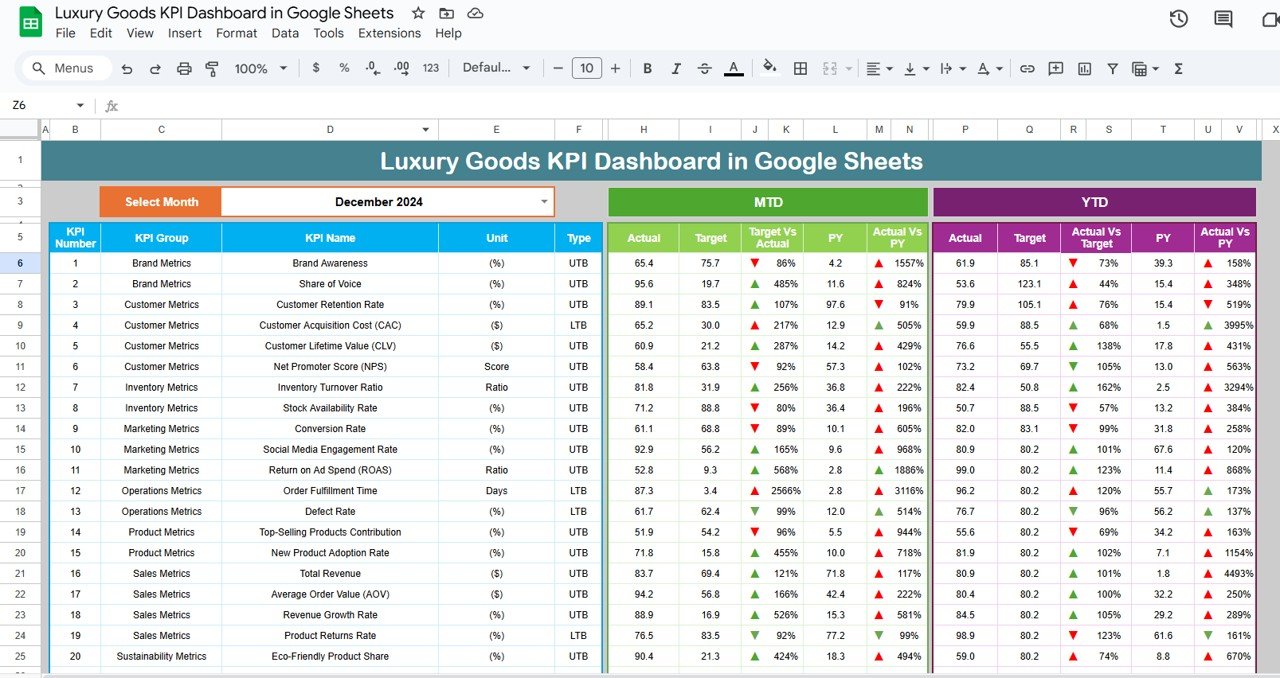
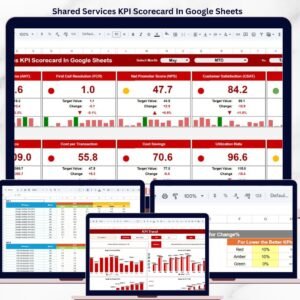
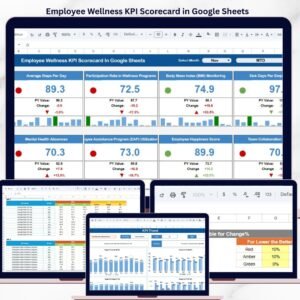
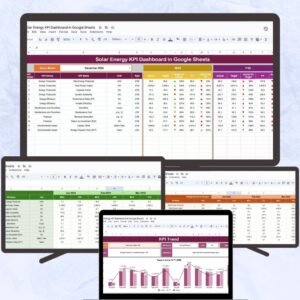
Dashboard Sheet: The central hub of the dashboard where all key performance metrics are displayed. It includes:
-
MTD (Month-to-Date) and YTD (Year-to-Date): View your actuals, targets, and comparisons with the previous year.
-
Target vs Actual Comparison: See how you’re performing against your goals and last year’s numbers with visual aids like up/down arrows.
-
-
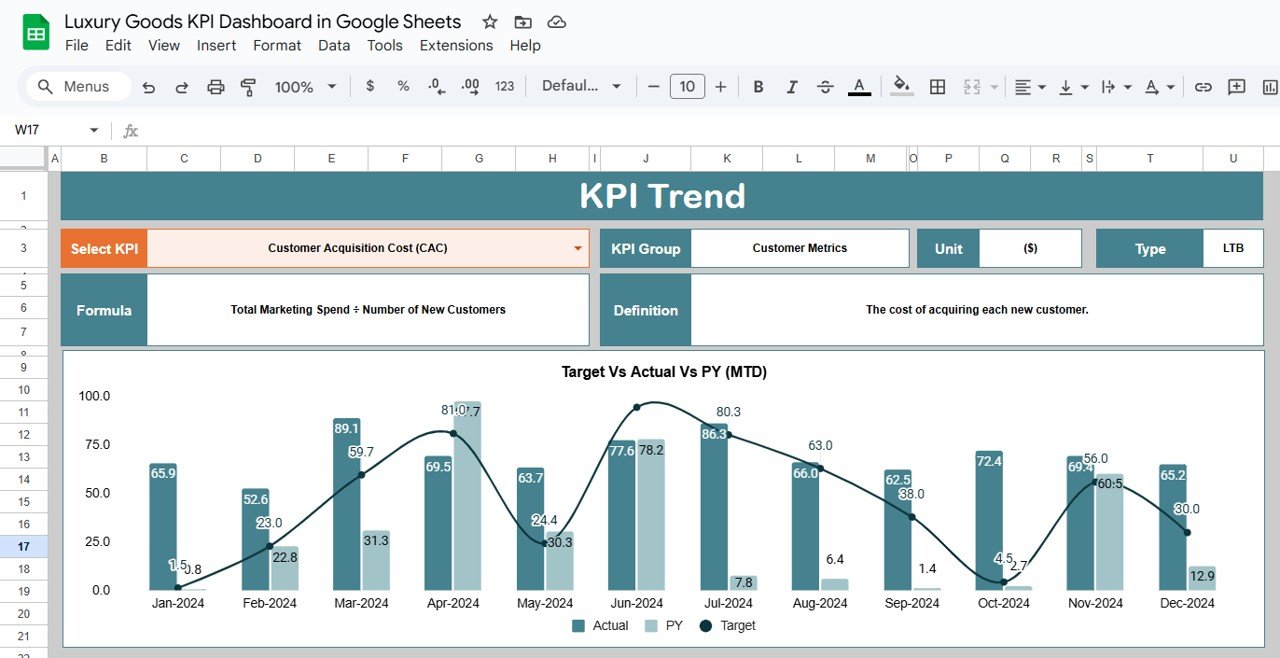
KPI Trend Sheet: Analyze trends for any selected KPI, including group, unit of measure, formula, and definitions, giving you clarity on how each metric impacts your business.
-
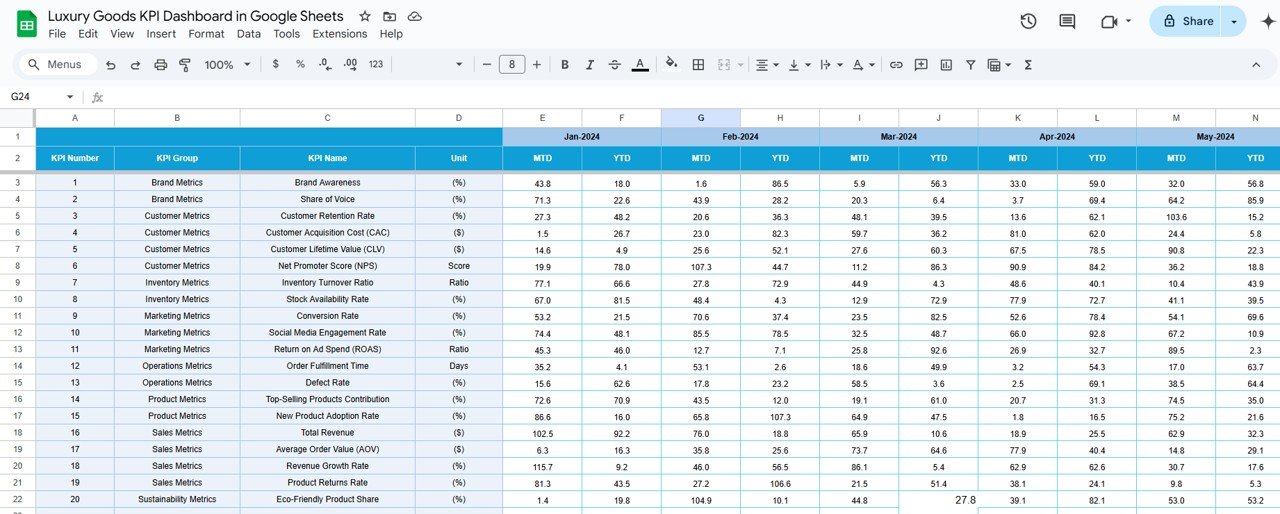
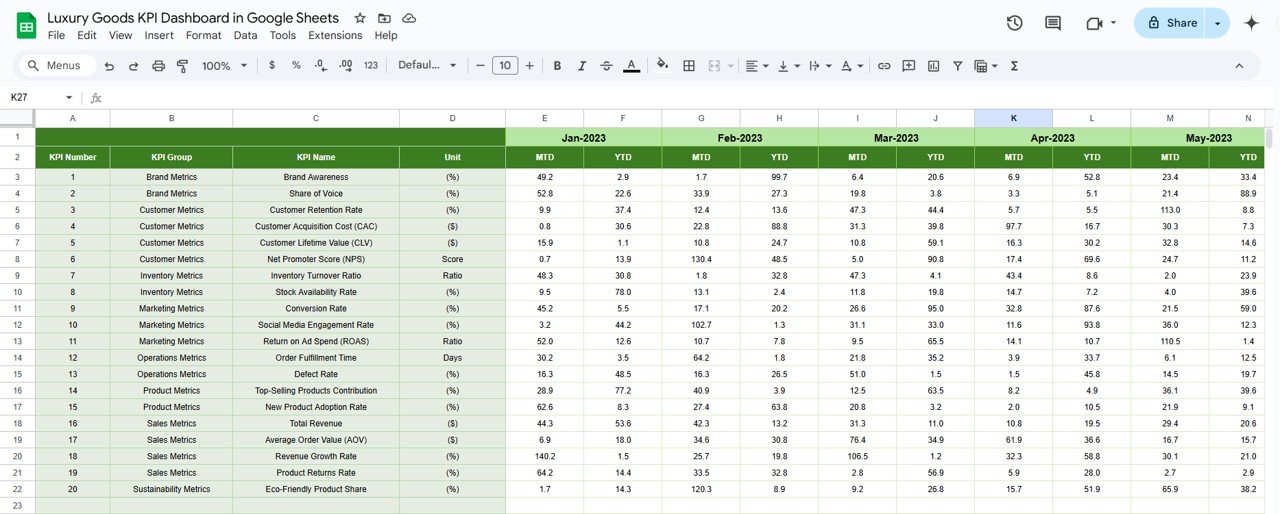
Actual Numbers Sheet: This is where you input actual data for MTD and YTD for the selected month. The dashboard automatically updates when new data is entered.
-
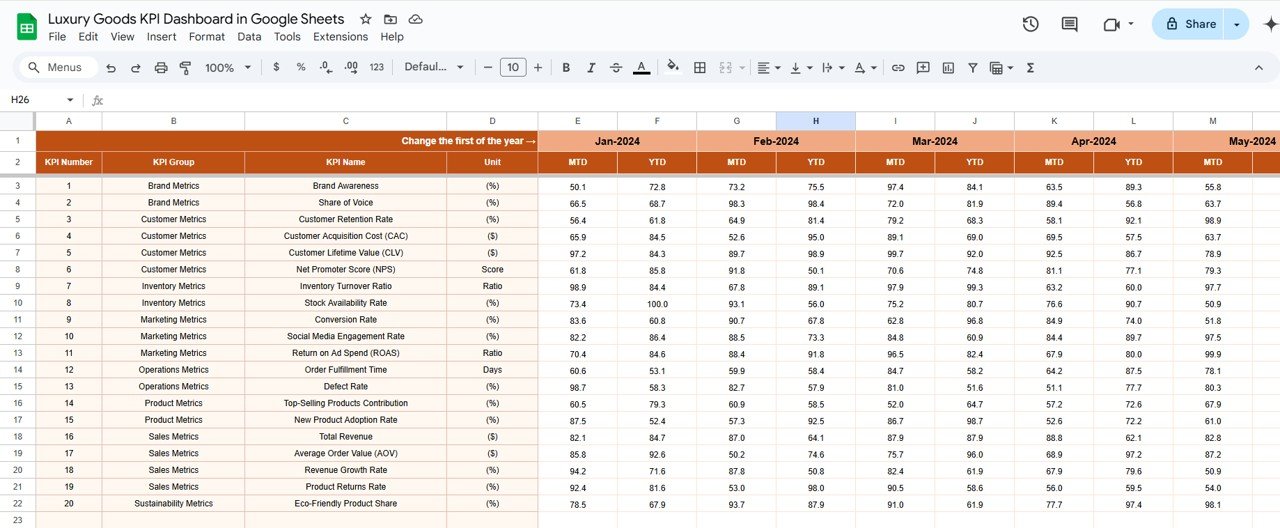
Target Sheet: Define your target numbers for each KPI, both for MTD and YTD, so you can track whether your business is meeting its goals.
-
Previous Year Numbers Sheet: Track performance comparisons with last year’s data for insightful year-over-year analysis.
-
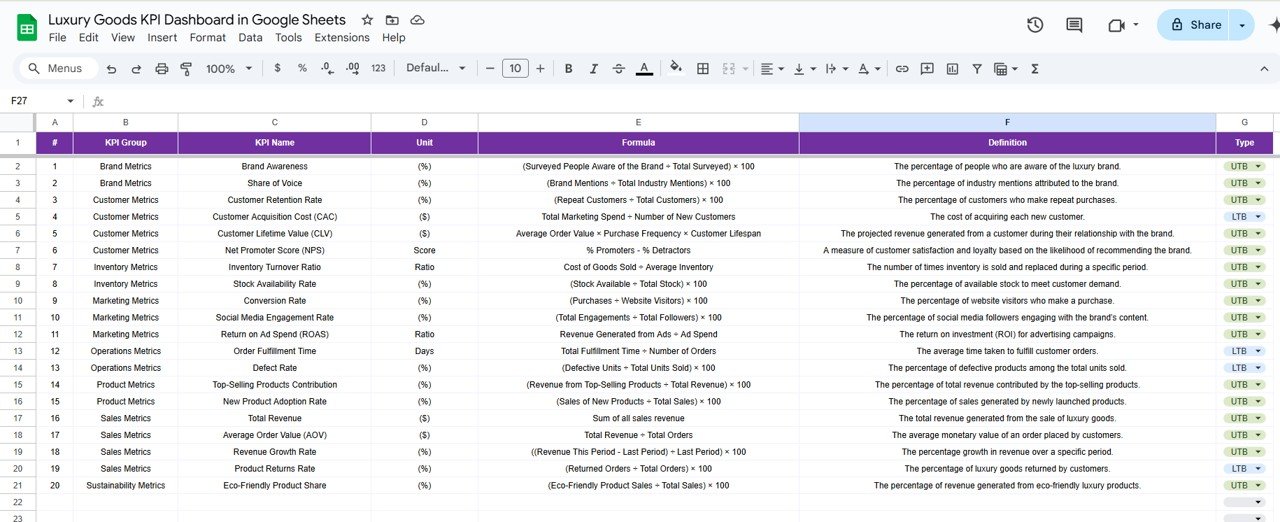
KPI Definition Sheet: This sheet outlines each KPI, its name, group, unit, formula, and definition, ensuring clarity and consistency across your team.
How to Use the Luxury Goods KPI Dashboard 📈🎯
To make the most of the Luxury Goods KPI Dashboard, follow these steps:
-
Download the Template: Open the dashboard in Google Sheets and start entering your data.
-
Update Data Regularly: Input your MTD and YTD data to keep the dashboard up to date.
-
Set Targets: Enter your sales, customer satisfaction, and other targets in the Target Sheet to monitor performance.
-
Track Performance: Use the Dashboard Sheet to monitor KPIs and track your performance against set targets.
-
Analyze Trends: Leverage the KPI Trend Sheet to assess performance over time and spot areas for improvement.
Who Can Benefit from This Luxury Goods KPI Dashboard? 🏢🌍
This dashboard is perfect for businesses in the luxury goods industry looking to track their performance and stay competitive. Whether you’re a small luxury brand or a multinational corporation, this tool helps ensure you’re always on top of your KPIs.
-
Luxury Brand Managers: Track overall business performance, including sales revenue, customer retention, and market share.
-
Marketing Teams: Measure the effectiveness of your marketing campaigns by tracking key customer satisfaction and retention metrics.
-
Sales Teams: Monitor sales revenue and adjust strategies to meet targets.
-
Executive Teams: Use the dashboard to make data-driven decisions and plan for global expansion.
Advantages of Using the Luxury Goods KPI Dashboard 💎📉
-
Improved Data Visibility: All critical metrics are in one place, making it easy to track performance and make informed decisions.
-
Real-Time Performance Monitoring: Update the dashboard regularly for real-time insights, helping you act quickly on performance gaps.
-
Enhanced Strategic Planning: With clear visibility into key metrics, you can plan for growth, identify weaknesses, and make necessary adjustments.
-
Better Customer Experience: Monitor customer satisfaction and retention KPIs to ensure you are providing a top-tier experience.
-
Increased Profitability: By optimizing sales, inventory, and customer satisfaction metrics, you can improve the bottom line and enhance business performance.


Reviews
There are no reviews yet.