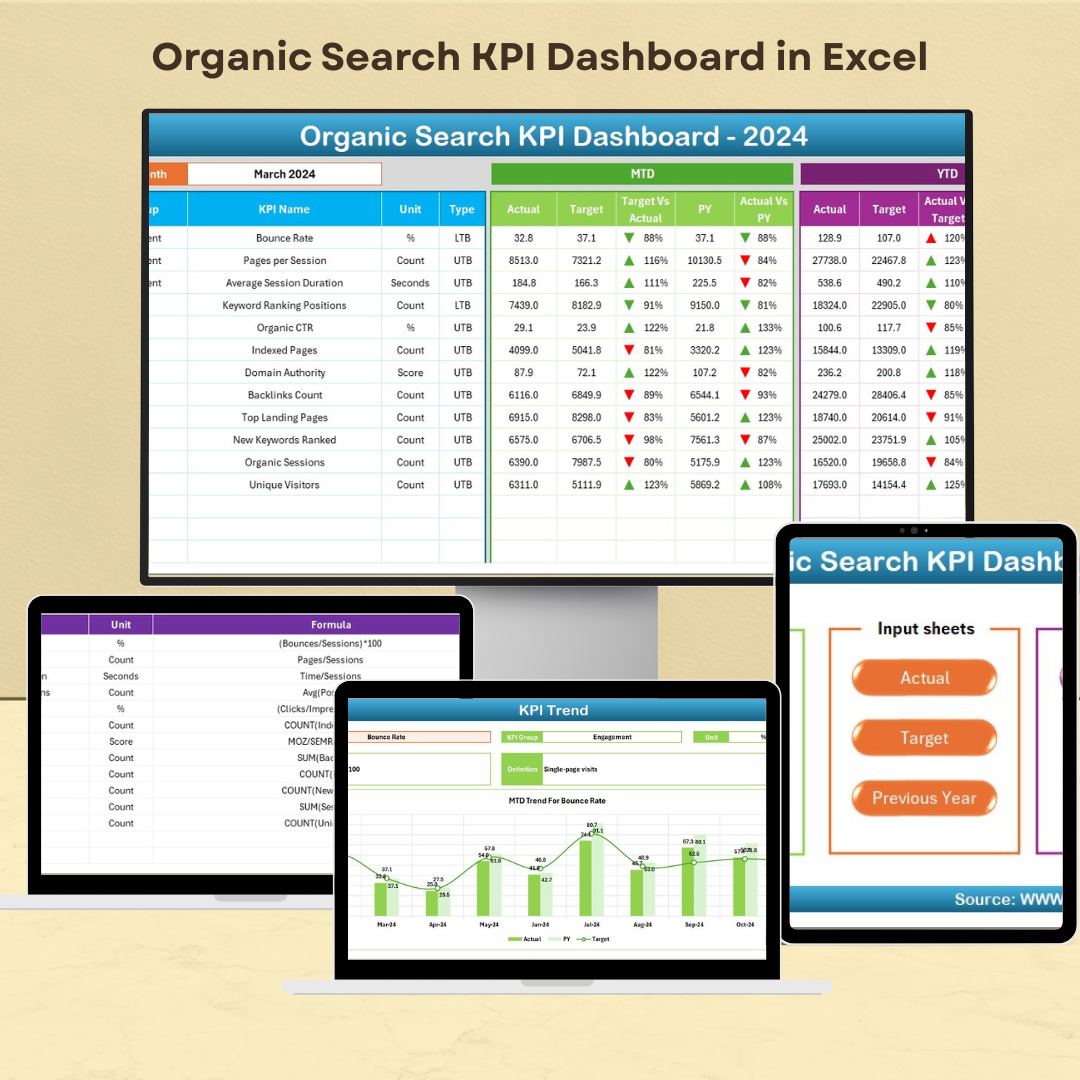
The Data Warehouse KPI Dashboard in Excel is an essential tool for organizations looking to track and optimize the performance of their data warehouse operations. This dashboard helps monitor key performance indicators (KPIs) such as data load times, query performance, storage utilization, and data quality metrics. It provides a centralized view of your data infrastructure’s performance, allowing you to identify bottlenecks, optimize processes, and ensure smooth data management.
By using this Excel-based dashboard, data managers and IT teams can make informed decisions that improve data processing, enhance system performance, and maximize storage utilization.
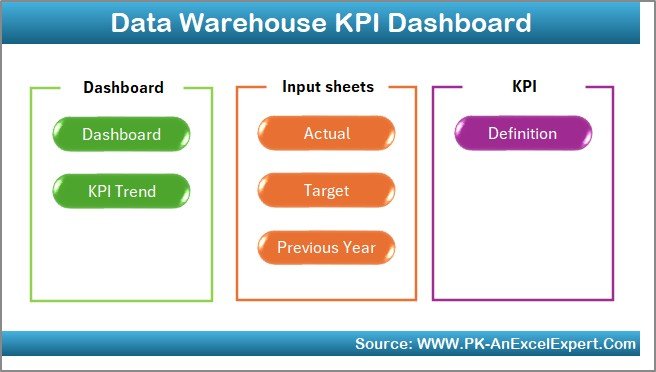
Key Features of the Data Warehouse KPI Dashboard in Excel
📊 Comprehensive KPI Tracking
-
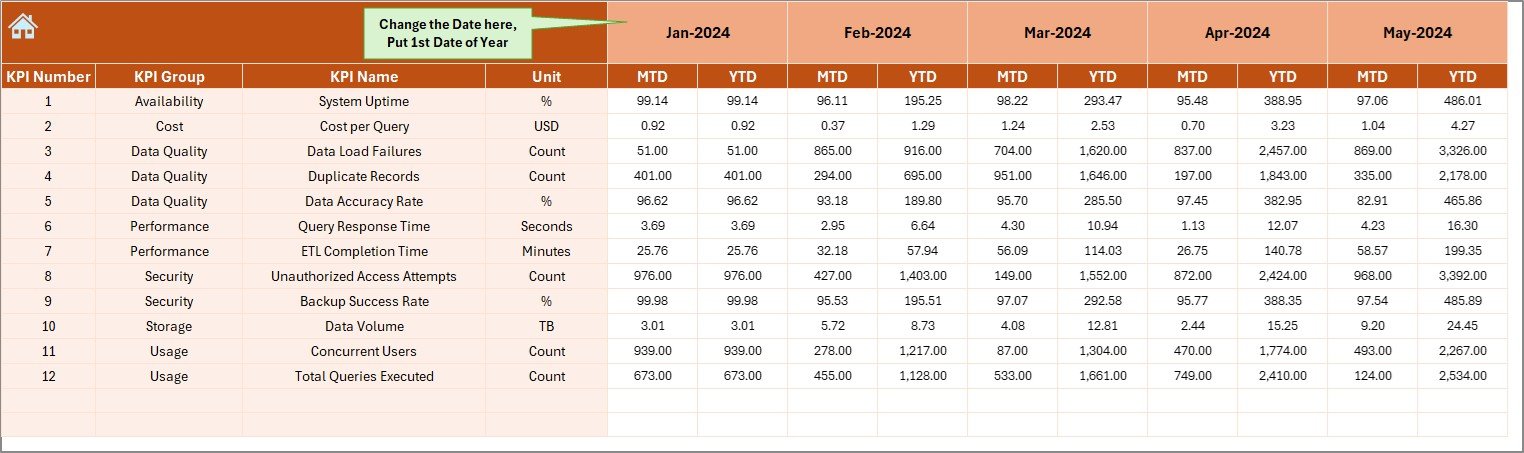
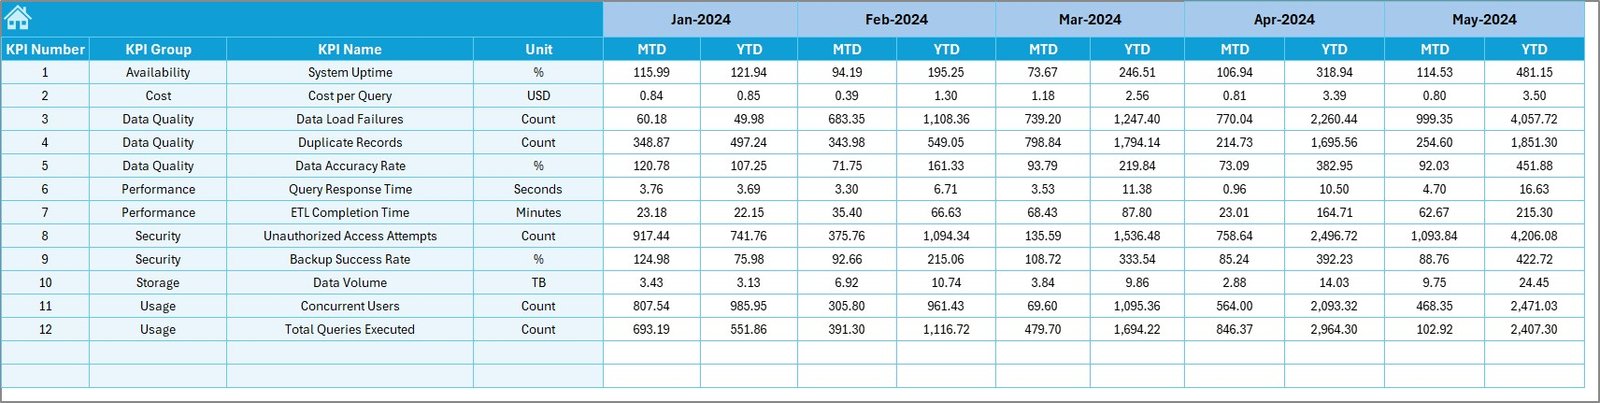
Track Key Metrics: Monitor essential KPIs like data load times, query performance, storage utilization, and data quality in one place.
-
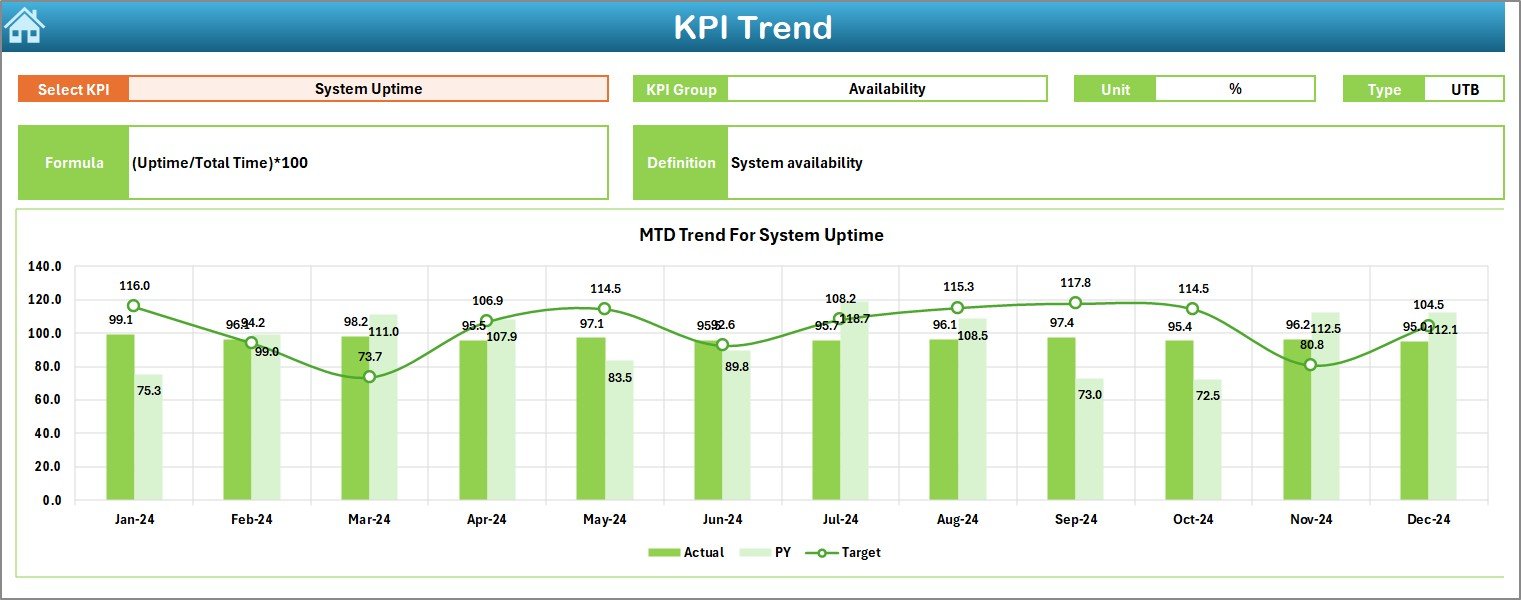
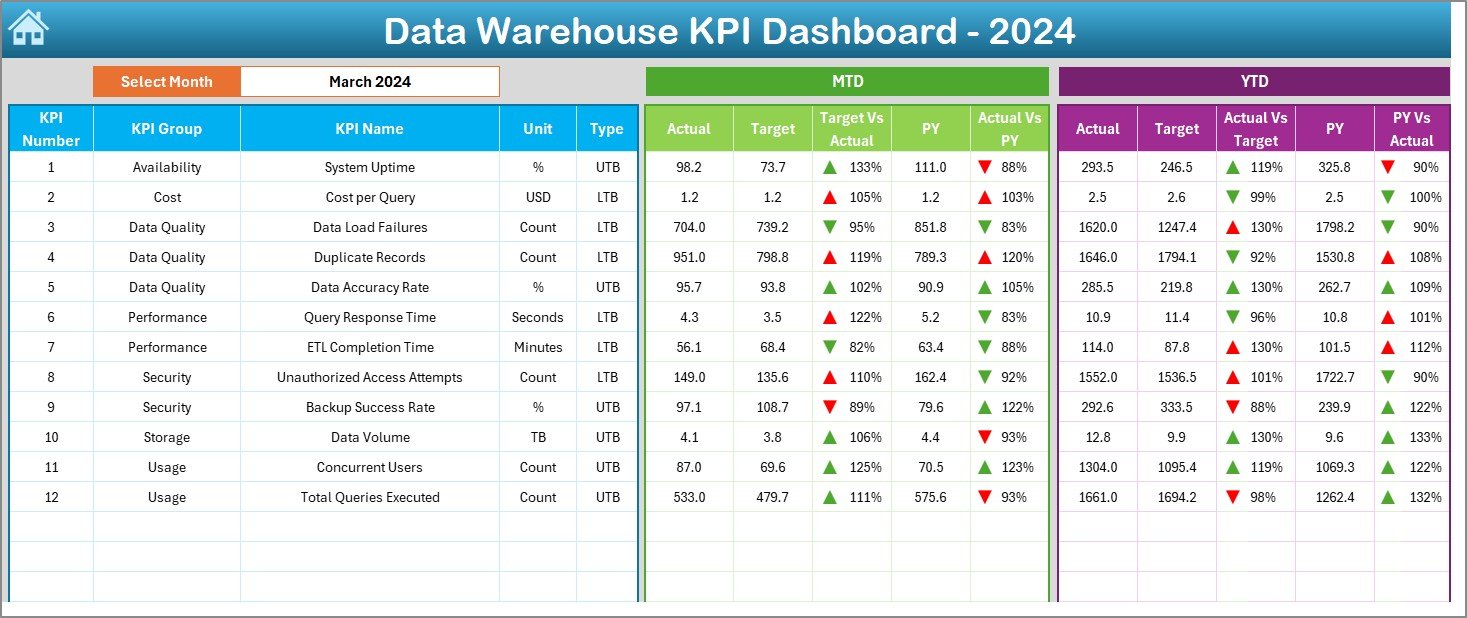
Real-Time Data Visualization: Visualize trends and performance over time with dynamic charts, graphs, and tables that highlight critical data points.
📈 Customizable Metrics
-
Tailor to Your Needs: Customize the dashboard to track metrics specific to your organization’s data warehouse operations.
-
Data Integration: Easily integrate data from your data warehouse systems to keep the dashboard updated with real-time performance metrics.
🔧 User-Friendly Interface
-
Easy Setup: Designed to be intuitive, even for users with limited Excel experience, making it accessible to all team members.
-
Flexible Layout: Adjust the dashboard layout to fit your reporting needs, with the ability to add or remove KPIs as necessary.
📅 Performance Monitoring & Reporting
-
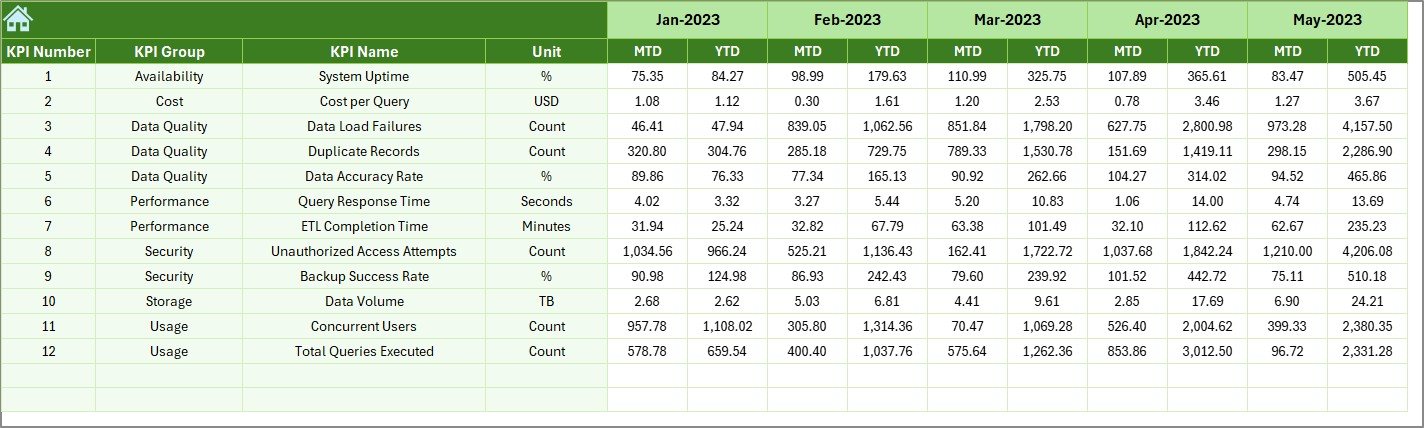
MTD & YTD Tracking: Track Month-to-Date (MTD) and Year-to-Date (YTD) performance to compare current results with historical data.
-
Target vs. Actual: Compare actual performance with predefined targets to assess whether your data warehouse operations are meeting expectations.
Benefits of Using the Data Warehouse KPI Dashboard in Excel
✅ Informed Decision-Making
Real-time access to performance data helps make quick, data-driven decisions to enhance data warehouse operations.
✅ Improved Performance
Easily identify slow processes or underperforming areas, such as data load issues or query delays, and take corrective action.
✅ Increased Accountability
With transparent tracking of KPIs, everyone on the team is accountable for ensuring optimal data warehouse performance.
✅ Streamlined Reporting
The automated tracking and visualization features simplify the reporting process, reducing time spent on manual data entry and increasing efficiency.
Getting Started with Your Data Warehouse KPI Dashboard in Excel
-
Download the Template: Get started by downloading the Data Warehouse KPI Dashboard template and customize it for your operations.
-
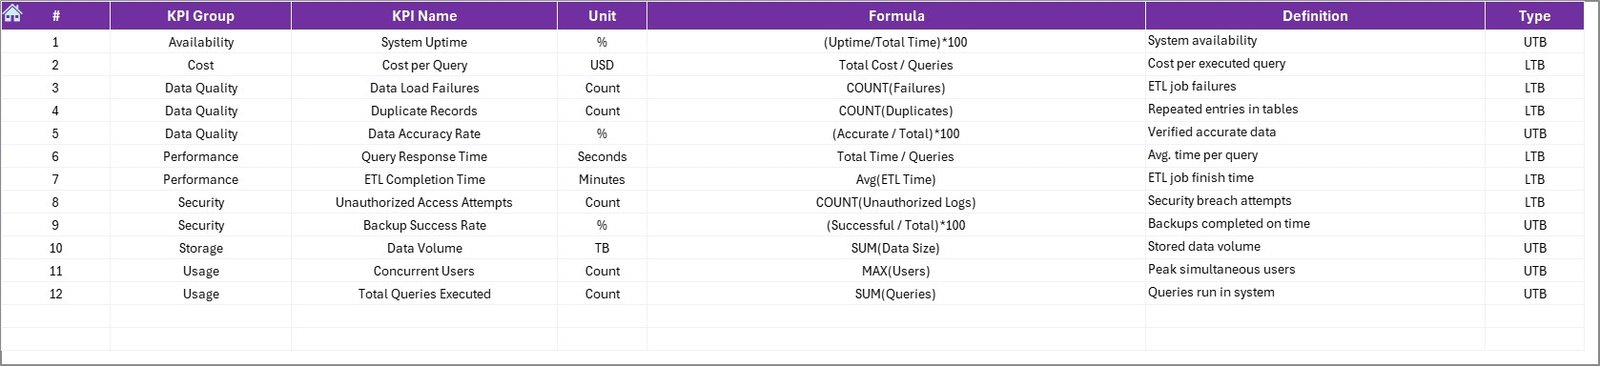
Define Your KPIs: Identify the key performance indicators that align with your data warehouse goals, such as data load times, query performance, and storage utilization.
-
Integrate Data: Import data from your data warehouse systems to keep the dashboard updated with real-time information.
-
Monitor & Analyze: Use the dashboard to track your data warehouse performance and analyze trends to improve efficiency.
-
Optimize Data Management: Based on the data, make informed decisions to optimize processes and enhance data storage utilization.
By using the Data Warehouse KPI Dashboard in Excel, your team can effectively track performance, make data-driven decisions, and optimize data warehouse operations.
Click here to read the Detailed blog post
Data Warehouse KPI Dashboard in Excel
Visit our YouTube channel to learn step-by-step video tutorials
YouTube.com/@PKAnExcelExpert


Reviews
There are no reviews yet.