



The Satellite Imaging KPI Dashboard in Excel is an advanced and powerful tool designed for professionals in the space industry, remote sensing, and geospatial analytics. This Excel-based dashboard provides key insights into satellite imaging performance by tracking critical KPIs such as image resolution, processing time, area coverage, and satellite health. Whether you’re analyzing satellite data for agricultural monitoring, environmental research, or disaster management, this dashboard provides real-time tracking and analysis to optimize operations.
This user-friendly dashboard helps satellite imaging teams and organizations monitor their satellite’s performance, ensuring the timely capture and processing of high-quality images. It enables users to visualize trends, make data-driven decisions, and improve satellite image processing for various applications, from mapping to climate change analysis.
Key Features of the Satellite Imaging KPI Dashboard in Excel
📊 Satellite Performance Monitoring
Track satellite health, imaging capacity, and performance metrics. Get insights into factors affecting the satellite’s image capturing capabilities, including any system malfunctions or downtime.
📈 Resolution & Image Quality Tracking
Monitor the resolution of captured images to ensure they meet required standards for accuracy and detail. This KPI is essential for applications such as mapping, surveillance, and climate studies.
⏱ Processing Time Analysis
Track the time taken from image capture to processing. Use this metric to improve workflows, reduce delays, and optimize satellite imaging operations.
🌍 Area Coverage & Imaging Efficiency
Monitor the area covered by each satellite pass and assess the efficiency of image coverage. This helps in understanding the satellite’s reach and identifying areas that may require additional imaging efforts.
🔄 Customizable KPIs & Metrics
Tailor the dashboard to meet specific project or organization needs. Add additional KPIs, such as image quality, error rates, and more, to match the unique requirements of your satellite imaging operations.
📅 Time-Based Performance Analysis
Evaluate satellite performance and KPIs over various time periods—daily, weekly, monthly, or annually. Use time-based analysis to track improvements, identify trends, and measure the impact of operational changes.
Why You’ll Love the Satellite Imaging KPI Dashboard in Excel

✅ Monitor Satellite Health & Performance
Track satellite performance and health to ensure continuous and reliable image capture. Identify issues before they impact operations.
✅ Optimize Image Processing & Resolution
Monitor image quality and resolution to ensure your images meet the necessary standards. Optimize processing times to accelerate data availability.
✅ Increase Operational Efficiency
Track area coverage, processing times, and satellite health to streamline satellite imaging operations and maximize resource usage.
✅ Make Data-Driven Decisions
Use the insights from the dashboard to make informed decisions regarding resource allocation, operational improvements, and satellite performance optimization.
✅ Customizable for Any Satellite Imaging Project
Whether you’re working with a single satellite or managing a fleet, this dashboard can be customized to track the KPIs that matter most for your project.
What’s Inside the Satellite Imaging KPI Dashboard in Excel?
Satellite Performance Monitoring: Track satellite health and imaging capabilities.
Resolution & Image Quality Tracking: Monitor image resolution and ensure accuracy.
Processing Time Monitoring: Track and optimize image processing times.
Area Coverage & Imaging Efficiency: Assess the efficiency of satellite coverage and reach.
Customizable KPIs: Tailor the dashboard for your specific satellite imaging needs.
Time-Based Analysis: Use time-based data to track performance trends and improvements.
How to Use the Satellite Imaging KPI Dashboard in Excel
1️⃣ Download the Template: Access the Satellite Imaging KPI Dashboard in Excel instantly.
2️⃣ Input Satellite Data: Enter data such as satellite health, resolution, processing times, and area coverage.
3️⃣ Track KPIs & Performance: Monitor key metrics such as image resolution, processing times, and satellite health in real-time.
4️⃣ Analyze Trends & Performance: Use time-based analysis to evaluate performance and identify areas for optimization.
5️⃣ Optimize Satellite Imaging Operations: Use the insights from the dashboard to make data-driven decisions that improve satellite performance and operational efficiency.
Who Can Benefit from the Satellite Imaging KPI Dashboard in Excel?
🔹 Satellite Imaging Companies
🔹 Remote Sensing Professionals
🔹 Geospatial Analysts & Scientists
🔹 Climate & Environmental Researchers
🔹 Disaster Management Teams
🔹 Space & Aerospace Organizations
🔹 Government Agencies & NGOs
🔹 Data Scientists & Analysts in Satellite Research
Ensure high-quality satellite imaging with the Satellite Imaging KPI Dashboard in Excel. Track performance, optimize operations, and make data-driven decisions for more efficient satellite image processing.
Click here to read the Detailed blog post
Visit our YouTube channel to learn step-by-step video tutorials
Youtube.com/@PKAnExcelExpert
Watch the step-by-step video Demo:
Compatibility and Requirements
- Works in Microsoft Excel desktop (Excel 2016 or later, or Microsoft 365).
- You enter your satellite data in Excel. Microsoft explains how to build charts in Create a chart from start to finish.
Frequently Asked Questions
Which KPIs does the dashboard track?
It tracks satellite health and performance, image resolution and quality, processing time from capture to delivery, and area coverage with imaging efficiency.
What data do I need to enter?
Enter satellite health, resolution, processing times and area coverage. The dashboard then shows these KPIs and their trends.
Can I look at performance over different time periods?
Yes. The time-based analysis lets you review performance daily, weekly, monthly or annually, so you can spot trends and see the effect of operational changes.
Can I add my own KPIs?
Yes. The KPIs are customizable, so you can add metrics such as error rates to match your satellite imaging operations.
Can I use it for more than one satellite?
Yes. The description says it can be customized for a single satellite or a fleet, depending on the KPIs you want to track.
Related Dashboard Templates
- Satellite Communication KPI Dashboard in Excel: a KPI dashboard for satellite communication
- Satellite Communication KPI Dashboard in Google Sheets: the same topic in Google Sheets
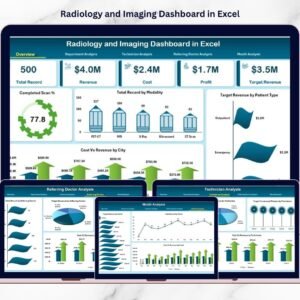
- Radiology & Imaging KPI Dashboard in Excel: an imaging KPI dashboard for healthcare
- Radiology & Imaging KPI Dashboard in Power BI: the Power BI edition of the imaging dashboard
- KPI Dashboard Library (Excel): 15 Excel KPI dashboards in one download
Browse all Excel KPI dashboards.




















Reviews
There are no reviews yet.