

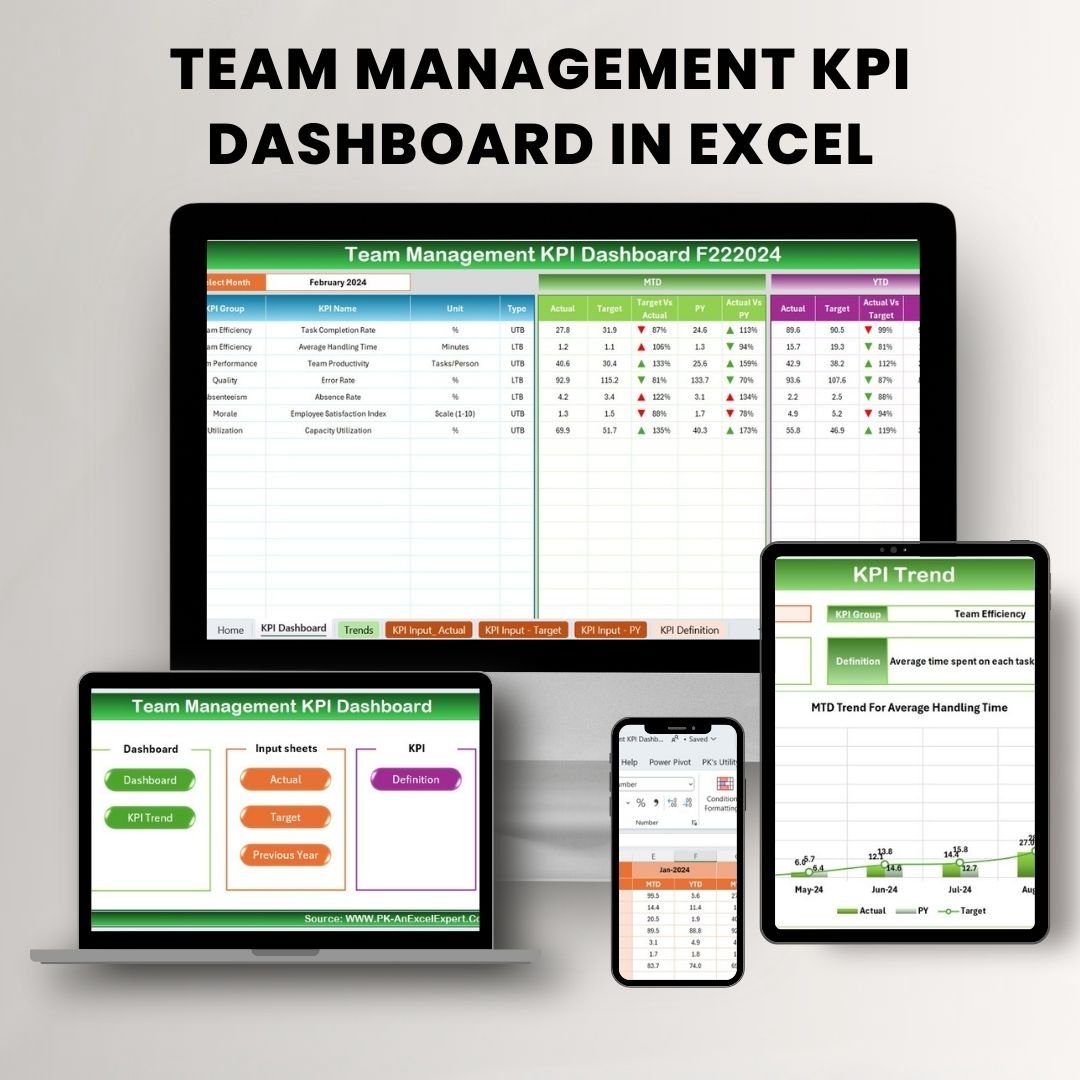
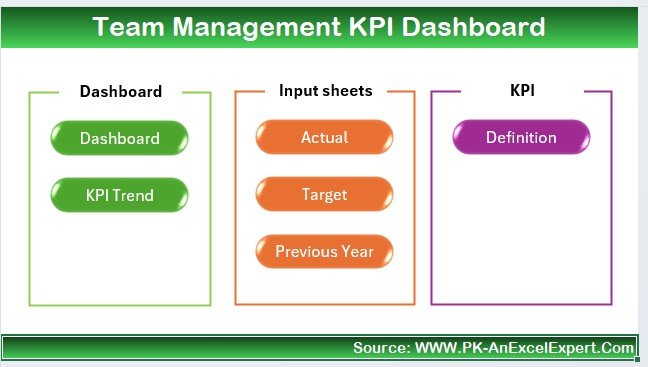
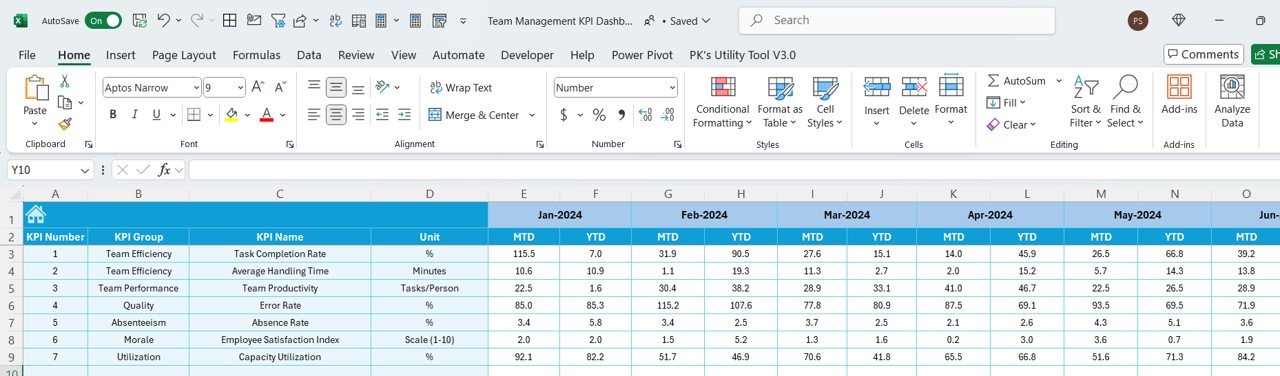
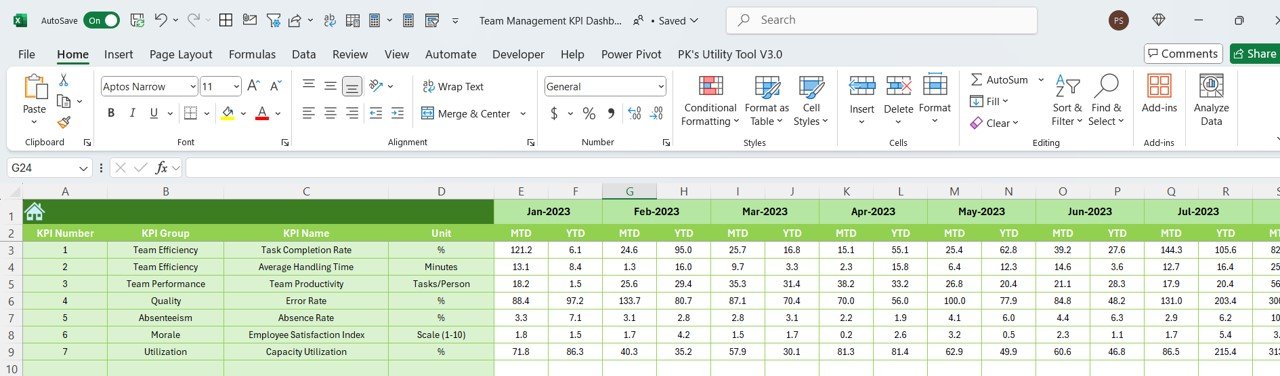
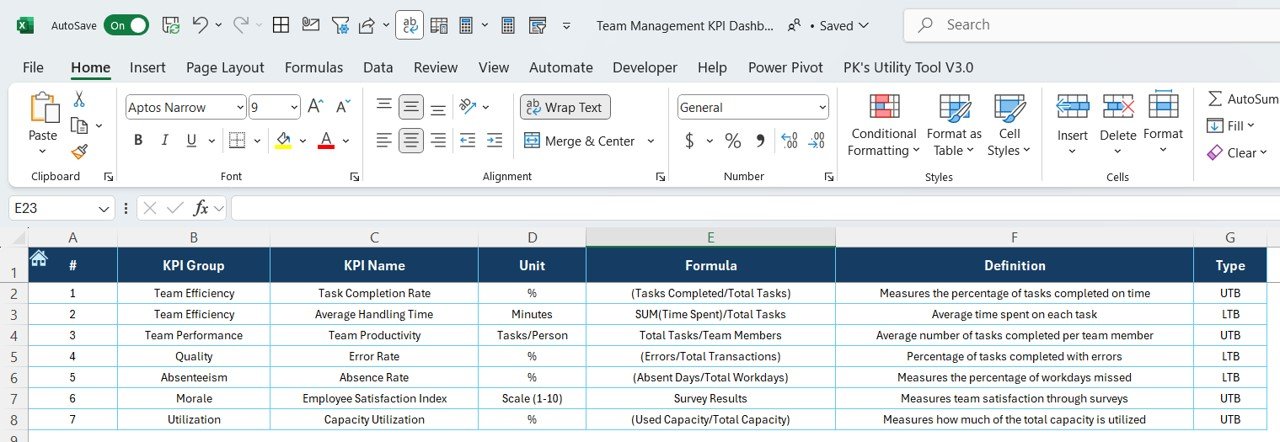

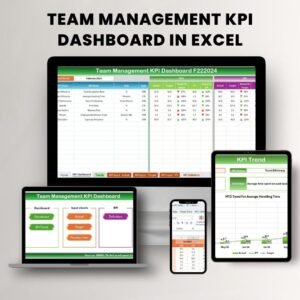
The Team Management KPI Dashboard in Excel is an invaluable tool designed to help team leaders, managers, and HR professionals track and manage key performance indicators (KPIs) for team performance. This Excel-based dashboard provides a detailed and clear view of the metrics that matter most, including productivity, employee engagement, project completion, and team member progress.
Whether you’re managing a small team or a large department, this dashboard helps you monitor individual and team performance, identify areas for improvement, and align team goals with business objectives. By tracking KPIs in real-time, you can ensure that your team stays on track and meets both short-term and long-term goals effectively.
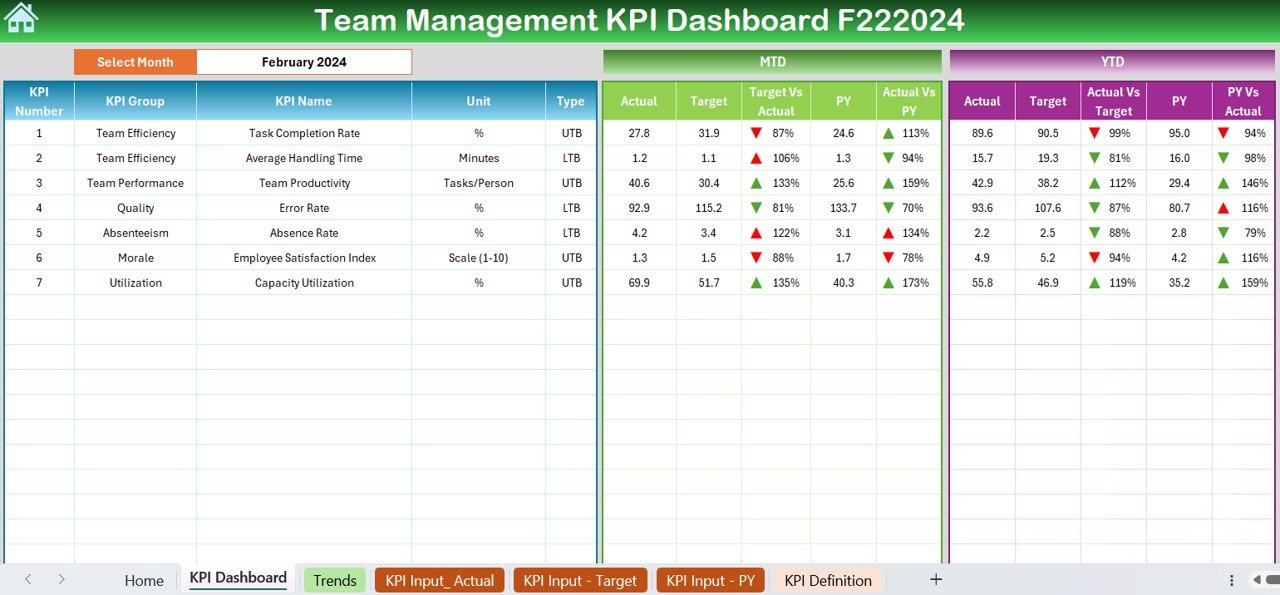
Key Features of the Team Management KPI Dashboard in Excel
📊 Employee Performance Tracking
Track key metrics like task completion rate, project milestones, and individual performance. Monitor how each team member is contributing toward team objectives and identify areas for improvement.
📅 Project Tracking & Milestones
Keep track of ongoing projects, deadlines, and milestones. The dashboard enables you to view the progress of various projects and ensure they are completed on time, improving team productivity.
📈 Team Collaboration & Engagement
Measure team collaboration and engagement levels through KPIs such as meeting attendance, feedback scores, and participation in team activities. Understand team dynamics and take steps to improve collaboration.
🔄 Real-Time Data & Updates
Receive real-time updates on team performance. With this feature, you can quickly assess the current status of various KPIs and make immediate adjustments to keep your team on track.
⚙️ Customizable KPIs & Metrics
The dashboard is customizable, allowing you to add or modify KPIs that are most relevant to your team’s goals. Track the metrics that best align with your specific business needs.
📉 Data Analysis & Reporting
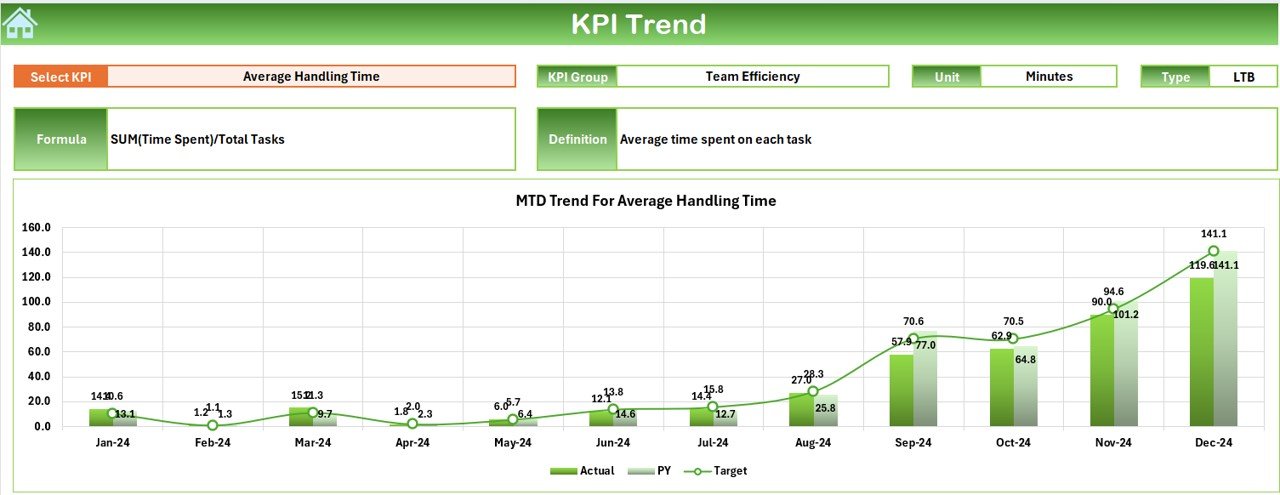
Generate insightful reports and analyze data to identify patterns and trends. The dashboard helps you evaluate team progress over time and make data-driven decisions.
Why You’ll Love the Team Management KPI Dashboard in Excel
✅ Centralized Team Performance Data
Track all essential KPIs in one place. From individual performance to team collaboration, monitor everything in real time.
✅ Improve Productivity & Efficiency
Monitor project completion rates, individual task progress, and team milestones to ensure that goals are met on time and productivity is maximized.
✅ Enhance Team Collaboration
Track team engagement and collaboration metrics to ensure your team is working well together. Take proactive steps to improve morale and collaboration.
✅ Customize to Your Needs
Tailor the dashboard to reflect the specific KPIs that matter most for your team. Whether it’s task completion, employee engagement, or project deadlines, you can adjust the dashboard as needed.
✅ Data-Driven Decision Making
Make informed decisions based on accurate, real-time data. Use the dashboard to analyze trends, track progress, and optimize team performance.
What’s Inside the Team Management KPI Dashboard in Excel?
Employee Performance Tracking: Monitor key metrics such as task completion, individual contributions, and employee progress.
Project Tracking & Milestones: Track project progress, deadlines, and milestones for timely completion.
Team Collaboration & Engagement: Measure team collaboration, participation, and engagement levels.
Real-Time Data & Updates: Get up-to-date information on team performance and make timely adjustments.
Customizable KPIs: Add or modify KPIs based on your team’s specific needs and objectives.
Reporting & Analytics: Generate reports and analyze team performance data to identify areas for improvement.
How to Use the Team Management KPI Dashboard in Excel
1️⃣ Download the Template: Access the Team Management KPI Dashboard in Excel instantly.
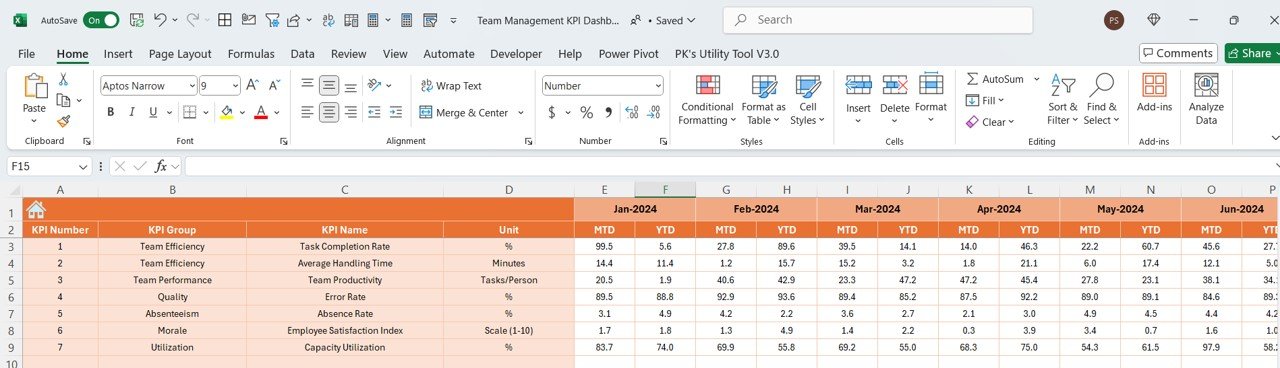
2️⃣ Input Team Data: Enter relevant team and project data, including individual task progress, project deadlines, and team performance metrics.
3️⃣ Track KPIs: Monitor key metrics like productivity, project completion, and engagement levels.
4️⃣ Analyze Data & Trends: Use the dashboard to analyze performance trends and make improvements where necessary.
5️⃣ Optimize Team Performance: Use the insights gathered to make data-driven decisions and enhance team collaboration and productivity.
Who Can Benefit from the Team Management KPI Dashboard in Excel?
🔹 Team Leaders & Managers
🔹 HR & Employee Engagement Professionals
🔹 Project Managers & Coordinators
🔹 Business Owners & Executives
🔹 Large Teams & Departments
🔹 Small & Medium Enterprises (SMBs)
The Team Management KPI Dashboard in Excel will help you stay organized and efficient by tracking the metrics that matter most for your team’s success. Monitor performance, collaboration, and project progress, all in one easy-to-use tool.
Click here to read the Detailed blog post
Visit our YouTube channel to learn step-by-step video tutorials
Youtube.com/@PKAnExcelExpert
Compatibility and Requirements
- Works in Microsoft Excel desktop (Excel 2016 or later, or Microsoft 365).
- Charts and KPI views are built into the workbook, so there is nothing else to install.
- New to Excel charts? Microsoft explains the basics in Create a chart from start to finish.
Frequently Asked Questions
What does the Team Management KPI Dashboard track?
It tracks task completion, project milestones, deadlines, meeting attendance, feedback scores and team engagement, all in one Excel workbook.
Can I add my own KPIs?
Yes. The KPIs and metrics are customizable, so you can add or change them to match your team goals.
How do I start using it?
Download the file, enter your team and project data, then review the KPIs and trends the dashboard shows.
Is there a Google Sheets or Power BI version?
Yes. The same dashboard is available for Google Sheets and Power BI.
Related Team Management Templates
- Team Management KPI Dashboard in Google Sheets: the same KPIs in a shared online sheet
- Team Management KPI Dashboard in Power BI: the Power BI edition for report users
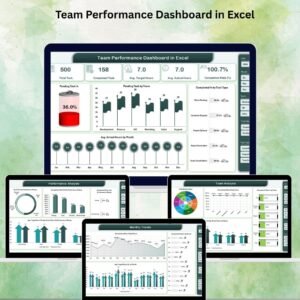
- Team Performance Dashboard in Excel: a fuller dashboard for team results
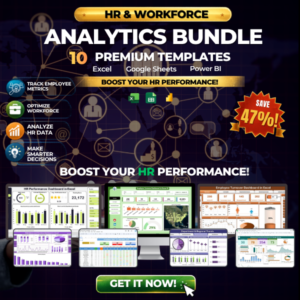
- HR & Workforce Analytics Bundle: 10 HR and workforce templates in one download
Browse all Excel KPI dashboards or the Excel project management templates.
























Reviews
There are no reviews yet.