



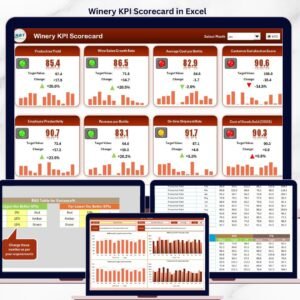
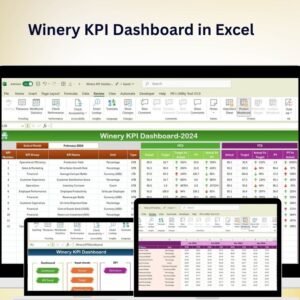
The Winery KPI Dashboard in Excel is a powerful tool designed specifically for winery owners, managers, and analysts in the wine production industry. This Excel-based dashboard allows you to track key performance indicators (KPIs) related to wine production, sales, inventory management, and customer satisfaction. With real-time tracking and customizable features, this dashboard helps you optimize operations, enhance production efficiency, and increase profitability in your winery business.
Whether you’re managing production, monitoring sales, or analyzing customer feedback, this KPI dashboard offers comprehensive insights to help you grow and improve your winery business.

Key Features of the Winery KPI Dashboard in Excel:
🍇 Production Performance Tracking
Monitor wine production efficiency, including grape yield, fermentation processes, and bottling output, to ensure high-quality wine production.
🍷 Sales and Revenue Tracking
Track wine sales by product type, region, and channel to understand revenue generation and optimize sales strategies.
📦 Inventory Management
Monitor stock levels of raw materials (grapes, yeast, bottles) and finished wine products to ensure optimal inventory management and avoid stockouts or overstocking.
🎯 Customer Satisfaction and Feedback
Track customer ratings, reviews, and feedback to gauge satisfaction levels and improve your wine offerings.
💰 Profitability and Cost Tracking
Monitor costs related to production (grapes, labor, equipment), sales, and distribution to track profit margins and ensure financial health.
🚀 Why You’ll Love the Winery KPI Dashboard in Excel:
✅ Track Production Efficiency – Monitor grape yield, fermentation rates, and bottling output to ensure quality wine production.
✅ Manage Sales Performance – Track wine sales across various regions, products, and channels to optimize your sales strategy.
✅ Optimize Inventory – Ensure optimal stock levels of raw materials and finished products to meet demand and avoid waste.
✅ Monitor Customer Satisfaction – Track customer feedback, reviews, and ratings to continuously improve your wine offerings and customer experience.
✅ Analyze Profitability – Track production costs, sales revenue, and profit margins to ensure your winery remains profitable and sustainable.
✅ Fully Customizable and Interactive – Customize the dashboard to suit the specific needs of your winery, with interactive charts and real-time data tracking for informed decision-making.
What’s Inside the Winery KPI Dashboard in Excel:
Production Performance: Track grape yield, fermentation efficiency, and bottling output to ensure smooth and efficient wine production.
Sales and Revenue: Monitor wine sales by product, region, and sales channel to understand revenue generation and identify growth opportunities.
Inventory Management: Track the stock levels of raw materials (grapes, bottles) and finished wine products, optimizing inventory and supply chain management.
Customer Feedback: Monitor customer reviews, ratings, and feedback to assess satisfaction and continuously improve product offerings.
Profitability and Cost Tracking: Analyze production costs, sales revenue, and profit margins to ensure financial sustainability and optimize business operations.
Custom Reports: Generate customized reports summarizing key performance metrics such as sales, production efficiency, inventory, and customer feedback.
How to Use the Winery KPI Dashboard in Excel:
1️⃣ Download the Template – Access your Excel file instantly after purchase.
2️⃣ Input Production and Sales Data – Enter data on wine production, sales, and customer feedback to start tracking key KPIs.
3️⃣ Monitor Key Metrics – Use the dashboard to monitor production performance, sales figures, inventory levels, and customer satisfaction in real time.
4️⃣ Analyze Profitability – Track costs, revenue, and profit margins to ensure your winery is financially healthy and operating efficiently.
5️⃣ Generate Reports – Create customized reports summarizing key metrics such as production, sales, and customer satisfaction to make data-driven decisions.
Who Can Benefit from the Winery KPI Dashboard in Excel:
Winery Owners and Managers
Production Teams in Wineries
Sales and Marketing Teams
Financial Analysts in Wineries
Customer Experience Teams
Supply Chain and Inventory Managers
Wine Distributors and Retailers
Wine Industry Consultants
The Winery KPI Dashboard in Excel is the perfect tool for winery businesses looking to optimize their operations, monitor production, and track key metrics. Whether you’re focused on production efficiency, sales, inventory, or customer satisfaction, this dashboard gives you the insights needed to improve your winery business.
Click here to read the Detailed blog post
https://www.pk-anexcelexpert.com/winery-kpi-dashboard-in-excel/
Visit our YouTube channel to learn step-by-step video tutorials
Youtube.com/@PKAnExcelExpert





























Reviews
There are no reviews yet.