

The best set of warehouse supervisor Excel templates is a stack of eight one-time tools: one to plan restocks, three to track stock, shifts and safety, three to report the KPIs and one to present them. Our top pick is the Warehouse Efficiency Dashboard in Excel ($17.99, paid once). It shows fulfillment rate, processing time, on-time shipment % and worker productivity on five pivot-driven pages with no macros.
Last updated: October 2026
Related guides: If you want the metrics first, read our 10 warehouse KPIs to track in 2026. For a broader list of distribution-centre tools, see warehouse management templates for distribution centers. This post is different: it is a working stack for the person who runs the floor shift by shift, organised by the job each tool does, with a 30-day rollout plan.
Key takeaways
- A warehouse supervisor needs four kinds of tool: plan, track, report and present. Eight templates cover all four for $187.92 in total, paid once, with no per-user fees.
- Best overall is the Warehouse Efficiency Dashboard in Excel ($17.99): five pages, a 500-row sample dataset and slicers for zone, shift and worker.
- Best value is the Inventory & Warehouse Master Kit: eight Excel, Google Sheets, VBA and Power BI templates for $69.99 instead of $109.92 (36% off).
- Order fill rate, picking accuracy, dock-to-stock time, units per labor hour, inventory accuracy and out-of-stock rate are the core of a supervisor’s shift report.
- Templates lose to a full WMS when you need RF scanning across dozens of users, carrier integrations or automated slotting. We say exactly when to buy software instead.
Warehouse supervisor Excel templates compared
All eight templates side by side, grouped by the job they do, with the kind of paid software each one can stand in for. One is marked best overall and one best value.
| # | Template | Job | Format | Best for | What it replaces | Price |
|---|---|---|---|---|---|---|
| 1 | Warehouse Efficiency Dashboard in Excel (Best overall) | Report | Excel | Fulfillment, processing time and worker productivity by zone and shift | A BI seat for the weekly warehouse report | $17.99 |
| 2 | Inventory & Warehouse Master Kit (Best value) | All four | Excel + Sheets + VBA + Power BI | Buying the whole inventory and warehouse stack in one checkout | Several single-purpose inventory apps | $69.99 |
| 3 | Warehouse Inventory Management System Web App | Track | Google Sheets web app | Bins, batches, expiry, receiving, FEFO picking and dispatch | Entry-level WMS or inventory software billed per user | $39.99 |
| 4 | Warehouse Management KPI Dashboard in Google Sheets | Track | Google Sheets | Shared MTD/YTD KPI entry across shifts | Shared dashboard tools | $12.99 |
| 5 | Out-of-Stock Rate KPI Dashboard in Excel | Report | Excel | Stockouts, backorders and turnover by product and category | Inventory analytics add-ons | $14.99 |
| 6 | Warehouse Safety KPI Dashboard in Excel | Track | Excel | Incidents, near misses, training and inspections | EHS incident-tracking software | $14.99 |
| 7 | Warehouse Management KPI Dashboard in Power BI | Present | Power BI | Interactive monthly review for the operations manager | Custom BI report builds | $11.99 |
| 8 | Inventory Restocking Calendar in Excel | Plan | Excel | Restock dates and reminders across the year | Scheduling add-ons for simple calendars | $4.99 |
How we picked these
We searched the full NextGenTemplates catalogue of Excel, Google Sheets, Power BI and web-app templates for anything a warehouse supervisor touches in a normal shift. We kept a template only if it does one of the four jobs (plan, track, report, present) on its own, ships with editable formulas or a documented data sheet, and costs less than one month of the software it stands in for.
We dropped data-warehouse dashboards, which track database load times and query speed rather than pallets, and retail-store inventory dashboards, which are built for a shop floor rather than a dock. We also left out transport-first tools: if you run your own fleet, the logistics dashboard templates are the better list.
What does a warehouse supervisor need templates for?
The warehouse supervisor sits between the operations manager and the floor. The manager owns the budget and the targets; the supervisor owns the shift. That means a day that repeats with very little variation: check what is arriving and what must ship, assign pickers and packers to zones, chase the exceptions (short picks, damaged stock, late trucks), keep people safe, and hand over a clean shift report.
Most supervisors try to run all of that in one shared workbook, and that workbook breaks at the worst moment, usually during peak. The stack approach gives each job its own tool, fed by the same stock and order data. It is the same logic we used in the operations manager template stack and the plant manager template stack, applied to the dock, the aisles and the pack bench.
- Plan: restock dates, inbound windows and replenishment (template 8, plus reorder points in template 3).
- Track: stock by bin and batch, shift KPIs and safety incidents (templates 3, 4 and 6).
- Report: fulfillment, productivity and stockouts (templates 1 and 5).
- Present: an interactive monthly review for the operations manager (template 7).
The 8 best warehouse supervisor templates for 2026
1. Warehouse Efficiency Dashboard in Excel: best overall
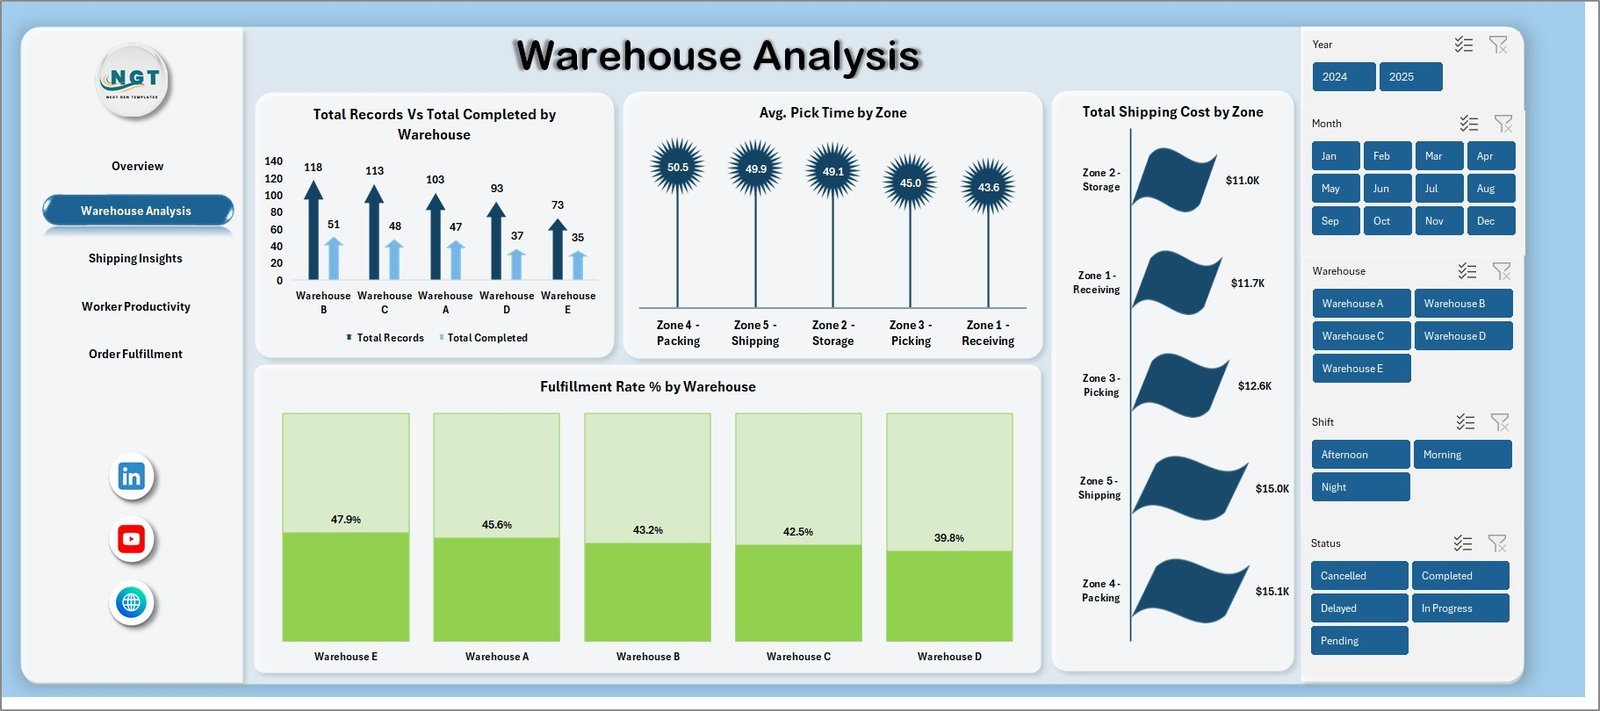
This is the shift and weekly report most supervisors try to build themselves. It has five interactive pages: Overview, Warehouse Analysis, Shipping Insights, Worker Productivity and Order Fulfillment. The Overview page carries the five cards a supervisor is asked about most: Total Orders, Total Units Shipped, Order Fulfillment Rate, Avg Processing Time and On-Time Shipment %.
What is inside:
- Slicers on every page for warehouse zone, product category, shift, worker, order status and time period.
- Worker productivity views: orders processed per worker, units picked per shift and processing time benchmarks.
- Shipping views: on-time rate by carrier, shipping cost by zone and delivery delays.
- 100% pivot-table driven, with no VBA or macros. It works in Excel 2016+ and Microsoft 365 with one Refresh All.
How warehouse supervisors use it: paste the day’s export from your order or WMS system into the data sheet, click Refresh All, and filter to your shift. The question “why was B shift slower on Tuesday?” becomes a slicer click, not an argument. The 500-row sample dataset lets you see every chart working before you add your own records.
Why it is #1: it answers the questions a supervisor is asked every single day, in the format every warehouse office already has. No IT ticket is needed to install Excel.
Price: $17.99, one-time. Get the Warehouse Efficiency Dashboard in Excel. A matching Warehouse Efficiency Dashboard in Power BI ($17.99) exists if your manager prefers Power BI.
Best for: the daily and weekly shift report, owned by one supervisor.
2. Inventory & Warehouse Master Kit: best value
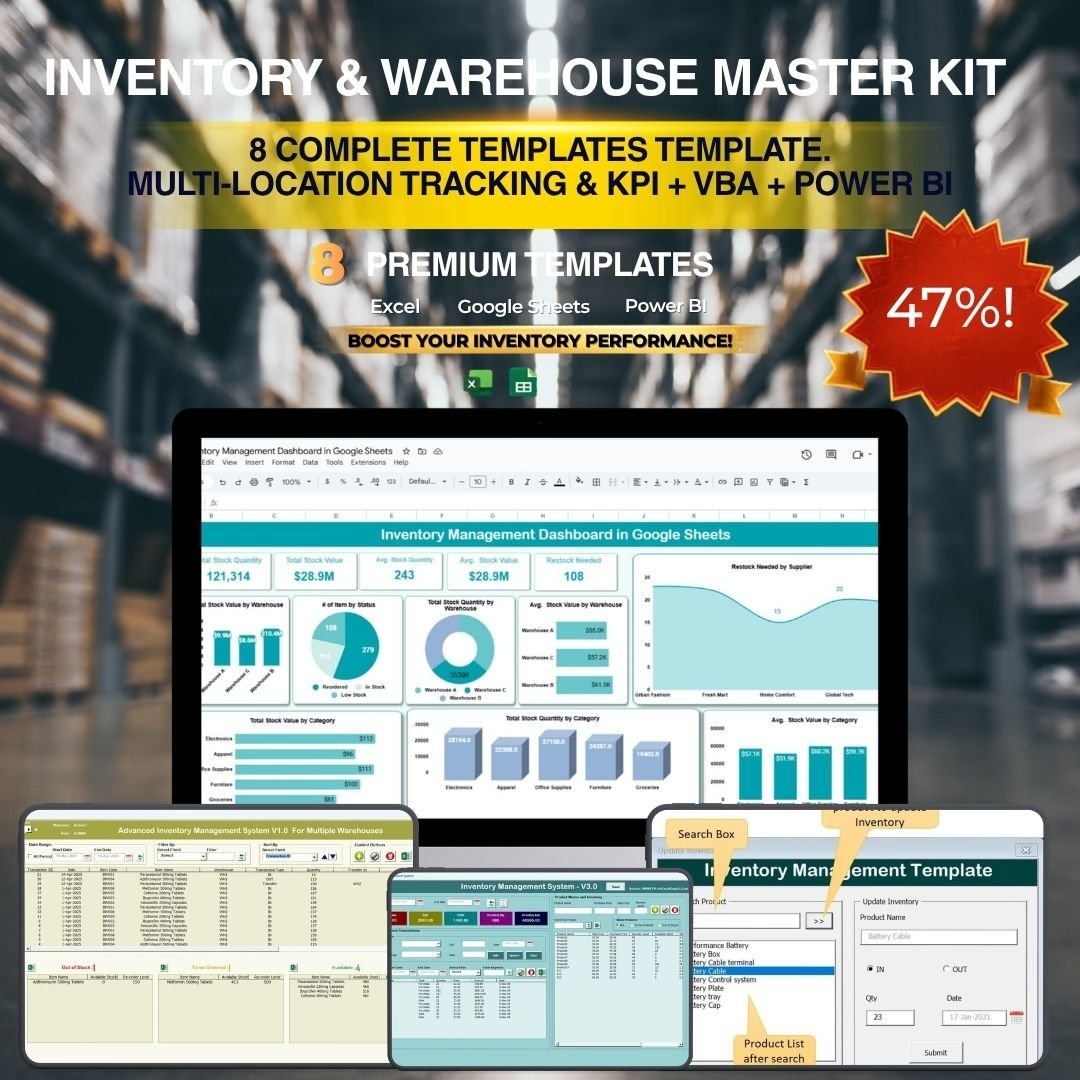
If you already know you need more than two inventory tools, buy the kit. It bundles eight premium inventory and warehouse templates. Bought one by one they cost $109.92; the kit is $69.99, a saving of $39.93, or 36%.
What is inside:
- Two Excel VBA inventory systems (Advanced Inventory Management System V1.0 and Inventory Management System V3.0) for stock, orders and replenishment alerts.
- An Inventory Management Form (VBA V2.0) for recording sales and purchases with live stock levels.
- Multi-location inventory trackers in Excel and Google Sheets, with stock in/out and transfers.
- Inventory Management Dashboards in Power BI (five report pages) and Google Sheets, plus the Warehouse Management KPI Dashboard in Excel with MTD/YTD tracking.
How warehouse supervisors use it: run stock movements through one of the VBA systems, track a second site in the multi-location sheet, and use the KPI dashboard for the monthly numbers. The kit’s own page lists warehouse supervisors as a target user, alongside inventory managers and supply chain leads.
Price: $69.99, one-time. Get the Inventory & Warehouse Master Kit.
Best for: a supervisor setting up stock control and reporting from scratch.
3. Warehouse Inventory Management System Web App
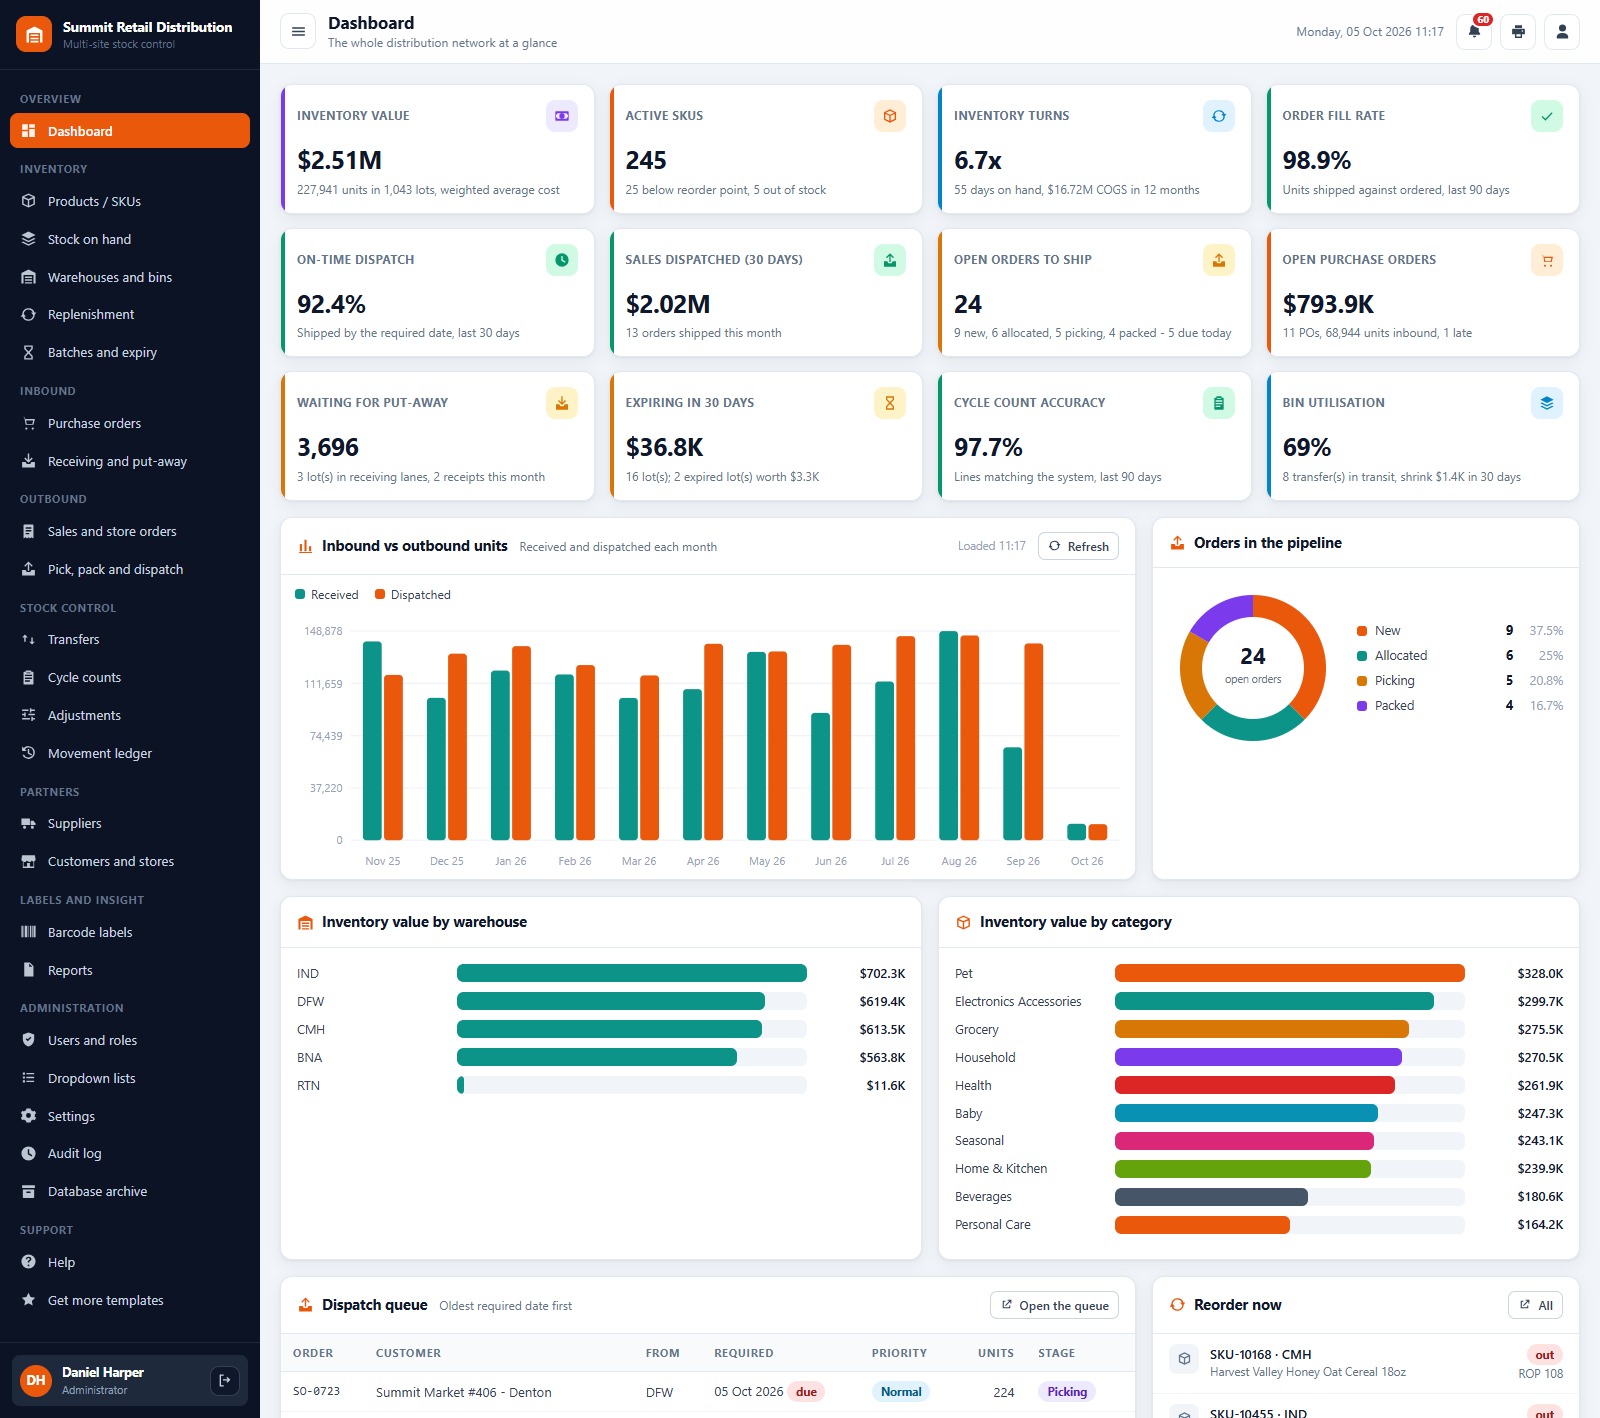
This is the tracking engine of the stack, and the closest thing to a WMS you can own outright. It runs in the browser on Google Apps Script and stores everything in a Google Sheet in your own Drive. It covers purchase orders, goods receipt and put-away, stock by warehouse, bin, batch and expiry, FEFO (first-expiry-first-out) pick, pack and dispatch, transfers, cycle counts and reason-coded adjustments.
What is inside:
- Seven roles and 41 permissions, including Warehouse Manager, Inventory Controller, Receiving Clerk and Picker / Packer.
- A Replenishment screen that lists SKUs below reorder point by warehouse and builds suggested purchase orders in one click.
- Expiry alerts for lots expiring in 30, 60 and 90 days, with the value at risk.
- Code 128 barcode labels for SKUs and bins at 3 inch, 4 inch or A4, and 25 ready-made reports with print and CSV export.
How warehouse supervisors use it: give the receiving clerk and pickers their own logins, so the dock receives line by line and the floor works a pick list in bin order. The supervisor watches inventory value, turns, fill rate, on-time dispatch and bin utilisation on the live dashboard. A public demo with all seven logins lets you try it before you buy.
Price: $39.99, one-time. Get the Warehouse Inventory Management System.
Best for: sites that need bin, batch and expiry control without per-user WMS fees.
4. Warehouse Management KPI Dashboard in Google Sheets
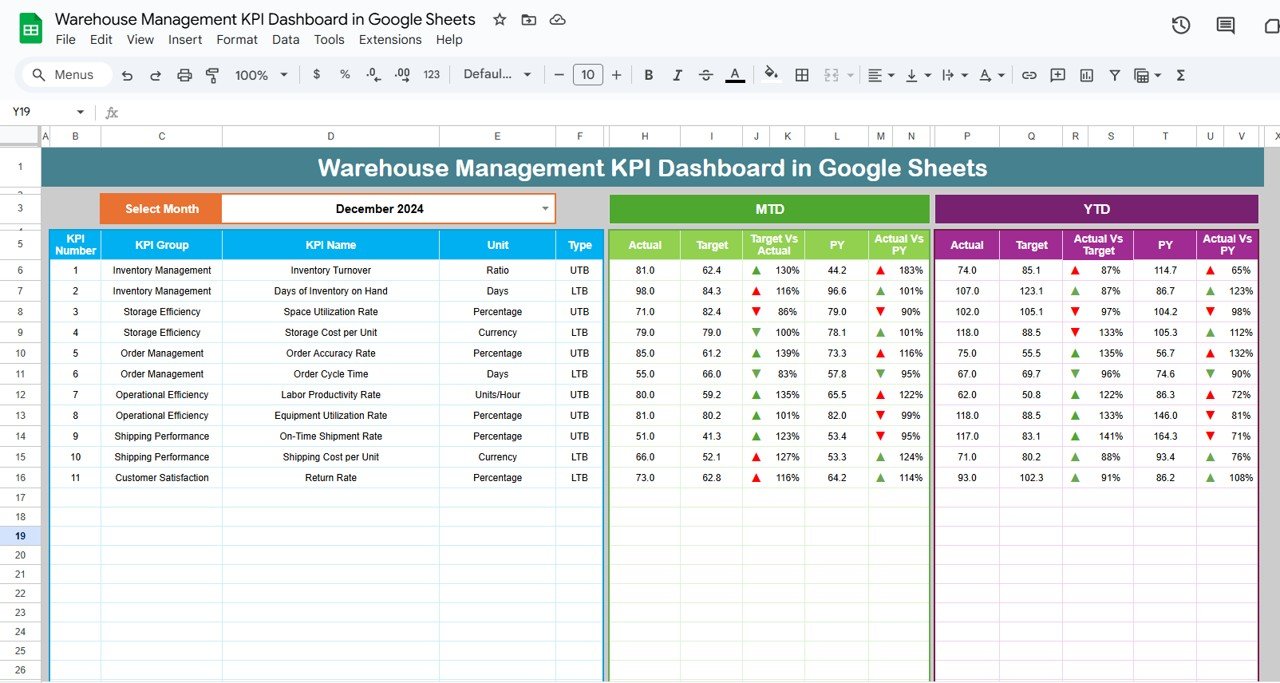
When three shifts all need to enter numbers, an Excel file on one office PC stops working. This Google Sheets dashboard tracks warehouse KPIs, from inventory turnover to employee productivity, with month-to-date and year-to-date views, targets and previous-year comparison.
What is inside:
- A Dashboard tab driven by a month dropdown, plus a KPI Trend tab for time-based trends.
- Separate Actual Number, Target and Previous Year Number tabs, so entry never touches the formulas.
- A KPI Definition tab with the formula and meaning of each metric.
- Conditional formatting arrows and colours for performance against target.
How warehouse supervisors use it: share one link with the shift leads. Each enters their numbers before handover, and the supervisor reads the live view on a phone during the floor walk. If you prefer Excel, the same dashboard exists as the Warehouse Management KPI Dashboard in Excel, which is also inside the Master Kit.
Price: $12.99, one-time. Get the Warehouse Management KPI Dashboard in Google Sheets.
Best for: shared, multi-shift KPI entry.
5. Out-of-Stock Rate KPI Dashboard in Excel
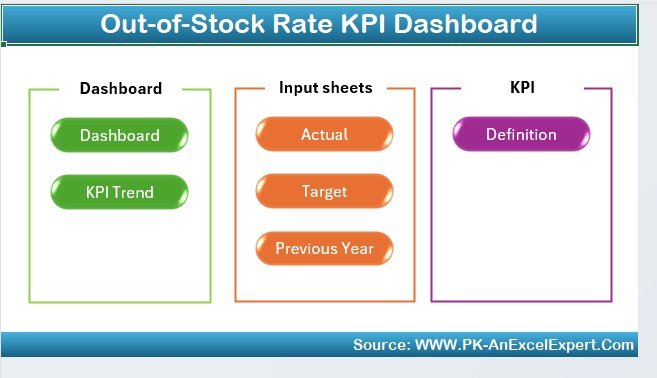
A short pick is the exception that eats most of a supervisor’s day. This dashboard tracks out-of-stock (OOS) rates by product and category, together with stock levels, backorders and turnover, so you can see whether stockouts are random or concentrated in a few SKUs.
What is inside:
- OOS rate tracking for products and categories.
- Inventory performance views: stock levels, backorders and product turnover.
- Trend analysis to spot recurring stockouts and forecast stock needs.
- Slicers and filters to drill into a product, category or time period.
How warehouse supervisors use it: bring it to the weekly meeting with purchasing. Instead of “we keep running out”, show the ten SKUs that caused most short picks and how often. That conversation changes reorder points; complaints rarely do.
Price: $14.99, one-time. Get the Out-of-Stock Rate KPI Dashboard.
Best for: supervisors whose biggest headache is short picks and backorders.
6. Warehouse Safety KPI Dashboard in Excel
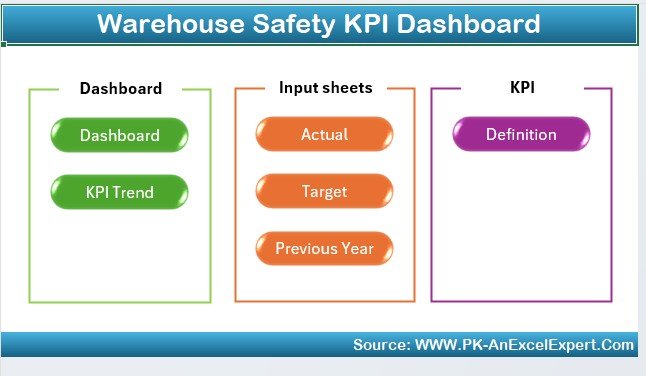
Safety is the part of the job a supervisor is personally accountable for, and it is usually tracked on paper. This dashboard records accidents, incidents and near misses, safety training participation, equipment safety checks and maintenance, audits and inspections, and hazard identification with risk levels.
What is inside:
- Accident, injury and near-miss tracking to spot trends before they become injuries.
- Safety training compliance by employee.
- Equipment maintenance and safety-check tracking for forklifts, racking and docks.
- Audit, inspection and hazard-assessment logs.
How warehouse supervisors use it: log every near miss, not just injuries. Near misses are the early warning, and a trend by zone or shift tells you where to put the next toolbox talk. For the regulations behind it, the OSHA warehousing safety page lists the hazards inspectors look at first, including forklifts, docks and material storage.
Price: $14.99, one-time. Get the Warehouse Safety KPI Dashboard. A Google Sheets version ($9.99) is available for shared entry.
Best for: supervisors who report safety numbers upward every month.
7. Warehouse Management KPI Dashboard in Power BI
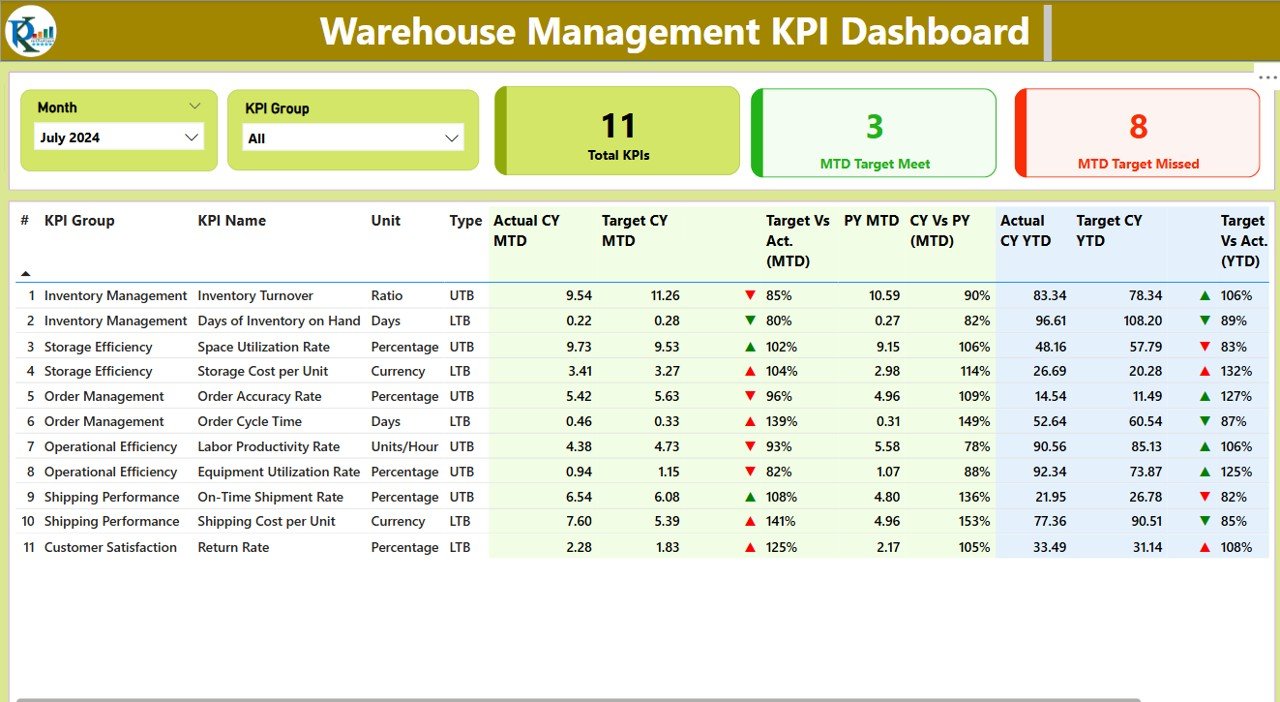
The monthly review is where a supervisor’s numbers meet the operations manager. This Power BI dashboard covers inventory levels and stock movement, order fulfillment, picking and packing efficiency, shipment and delivery performance, and labor productivity and throughput.
What is inside:
- Inventory tracking and stock-movement views.
- Order fulfillment, order accuracy and processing-time performance.
- Picking and packing efficiency, with on-time delivery and shipping delays.
- Customisable KPIs for your own warehouse.
How warehouse supervisors use it: present this instead of a slide deck. When the manager asks about one zone or one week, click to it while everyone watches. Power BI Desktop is free; you only need a paid licence to publish and share online.
Price: $11.99, one-time. Get the Warehouse Management KPI Dashboard in Power BI.
Best for: the monthly review with the operations manager.
8. Inventory Restocking Calendar in Excel

The cheapest tool in the stack, and the one that prevents the most avoidable scrambles. It tracks restocking dates per product, keeps an eye on stock levels with low-stock alerts, and gives you reminders so a replenishment is never forgotten.
What is inside:
- Restocking date tracking for each product.
- Stock-level monitoring with low-stock alerts and reminders.
- Charts for inventory and restocking trends.
- Custom categories, product types and reorder points.
How warehouse supervisors use it: put inbound restocks, supplier delivery days, stock counts and peak-season build-ups on one calendar, so labor is booked for the days the trucks actually arrive. Teams that plan together can use the Inventory Restocking Calendar in Google Sheets ($4.99), which has Annual, Monthly and Daily views.
Price: $4.99, one-time. Get the Inventory Restocking Calendar in Excel.
Best for: planning inbound labor and replenishment.
Setting up warehouse reporting from zero? The Inventory & Warehouse Master Kit gives you eight Excel, Google Sheets, VBA and Power BI templates for $69.99 instead of $109.92. One checkout, one download, no subscription.
The 30-day warehouse supervisor rollout plan
Don’t install eight tools in one week. Roll them out in the order the data flows, so each tool feeds the next one, and avoid starting during peak season.
| Days | Tool | Goal by the end of the step |
|---|---|---|
| 1–3 | Inventory Restocking Calendar | Supplier delivery days, counts and peak build-ups for the quarter on one calendar |
| 4–10 | Warehouse Inventory Management System (or a VBA system from the Master Kit) | Products, warehouses, bins and opening stock loaded; receiving clerk live |
| 11–14 | Warehouse Safety KPI Dashboard | Incident, near-miss and training history entered; inspection schedule set |
| 15–18 | Warehouse Management KPI Dashboard in Google Sheets | Shift leads entering numbers before handover |
| 19–22 | Warehouse Efficiency Dashboard in Excel | First weekly report with fulfillment rate, processing time and worker productivity |
| 23–26 | Out-of-Stock Rate KPI Dashboard | Top stockout SKUs identified and shared with purchasing |
| 27–30 | Warehouse Management KPI Dashboard in Power BI | First monthly review presented to the operations manager |
Most of the time goes into cleaning item masters and opening stock, not into configuring templates. Each single dashboard takes under an hour to set up once your data export is ready.
Which KPIs should a warehouse supervisor track?
Eight to twelve KPIs are enough for a shift report. Track more and shift leads stop reading the page. These are the ones the templates in this stack support in some form:
| KPI | Formula | What it tells you |
|---|---|---|
| Order fill rate | Orders shipped complete ÷ total orders | How often customers get everything they ordered first time |
| Picking accuracy | Correct order lines picked ÷ total lines picked | Mis-picks, which drive returns and re-ships |
| On-time shipment % | Orders shipped by the promised time ÷ total orders shipped | Whether the floor keeps the promise sales made |
| Dock-to-stock time | Time from receipt at the dock to available in a bin | How fast inbound stock becomes sellable |
| Units picked per labor hour | Units picked ÷ picking labor hours | Labor productivity by worker, zone or shift |
| Inventory accuracy | Counted quantity matching system ÷ locations counted | Whether the system can be trusted for picking |
| Out-of-stock rate | SKUs or order lines out of stock ÷ total SKUs or lines | Lost or delayed orders from missing stock |
| Inventory turnover | Cost of goods sold ÷ average inventory value | How fast stock moves through the building |
| Storage utilisation | Occupied locations or space ÷ total available | When you are running out of room before peak |
| Total recordable incident rate | Recordable injuries × 200,000 ÷ total hours worked | Safety performance on the standard OSHA basis |
For the full definitions, targets and the dashboards that calculate them, read our guide to warehouse KPIs to track in 2026.
How to choose between them
- You need one shift report by Friday: start with the Warehouse Efficiency Dashboard in Excel ($17.99).
- You are building stock control and reporting from nothing: buy the Inventory & Warehouse Master Kit ($69.99).
- You need bins, batches, expiry and role logins: the Warehouse Inventory Management System web app ($39.99).
- Three shifts enter numbers: the Warehouse Management KPI Dashboard in Google Sheets ($12.99).
- Short picks are your biggest problem: the Out-of-Stock Rate KPI Dashboard ($14.99).
- Your manager asks about safety first: the Warehouse Safety KPI Dashboard ($14.99).
If you are the warehouse manager rather than the supervisor, also look at our Excel inventory management tools for warehouse managers. Teams that track improvement projects across sites may find the Smartsheet alternatives in Excel and Sheets useful for the project side.
When a template is NOT the right answer
Templates are the right tool for most small and mid-sized warehouses, but not for every operation. Buy a WMS instead when:
- You need RF scanning at scale. If dozens of handheld scanners must confirm every pick in real time, you need a database-backed WMS. Templates can analyse that data, but they should not be the system that collects it.
- You need carrier and marketplace integrations. Automatic rate shopping, label printing from carrier APIs and live marketplace stock sync are WMS and shipping-software territory.
- You run a 3PL with client billing. Storage and handling billing per client, per pallet and per day is a specialised WMS feature.
- You need automated slotting or wave planning. Algorithmic slotting, labor management standards and wave or zone release are beyond what a spreadsheet should do.
Even then, many warehouses keep an Excel or Power BI dashboard on top of the WMS, because it is faster to change than the WMS’s built-in reports. That reporting layer is exactly where templates 1, 5 and 7 fit.
Frequently asked questions
What are the best warehouse supervisor Excel templates?
The Warehouse Efficiency Dashboard in Excel ($17.99) is our top pick. It covers order fulfillment rate, average processing time, on-time shipment % and worker productivity across five pages, with slicers for zone, shift and worker. For a full set, the Inventory & Warehouse Master Kit bundles eight templates for $69.99.
Which KPIs should a warehouse supervisor track?
Start with order fill rate, picking accuracy, on-time shipment %, dock-to-stock time, units picked per labor hour, inventory accuracy, out-of-stock rate and a safety measure such as recordable incident rate. Eight to twelve KPIs make a readable shift report. Every dashboard in this stack has editable KPIs and targets.
Can Excel replace a warehouse management system?
For a small or mid-sized warehouse, often yes. The web app and VBA systems in this stack handle receiving, bins, batches, picking, transfers and cycle counts. They don’t replace a WMS for RF scanning at scale, carrier integrations, 3PL client billing or automated slotting.
Is Excel or Google Sheets better for warehouse supervisors?
Excel is better for the report one supervisor owns, because it handles pivots and large exports well. Google Sheets is better when several shift leads enter numbers, because everyone works on one live link. Many warehouses use both: Sheets for entry, Excel for the weekly report.
Do I need Power BI Pro to use the Power BI template?
No. Power BI Desktop is free, and you can open, edit and present the dashboard in it. You only need a paid Power BI licence if you want to publish the report to the Power BI service and share it online with colleagues.
How much does the full warehouse supervisor template stack cost?
All eight templates cost $187.92 in total, paid once. The seven single templates come to $117.93, and the Inventory & Warehouse Master Kit is $69.99. There are no per-user fees and no renewals. Most supervisors start with two or three tools and add the rest later.
Can several shift leads enter data at the same time?
Yes, with the Google Sheets tools. The Warehouse Management KPI Dashboard in Google Sheets and the Warehouse Inventory Management System web app are built for shared entry, and the web app gives each person a role-based login. The Excel files work best with one owner.
How do you calculate order fill rate?
Divide the number of orders shipped complete by the total number of orders in the period, then multiply by 100. If 940 of 1,000 orders shipped complete, the fill rate is 94%. The Warehouse Efficiency Dashboard reports the related order fulfillment rate on its Overview page.
Can I customise the templates for my warehouse?
Yes. Formulas, KPI names, targets, dropdown lists and charts are editable, and you own the files outright. Rename zones, shifts and sites, add your own product categories or incident types, and change the targets. Being editable was a selection rule for every template in this stack.
Get more warehouse supervisor templates
Run the shift from numbers, not from memory. The Inventory & Warehouse Master Kit bundles eight premium Excel, Google Sheets, VBA and Power BI templates for $69.99 (save $39.93). Or start with the Warehouse Efficiency Dashboard in Excel for $17.99.
Watch demos of these dashboards on our NextGenTemplates YouTube channel, and see more tools for the dock and aisles in our warehouse management templates roundup.