

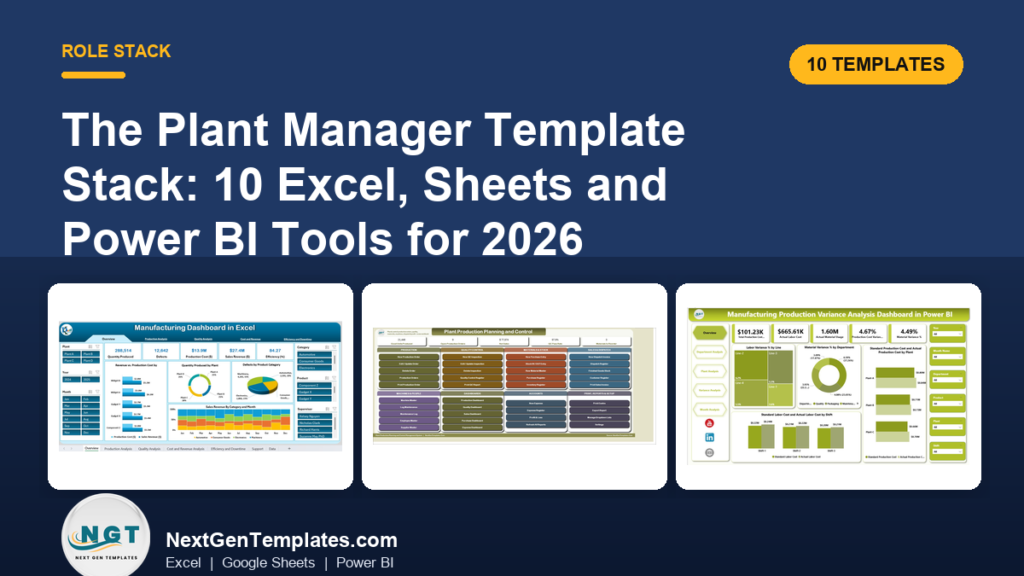
The best plant manager dashboard Excel setup is a stack of ten one-time templates that cover the whole job: plan production, track the floor, report the KPIs and present them upward. Our top pick is the Manufacturing Dashboard in Excel ($17.99, paid once). It puts OEE, throughput, first pass yield, downtime, MTBF and MTTR on one screen without a single macro.
Last updated: October 2026
Related guide: If you want a broader list of factory dashboards by format, read our manufacturing dashboard templates for plant managers. This post is different: it is a working stack, organised by the job each tool does in a plant manager’s week, with a 30-day rollout plan.
Key takeaways
- A plant manager needs four kinds of tool: one to plan, one to track, one to report and one to present. Ten templates cover all four for $237.91 in total, paid once.
- Best overall is the Manufacturing Dashboard in Excel ($17.99), with 15+ manufacturing KPIs across seven analysis pages and no VBA.
- Best value is the Plant Production Manager Toolkit: nine Excel and Power BI templates for $79.99 instead of $132.91 bought one by one.
- OEE = Availability × Performance × Quality. Track it next to scrap rate, first pass yield, MTTR and schedule attainment, and you have the core of a plant report.
- Templates lose to MES and CMMS software when you need machine-connected data capture, audit trails or dozens of concurrent users. We say exactly when to buy software instead.
Plant manager dashboard Excel templates compared
All ten templates side by side, grouped by the job they do, with the kind of paid software each one can stand in for. One is marked best overall and one best value.
| # | Template | Job | Format | Best for | What it replaces | Price |
|---|---|---|---|---|---|---|
| 1 | Manufacturing Dashboard in Excel (Best overall) | Report | Excel | OEE, FPY, downtime, MTBF and MTTR on one screen | BI seat for the plant report | $17.99 |
| 2 | Plant Production Manager Toolkit (Best value) | All four | Excel + Power BI | Buying the whole plant-analytics stack in one checkout | Several single-purpose subscriptions | $79.99 |
| 3 | Plant Production Planning and Control Management System | Plan | Excel VBA | Production orders, QC, stock, dispatch and maintenance in one file | Small-plant ERP or MRP module | $29.00 |
| 4 | Manufacturing Production Management System V1.0 | Track | Excel VBA | A mini-ERP with login and 13 modules | SAP Business One or NetSuite at small scale | $19.99 |
| 5 | Equipment Maintenance Management System | Track | Google Sheets web app | Work orders, preventive maintenance, MTTR and MTBF | CMMS such as MaintainX, Fiix or UpKeep | $24.99 |
| 6 | Manufacturing Production Variance Analysis Dashboard | Report | Excel | Labor, material and cost variance by line and shift | Month-end cost-accounting spreadsheets | $17.99 |
| 7 | Manufacturing Production Variance Analysis Dashboard | Present | Power BI | Interactive variance review for leadership | Custom BI report builds | $17.99 |
| 8 | Manufacturing Performance KPI Dashboard | Report | Excel | Efficiency, quality, downtime and utilisation trends | KPI scorecard software | $14.99 |
| 9 | Manufacturing KPI Dashboard | Report | Google Sheets | A shared MTD/YTD KPI page with targets | Shared dashboard tools | $9.99 |
| 10 | Manufacturing Production Calendar | Plan | Excel | Annual, monthly and daily production events | Scheduling add-ons for simple calendars | $4.99 |
How we picked these
We searched the full NextGenTemplates catalogue of Excel, Google Sheets, Power BI and web-app templates for anything a plant manager touches in a normal week. We kept a template only if it does one of the four jobs (plan, track, report, present) on its own, ships with editable formulas or a documented data sheet, and costs less than one month of the software it stands in for.
We dropped industry-specific dashboards, such as footwear, ceramics or fertilizer manufacturing, because a general plant manager would pay for screens they never use. Those exist if you run exactly that kind of plant. We also left out finance-led tools, which belong in the CFO dashboard template stack.
What does a plant manager need a dashboard for?
The plant manager’s week has a rhythm that looks the same in a machining shop, a food plant or an assembly line. Monday is the plan: which orders run on which line, what material is short, which machine is due for service. Tuesday to Thursday is tracking: breakdowns, scrap, rework, late material and labor hours. Friday is the report, and once a month there is a review where the numbers are presented to a general manager, owner or corporate team.
Most plants try to do all four jobs in one giant spreadsheet. That is why the file breaks. The stack approach gives each job its own tool, connected by the same production data. It is the same logic we used for the operations manager template stack, applied to the narrower and more technical world of the plant floor. If your role covers suppliers, stock and shipments rather than the line, see the supply chain management tools stack.
- Plan: production orders, schedules and the calendar (templates 3 and 10).
- Track: production records, quality inspections and maintenance work orders (templates 4 and 5).
- Report: OEE, KPIs and variance (templates 1, 6, 8 and 9).
- Present: an interactive review deck for leadership (template 7, plus the Power BI files in the toolkit).
The 10 best plant manager templates for 2026
1. Manufacturing Dashboard in Excel: best overall
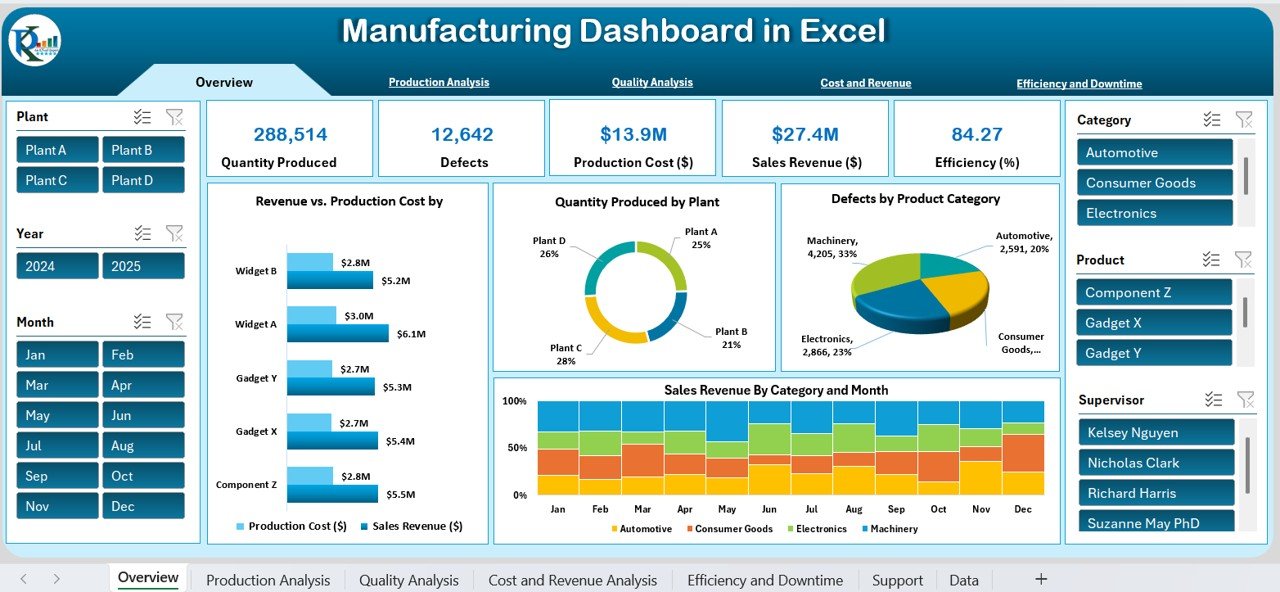
This is the plant report most managers try to build themselves and never finish. It tracks 15+ manufacturing KPIs, including OEE, throughput, first pass yield (FPY), downtime, MTBF, MTTR, scrap rate and on-time delivery, across shifts, machines and product lines.
What is inside:
- Seven pages: Production, Efficiency, Quality, Downtime, Inventory, Data and Support.
- 100% native Excel, with no macros, no Power BI and no add-ins. It works in Excel 2016, 2019, 2021 and Microsoft 365.
- A realistic sample dataset, so every chart works the moment you open it.
How plant managers use it: paste last week’s production log into the data sheet on Friday morning and the KPI cards update in minutes. Filter to one shift to see whether the night shift’s scrap rate is really higher. Filter to one machine to check whether its MTBF is falling before it fails outright.
Why it is #1: it answers the questions a plant manager is asked most, in the format almost every plant already owns. No IT ticket is needed to install Excel.
Price: $17.99, one-time. Get the Manufacturing Dashboard in Excel.
Best for: the weekly plant KPI report, owned by one person.
2. Plant Production Manager Toolkit: best value

If you already know you need more than two of these tools, buy the toolkit. It bundles nine premium manufacturing templates across Excel and Power BI. Bought one by one they cost $132.91; the toolkit is $79.99, a saving of $52.92, or about 40%.
What is inside:
- Production, OEE, planning, quality, KPI scorecard and heavy machinery templates.
- OEE tracking split into Availability, Performance and Quality, with 15+ manufacturing KPIs.
- A production planning dashboard for target vs actual output, capacity and schedule attainment.
- A VBA production management system for data entry, plus an MTD/YTD traffic-light KPI scorecard for monthly reviews.
How plant managers use it: run the Excel files at the daily standup and open the Power BI dashboard in the monthly review. Plants with heavy equipment get a machinery view of utilisation, fuel, maintenance and downtime.
Price: $79.99, one-time. Get the Plant Production Manager Toolkit.
Best for: a new plant manager setting up reporting from scratch.
3. Plant Production Planning and Control Management System V1.0 in Excel VBA
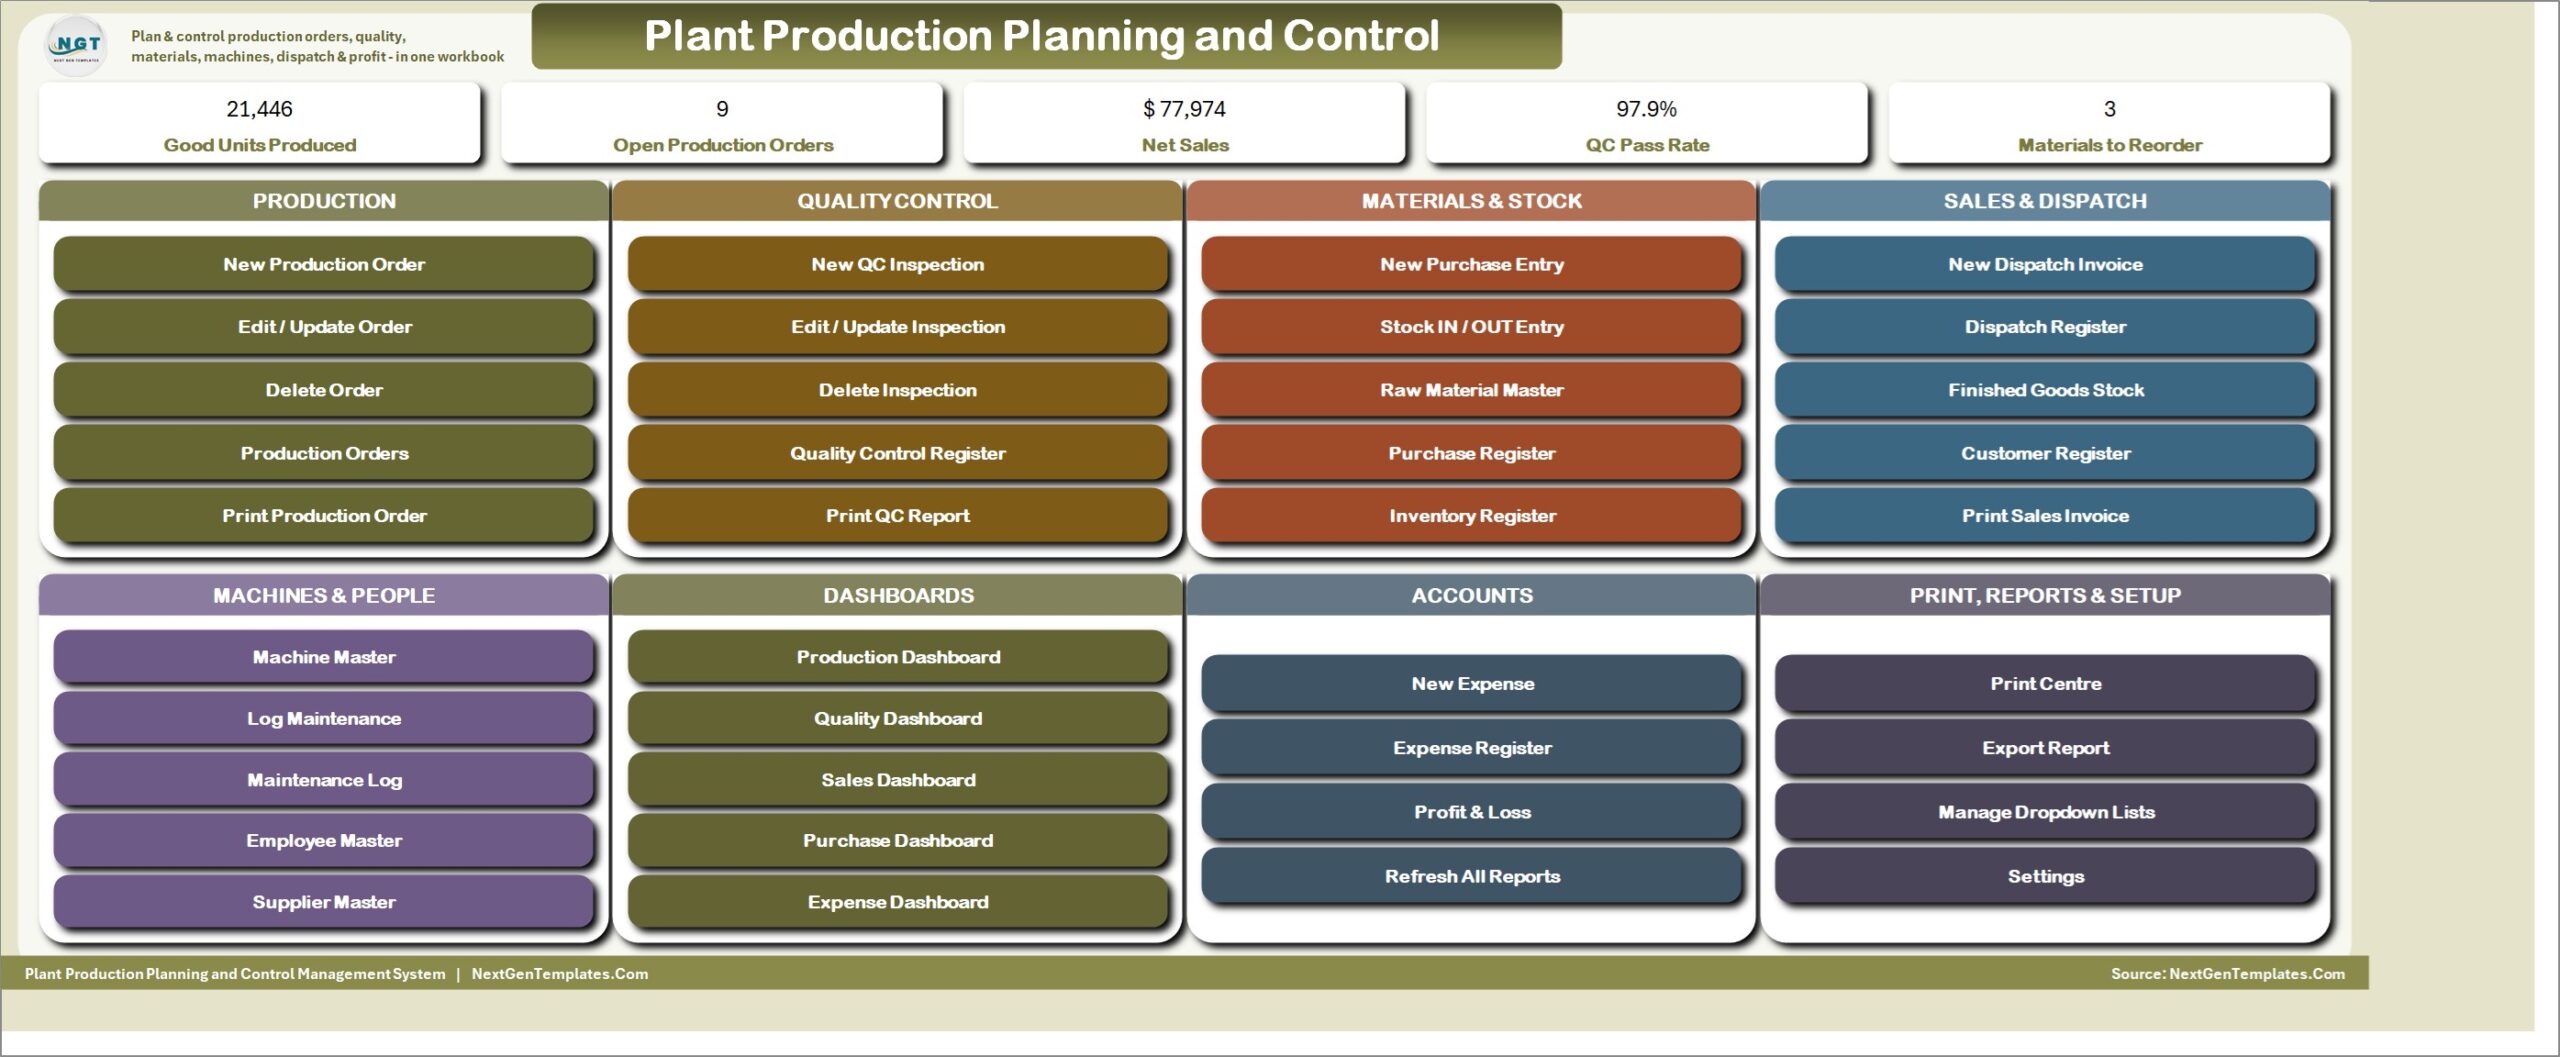
This is the planning engine of the stack. One macro-enabled Excel file runs production orders, quality inspections, raw material stock, dispatch invoices, machines, maintenance and expenses. It has 22 worksheets, 13 VBA entry forms, 5 pivot dashboards, a live profit and loss statement and 5 printable documents.
What is inside:
- Production orders that calculate achievement %, scrap %, capacity utilisation, cost and output value.
- Batch quality control with checked, defective and passed quantities, defect type and a Pass / Rework / Reject result.
- Automatic raw material and finished goods stock with reorder status.
- Machine service intervals with an OK / Due Soon / Overdue flag.
How plant managers use it: every record goes in through a checked form, so no one types into a data sheet and breaks a formula. The sample data (120 production orders, 108 QC inspections, 30 maintenance jobs) shows exactly how a month of real plant activity looks before you add your own.
Price: $29.00, one-time. Get the Plant Production Planning and Control System.
Best for: plants that have outgrown an order list but don’t want an ERP.
4. Manufacturing Production Management System V1.0
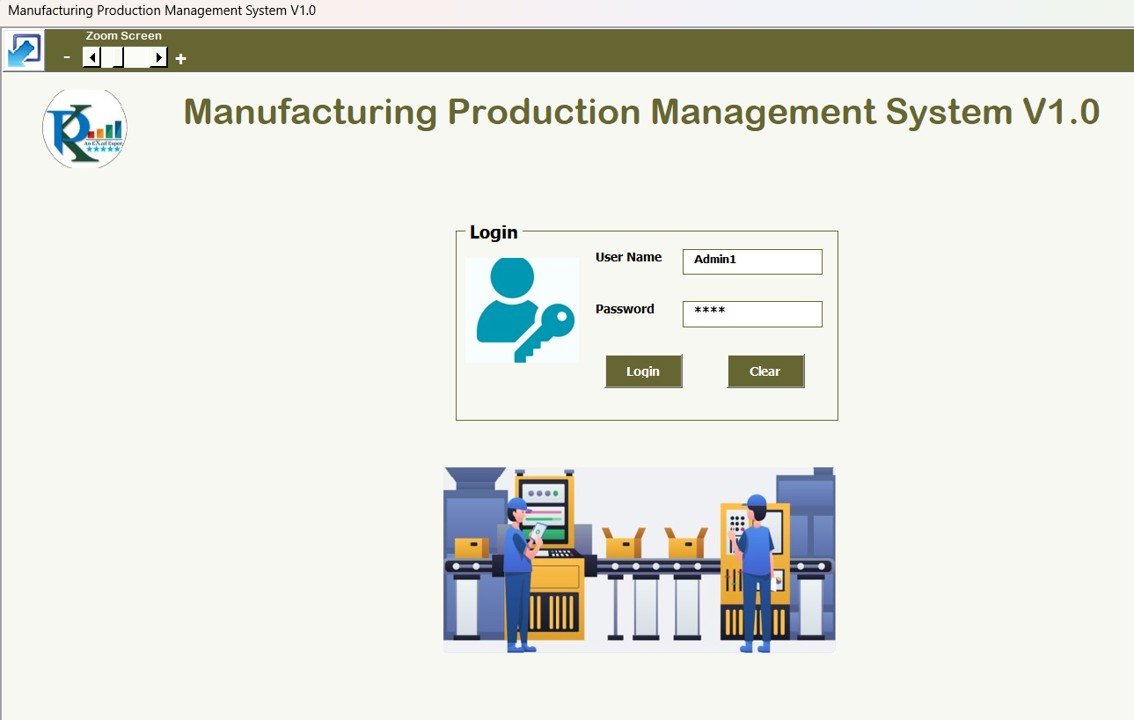
A lighter mini-ERP inside a single .xlsm file. It covers production orders, machine, raw material and supplier masters, QC, inventory, purchases, employee records, expenses and reports: 13 modules behind a secure login with user-level access control.
What is inside:
- A central dashboard with a list box and filters for moving between modules.
- Automatic tracking of production, QC, inventory and purchases.
- Real-time production reports and an export feature.
How plant managers use it: it suits a 10-person fabrication shop or a contract assembly line still running on paper job cards. Our product page sets out the comparison: SAP Business One cloud runs $95–$250 per user per month, and a small ERP implementation commonly costs $15,000–$50,000 before the first order is logged.
Price: $19.99, one-time. Get the Manufacturing Production Management System.
Best for: small plants that need logins and access control on a budget.
5. Equipment Maintenance Management System Web App
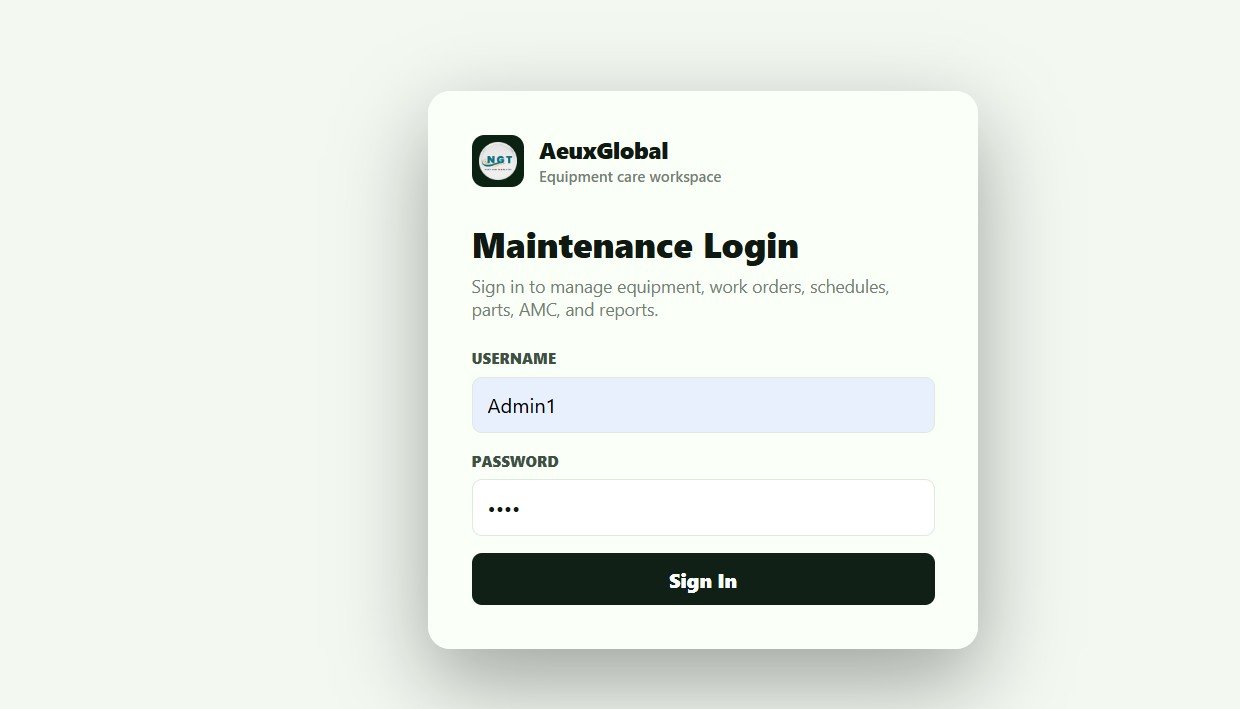
Downtime is the number that hurts a plant manager most, and this is the maintenance tool that cuts it. It is a Google Sheets and Apps Script web app with 21 connected screens, a secure multi-user login with roles, and 12 live dashboard KPIs, including open and overdue work orders, PM due, downtime hours, MTTR, MTBF and low-stock spare parts.
What is inside:
- Preventive maintenance schedules that create due work orders on a daily trigger.
- Breakdown-to-work-order flow for technicians.
- Equipment master, spare parts, vendors, AMC tracking and reports.
How plant managers use it: technicians log breakdowns, the planner sees PM due today, and the plant manager reads MTTR and MTBF without chasing anyone. Setup takes under 15 minutes.
Price: $24.99, one-time. Get the Equipment Maintenance Management System.
Best for: plants that want CMMS basics without per-technician fees.
6. Manufacturing Production Variance Analysis Dashboard in Excel

OEE tells you how well the machines ran. Variance tells you what it cost. This five-page workbook turns production data into labor variance, material variance and total production cost variance, broken down by plant, department, line, shift and month.
What is inside:
- Standard vs actual comparison for labor, material and cost.
- Line, shift and plant analysis to spot underperformance.
- Department-wise variance and monthly trend tracking.
How plant managers use it: when the controller asks why the month came in over standard, filter to the line and shift and show whether it was labor hours or material usage. That conversation takes five minutes instead of a week of spreadsheet archaeology.
Price: $17.99, one-time. Get the Variance Analysis Dashboard in Excel.
Best for: plant managers with a cost or margin target.
7. Manufacturing Production Variance Analysis Dashboard in Power BI
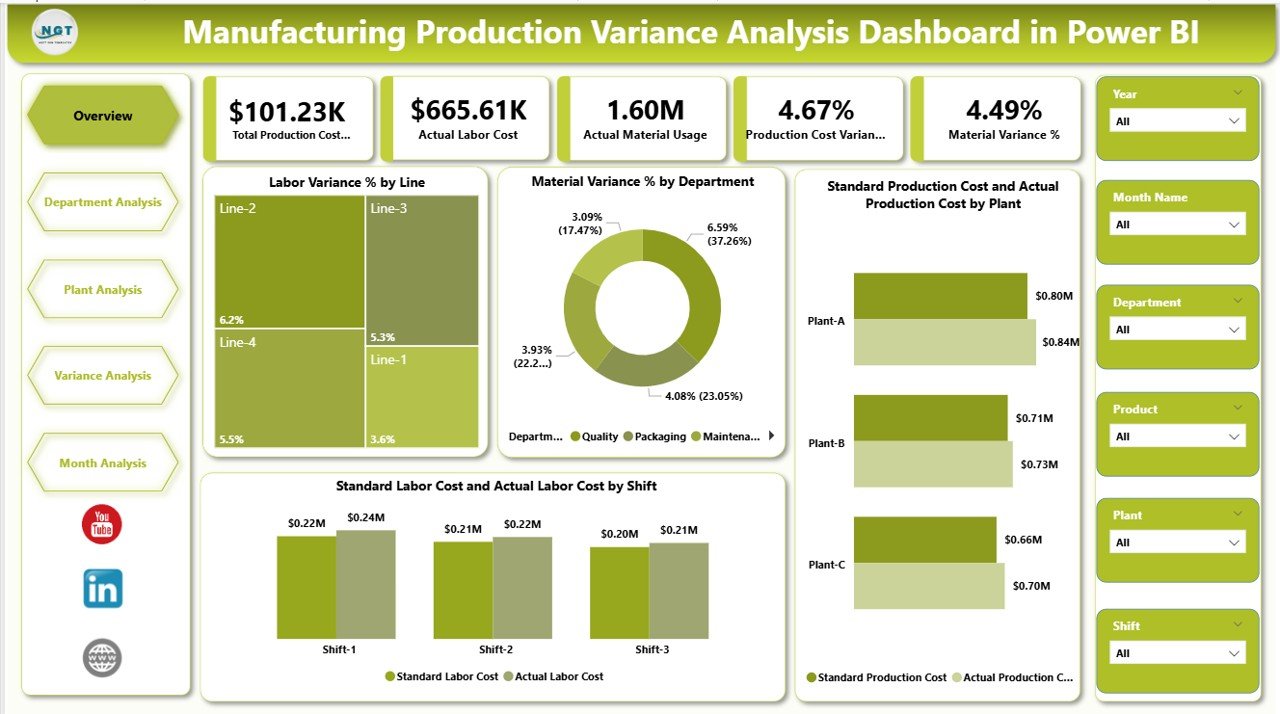
The same variance model, built for the monthly leadership review. Five analytical pages with slicers for month, plant and department let you click from the total down to a single shift while the room watches.
What is inside:
- Labor, material and total cost variance with standard vs actual insight.
- Plant-level benchmarking for multi-plant operations.
- Shift efficiency and line-level material variance views.
How plant managers use it: present this instead of a slide deck. Questions get answered with a click rather than “I’ll come back to you”. Power BI Desktop is free; you only need a paid Power BI licence to publish and share online.
Price: $17.99, one-time. Get the Variance Analysis Dashboard in Power BI.
Best for: multi-plant managers presenting to corporate.
8. Manufacturing Performance KPI Dashboard in Excel

A KPI-first dashboard for plants that already know which numbers they report. It covers production efficiency and capacity utilisation, quality (defect rates, scrap percentages and rework costs), downtime sources and labor and material utilisation.
What is inside:
- Production efficiency and capacity tracking.
- Quality control analysis with defect, scrap and rework cost.
- Downtime tracking and time-based trend analysis.
How plant managers use it: use it as the monthly KPI book next to the weekly Manufacturing Dashboard. The time-based views show whether a scrap problem is a one-off spike or a three-month trend.
Price: $14.99, one-time. Get the Manufacturing Performance KPI Dashboard.
Best for: a monthly KPI pack with trends.
9. Manufacturing KPI Dashboard in Google Sheets
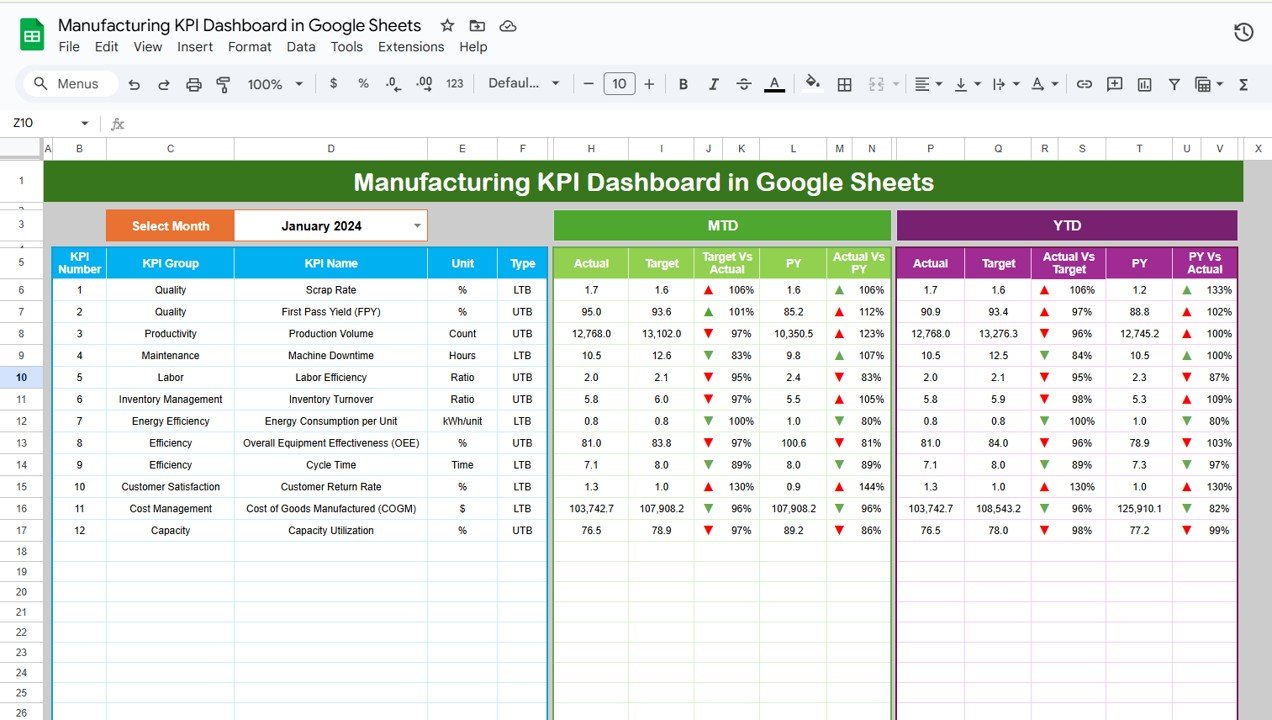
When supervisors on three shifts all need to enter numbers, Excel on one laptop stops working. This Google Sheets dashboard tracks production volume, defect rates, machine downtime and labor efficiency with month-to-date and year-to-date views, targets and colour-coded alerts.
What is inside:
- MTD and YTD tracking against targets.
- Trend charts for production and efficiency.
- Customisable KPIs and colour-coded deviation alerts.
How plant managers use it: share one link with shift supervisors. Each enters their numbers before handover, and the plant manager reads the live view on a phone during the morning walk.
Price: $9.99, one-time. Get the Manufacturing KPI Dashboard in Google Sheets.
Best for: shared, multi-shift data entry.
10. Manufacturing Production Calendar in Excel
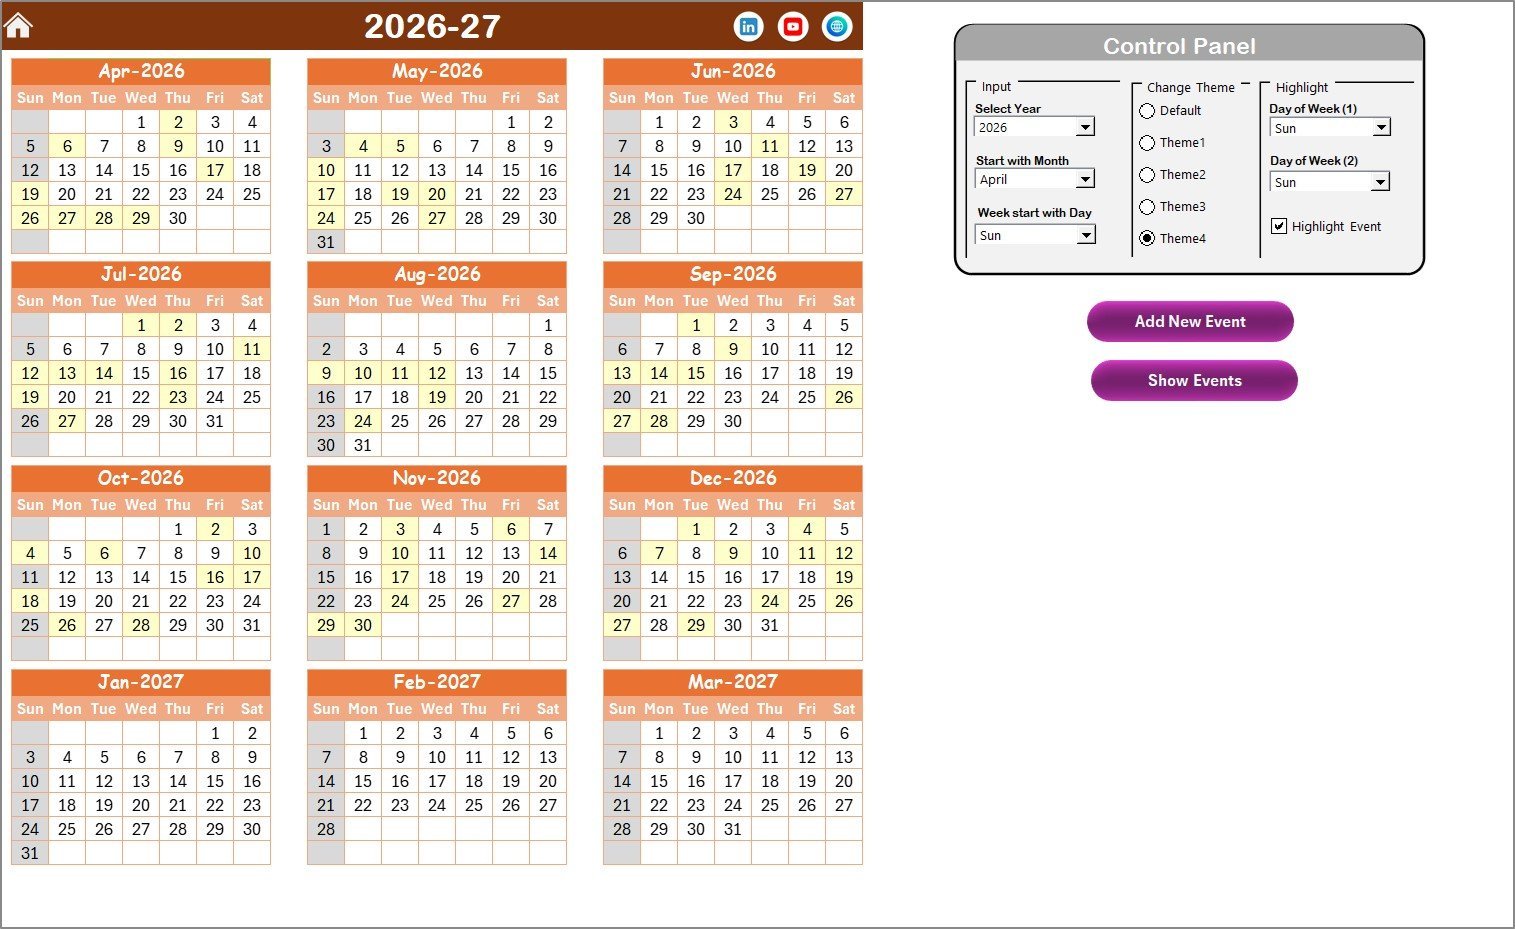
The cheapest tool in the stack, and the one that stops the most avoidable problems. It is a five-sheet production calendar with Home, Annual, Monthly, Daily and Events views, a control panel for year, start month and start day, and five colour themes.
What is inside:
- Forms to add, update and delete events from any calendar view.
- Highlighted weekends and events across the annual view.
- A central events database.
How plant managers use it: put planned shutdowns, customer audits, changeovers, holidays and major maintenance windows on one calendar. Then nobody books a customer visit for the week line 2 is down for overhaul.
Price: $4.99, one-time. Get the Manufacturing Production Calendar.
Best for: shutdown, audit and changeover planning.
Setting up plant reporting from zero? The Plant Production Manager Toolkit gives you nine Excel and Power BI manufacturing templates for $79.99 instead of $132.91. One checkout, one ZIP, no subscription.
The 30-day plant manager rollout plan
Don’t install ten tools on a Monday. Roll them out in the order the data flows, so each tool feeds the next one.
| Days | Tool | Goal by the end of the step |
|---|---|---|
| 1–3 | Manufacturing Production Calendar | Shutdowns, audits, holidays and PM windows for the year on one calendar |
| 4–10 | Plant Production Planning and Control System (or the Production Management System) | Masters loaded: products, materials, machines, employees; open orders entered |
| 11–14 | Equipment Maintenance Management System | Equipment list and PM schedules loaded; technicians logging breakdowns |
| 15–18 | Manufacturing KPI Dashboard in Google Sheets | Supervisors entering shift numbers before handover |
| 19–22 | Manufacturing Dashboard in Excel | First weekly plant report with OEE, FPY, downtime and MTTR |
| 23–26 | Manufacturing Performance KPI Dashboard | Targets set; first monthly KPI pack |
| 27–30 | Variance Analysis Dashboard (Excel, then Power BI) | Standards loaded; first standard vs actual review presented |
Most of the time goes into cleaning historical data, not configuring templates. Each single template takes under an hour to set up once your data is ready.
Which KPIs should be on a plant manager dashboard?
Ten to fifteen KPIs are enough. Track more and supervisors stop reading the page. These are the ones every template in this stack supports in some form:
| KPI | Formula | What it tells you |
|---|---|---|
| OEE | Availability × Performance × Quality | How much of planned time produced good parts at full speed. 85% is the widely quoted “world-class” figure; many plants run well below it. |
| Availability | Run time ÷ planned production time | Losses from breakdowns and changeovers |
| Performance | (Ideal cycle time × total count) ÷ run time | Losses from slow running and minor stops |
| Quality | Good count ÷ total count | Losses from scrap and rework |
| First pass yield | Units right first time ÷ units started | Process capability without rework |
| Scrap rate | Scrapped units ÷ total units produced | Material lost, usually the fastest cost win |
| MTBF | Total operating time ÷ number of failures | Equipment reliability |
| MTTR | Total repair time ÷ number of repairs | Maintenance response speed |
| Schedule attainment | Actual output ÷ planned output | Whether the plan was realistic and met |
| Labor / material variance | (Actual − standard) × rate or price | Where cost overruns came from |
For context on how output and productivity are measured across the sector, the NIST Manufacturing Extension Partnership publishes guidance for small and mid-sized US manufacturers.
How to choose between them
- You need one report by Friday: start with the Manufacturing Dashboard in Excel ($17.99).
- You are building plant reporting from nothing: buy the Plant Production Manager Toolkit ($79.99).
- Orders and stock live on paper or WhatsApp: the Plant Production Planning and Control System ($29), or the Production Management System ($19.99) if you need logins.
- Breakdowns are your biggest loss: the Equipment Maintenance Management System ($24.99).
- Your boss asks about cost, not OEE: the Variance Analysis Dashboard, in Excel for you and Power BI for the review.
- Three shifts enter data: the Manufacturing KPI Dashboard in Google Sheets ($9.99).
Warehouse-heavy plants should also look at our Excel inventory management tools for warehouse managers. If you deliver product with your own fleet, see the logistics dashboard templates.
When a template is NOT the right answer
Templates are the right tool for most small and mid-sized plants, but not for every plant. Buy software instead when:
- You need machine-connected data. If cycle counts must come straight from PLCs or sensors, you need an MES or IIoT platform. Excel can analyse that data, but it should not be the system that collects it.
- You are regulated. Pharma, medical device and aerospace plants usually need validated systems with electronic signatures and audit trails. A spreadsheet will not pass that audit.
- Dozens of people edit at once. The Google Sheets tools handle a few shifts comfortably. A 300-person plant with 40 concurrent users needs a database-backed system.
- You need full MRP. Multi-level bills of materials, automatic purchase suggestions and finite-capacity scheduling are ERP territory.
Even then, many plants keep an Excel or Power BI dashboard on top of the big system, because it is faster to change than the ERP’s reports. Our Power BI dashboard templates ranked by industry are built for exactly that layer.
Frequently asked questions
What is the best plant manager dashboard Excel template?
The Manufacturing Dashboard in Excel ($17.99) is our top pick. It tracks 15+ KPIs, including OEE, throughput, first pass yield, downtime, MTBF and MTTR, across seven pages and works in Excel 2016 or later without macros. Replace the sample data with your production log and every KPI updates automatically.
Which KPIs should a plant manager track?
Start with OEE and its three parts (availability, performance and quality), first pass yield, scrap rate, MTBF, MTTR, schedule attainment and labor and material variance. Ten to fifteen KPIs make a readable weekly report. Every dashboard in this stack has editable KPIs and targets.
How do you calculate OEE in Excel?
Multiply availability by performance by quality. Availability is run time divided by planned time, performance is ideal cycle time times total count divided by run time, and quality is good count divided by total count. The Manufacturing Dashboard in Excel and the Plant Production Manager Toolkit calculate it for you.
Is Excel or Power BI better for a plant manager dashboard?
Excel is better for the daily and weekly report one person owns, because every plant already has it. Power BI is better for presenting to leadership, where you click from plant to line to shift. Many plant managers use both, which is why the toolkit includes Excel and Power BI files.
Can these templates replace an ERP or MES?
For a small plant, the Excel VBA systems in this stack cover production orders, QC, stock, maintenance and reports, which is what many small plants use an ERP for. They don’t replace machine-connected MES data capture, validated audit trails or full multi-level MRP.
Do I need Power BI Pro to use the Power BI templates?
No. Power BI Desktop is free, and you can open, edit and present the .pbix files in it. You only need a paid Power BI licence if you want to publish the report to the Power BI service and share it online with colleagues.
How much does the full plant manager template stack cost?
All ten templates cost $237.91 in total, paid once. The nine single templates come to $157.92, and the Plant Production Manager Toolkit is $79.99. There are no per-user fees and no renewals. Most plants start with two or three tools and add the rest later.
Can several supervisors enter data at the same time?
Yes, with the Google Sheets tools. The Manufacturing KPI Dashboard in Google Sheets and the Equipment Maintenance Management System web app are built for shared, multi-user entry. The Excel files work best with one owner who collects data from supervisors.
Can I customise the templates for my plant?
Yes. Formulas, KPI names, targets, dropdown lists and charts are all editable, and you own the files outright. Rename plants, lines and shifts, add your own defect types, or change machine lists. Being editable was a selection rule for every template in this stack.
Get more plant manager templates
Run the plant from numbers, not from memory. The Plant Production Manager Toolkit bundles nine premium Excel and Power BI manufacturing templates for $79.99 (save $52.92). Or start with the Manufacturing Dashboard in Excel for $17.99.
Watch demos of these dashboards on our NextGenTemplates YouTube channel, and browse more project management dashboard templates for your improvement projects.