

The best supply chain management tools for a supply chain manager who does not want another subscription are a stack of ten one-time templates: one to plan deliveries, four to track suppliers, stock and KPIs, two to report cost and performance, and three to present. Our top pick is the Supply Chain Management Dashboard in Excel ($17.99, paid once), with five pages for suppliers, warehouses, product categories and monthly trends.
Last updated: October 2026
Related guides: If you want the metrics before the tools, start with our 15 supply chain KPIs to track in 2026. This post is different: it is the working toolkit for the person who owns the whole chain, from supplier to customer, organised by the job each template does, with a 30-day rollout plan and the software each one can stand in for.
Key takeaways
- A supply chain manager needs four kinds of tool: plan, track, report and present. Ten templates cover all four for $196.90 in total, paid once, with no per-user fees.
- Best overall is the Supply Chain Management Dashboard in Excel ($17.99): supplier, warehouse, product category and monthly trend pages driven by pivot tables and slicers.
- Best value is the Supply Chain End-to-End Bundle: ten inventory, procurement, logistics and sales-purchase templates for $78.99 instead of $141.90 (44% off).
- On-time delivery, fill rate, perfect order rate, inventory turnover, days of inventory, freight cost per unit and supplier on-time rate are the core of a supply chain manager’s monthly report.
- Templates lose to planning software when you need multi-echelon optimisation, live EDI with hundreds of suppliers or statistical demand forecasting across thousands of SKUs. We say exactly when to buy software instead.
Supply chain management tools compared
All ten templates side by side, grouped by the job they do, with the kind of paid software each can stand in for. One is marked best overall and one best value.
| # | Template | Job | Format | Best for | What it replaces | Price |
|---|---|---|---|---|---|---|
| 1 | Supply Chain Management Dashboard in Excel (Best overall) | Report | Excel | Monthly supplier, warehouse and category review | A BI seat (Tableau, Power BI Pro) used only for the monthly pack | $17.99 |
| 2 | Supply Chain End-to-End Bundle (Best value) | All four | Excel + VBA + Google Sheets | Inventory, procurement, PO and logistics in one checkout | Entry-level inventory apps such as Cin7 or Fishbowl, plus a PO tool | $78.99 |
| 3 | Supply Chain Management Dashboard in Power BI | Present | Power BI | Interactive review with the operations director | A custom Power BI report build from a consultant | $17.99 |
| 4 | Supply Chain Procurement Dashboard in Google Sheets | Track | Google Sheets | Vendor spend, open and pending POs by department | Spend-analytics modules in procurement suites such as Coupa or Procurify | $9.99 |
| 5 | Supply Chain and Logistics Inventory Management KPI Dashboard in Excel | Track | Excel | Monthly inventory KPIs against target and last year | Inventory analytics add-ons | $14.99 |
| 6 | Supply Chain and Logistics Cost Efficiency KPI Dashboard in Excel | Report | Excel | Logistics cost KPIs, MTD and YTD, for finance | Cost dashboards inside freight or TMS software | $14.99 |
| 7 | Supply Chain – Logistics KPI Scorecard in Google Sheets | Track | Google Sheets | A shared traffic-light scorecard the whole team updates | Shared scorecard tools and Smartsheet dashboards | $9.99 |
| 8 | Supply Chain Analytics Dashboard in HTML | Present | HTML (browser) | A web-style dashboard for people who don’t open Excel | Hosted dashboard viewers billed per user | $14.99 |
| 9 | Supply Chain – Logistics KPI Dashboard in Power BI | Present | Power BI | Shipping, supplier and cost KPIs with drill-downs | Control-tower reporting screens (the reporting slice only) | $11.99 |
| 10 | Supply Chain Delivery Calendar in Excel | Plan | Excel | Inbound and outbound delivery dates across the year | Scheduling boards in Monday.com or Smartsheet | $4.99 |
How we picked these
We searched the full NextGenTemplates catalogue of Excel, Google Sheets, Power BI and HTML templates for anything a supply chain manager touches in a normal month. We kept a template only if it does one of the four jobs (plan, track, report, present) on its own, ships with editable formulas or a documented data sheet, and costs less than one month of the software it stands in for.
We left out industry-specific variants such as the farm, food and retail supply chain dashboards: they are good, but they are built for one sector. We also left out shop-floor tools. If you run the warehouse itself, the warehouse supervisor template stack is the better list, and if you run your own fleet, see the logistics dashboard templates.
What does a supply chain manager need templates for?
The supply chain manager sits between purchasing, the warehouse, transport and the customer. Their month repeats in a fairly fixed pattern: agree the supply plan, chase suppliers that are late or short, keep inventory high enough to ship and low enough to free cash, keep freight cost under budget, and explain all of it to the operations director and finance in one meeting.
Most supply chain managers try to run all of that in one giant workbook that only they understand. The stack approach gives each job its own tool, fed by the same purchase, stock and shipment exports. It is the same logic we used in the operations manager template stack and the plant manager template stack, applied to suppliers, stock and shipments.
- Plan: delivery dates, supplier windows and reorder timing (template 10, plus the reorder alerts inside the bundle in template 2).
- Track: purchase orders and vendors, inventory KPIs and a shared team scorecard (templates 4, 5 and 7).
- Report: supplier, warehouse and category performance, and logistics cost (templates 1 and 6).
- Present: interactive reviews for directors and anyone who prefers a browser (templates 3, 8 and 9).
The 10 best supply chain management tools for 2026
1. Supply Chain Management Dashboard in Excel: best overall
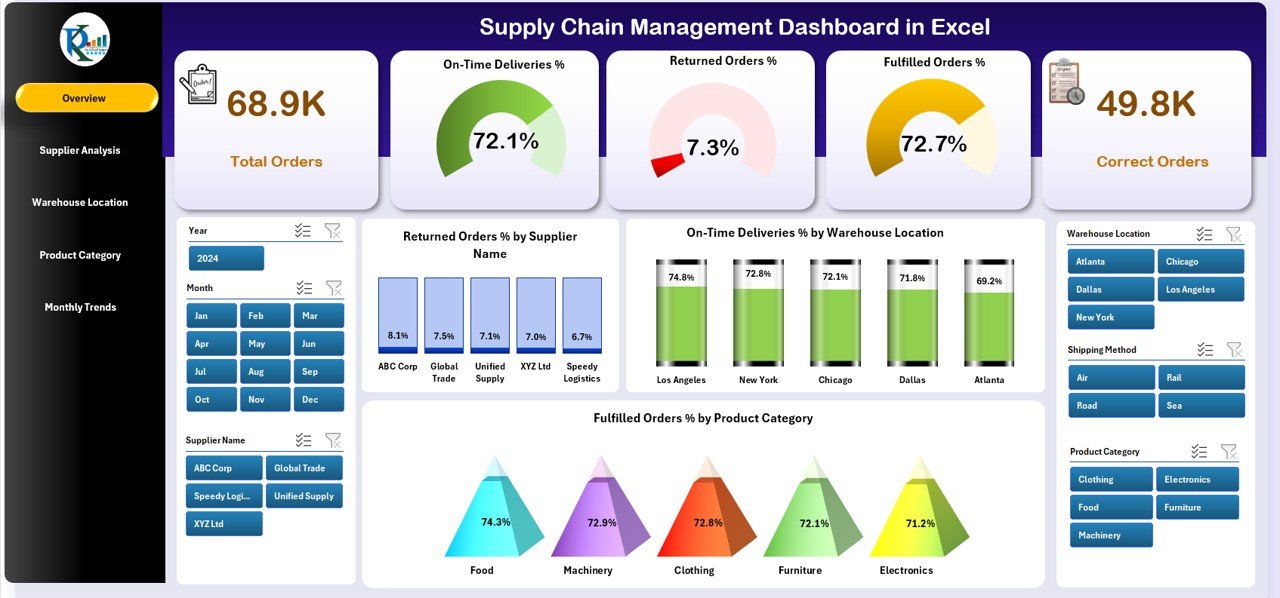
This is the monthly supply chain dashboard most managers try to build themselves and never finish. It has five analytical pages: Overview, Supplier Analysis, Warehouse Location Analysis, Product Category Analysis and Monthly Trends. The Overview page summarises total orders, fulfilled orders, return % and cost efficiency, so the first question in any review is answered before anyone asks it.
What is inside:
- A Supplier Analysis page with margin, availability % and cost versus revenue by supplier, so top and weak performers are obvious.
- A Warehouse Location Analysis page with orders, returns, on-time deliveries and fulfillment rates by site.
- A Product Category page for demand and availability, and a Monthly Trends page for seasonal patterns.
- Data and support sheets for entry and dropdown lists, with pivot tables, slicers and conditional formatting doing the work.
How supply chain managers use it: paste the month’s order and shipment export into the data sheet, refresh, and slice by supplier or warehouse. “Which supplier drove last month’s returns?” becomes one click instead of an afternoon of VLOOKUPs.
Why it is #1: it covers suppliers, sites and products in one file, in the format every finance and operations team already uses. No IT ticket, no licence, no data connector to configure.
Price: $17.99, one-time. Get the Supply Chain Management Dashboard in Excel. A Google Sheets edition ($9.99) exists for teams that work in the browser.
Best for: the monthly supply chain review owned by one manager.
2. Supply Chain End-to-End Bundle: best value
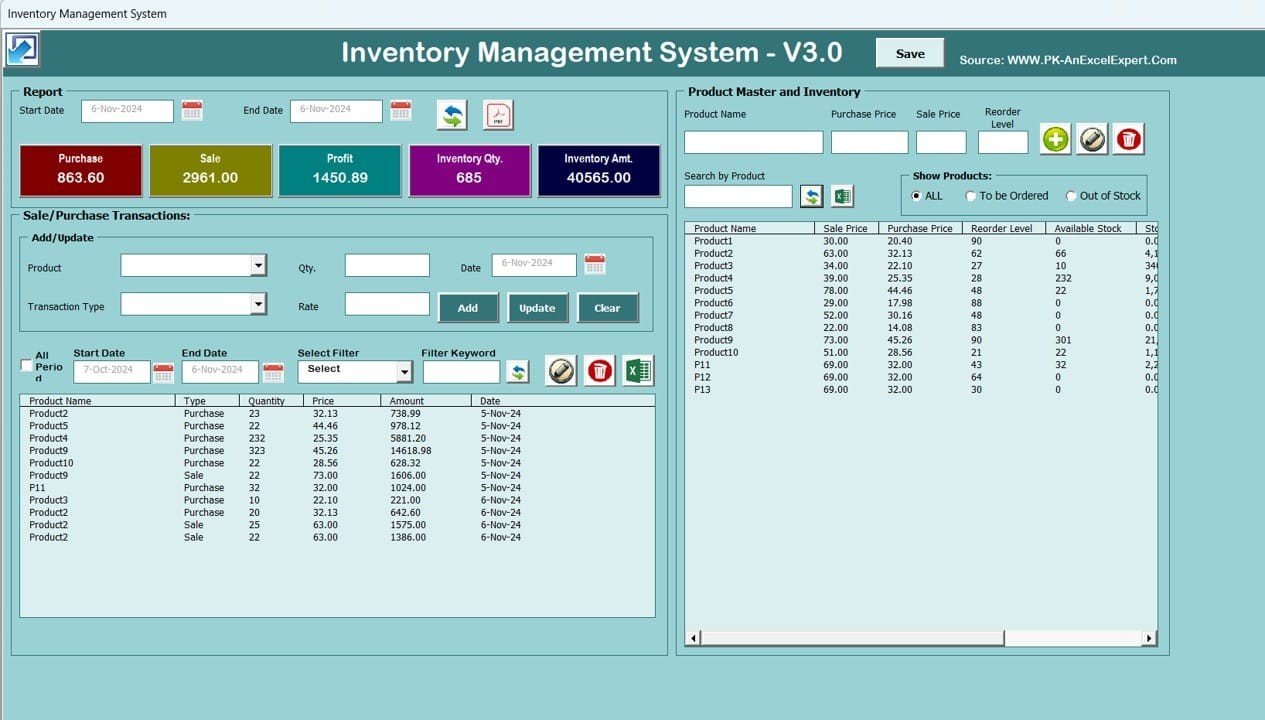
If you already know you need more than two tools, buy the bundle. It packs ten supply chain templates covering inventory, procurement, logistics and daily sales-purchase. Bought one by one they cost $141.90; the bundle is $78.99, a saving of $62.91, or 44%.
What is inside:
- Two VBA inventory systems (Inventory Management System V3.0 and Advanced Inventory Management System V1.0) with stock-in and stock-out forms, reorder alerts and a live summary dashboard, plus a userform-driven Inventory Management Form.
- Multi-location inventory tools in both Excel and Google Sheets, with per-location balances and consolidated totals.
- A Procurement Dashboard in Excel (spend by category, supplier performance, PO cycle time and savings), a Procurement Tracker and Dashboard in Google Sheets, and a Purchase Order Tracker in Google Sheets.
- A Transportation & Logistics Dashboard in Excel (freight cost, on-time delivery, carrier performance) and a Daily Sales Purchase Tracker V1.0.
How supply chain managers use it: run stock movements through one of the VBA systems, log every PO in the Google Sheets tracker so buyers update it from anywhere, and use the procurement and logistics dashboards for the monthly numbers. The bundle page itself names supply chain directors and operations VPs as the buyer.
Price: $78.99, one-time. Get the Supply Chain End-to-End Bundle.
Best for: a supply chain manager setting up stock, purchasing and logistics reporting from scratch.
3. Supply Chain Management Dashboard in Power BI
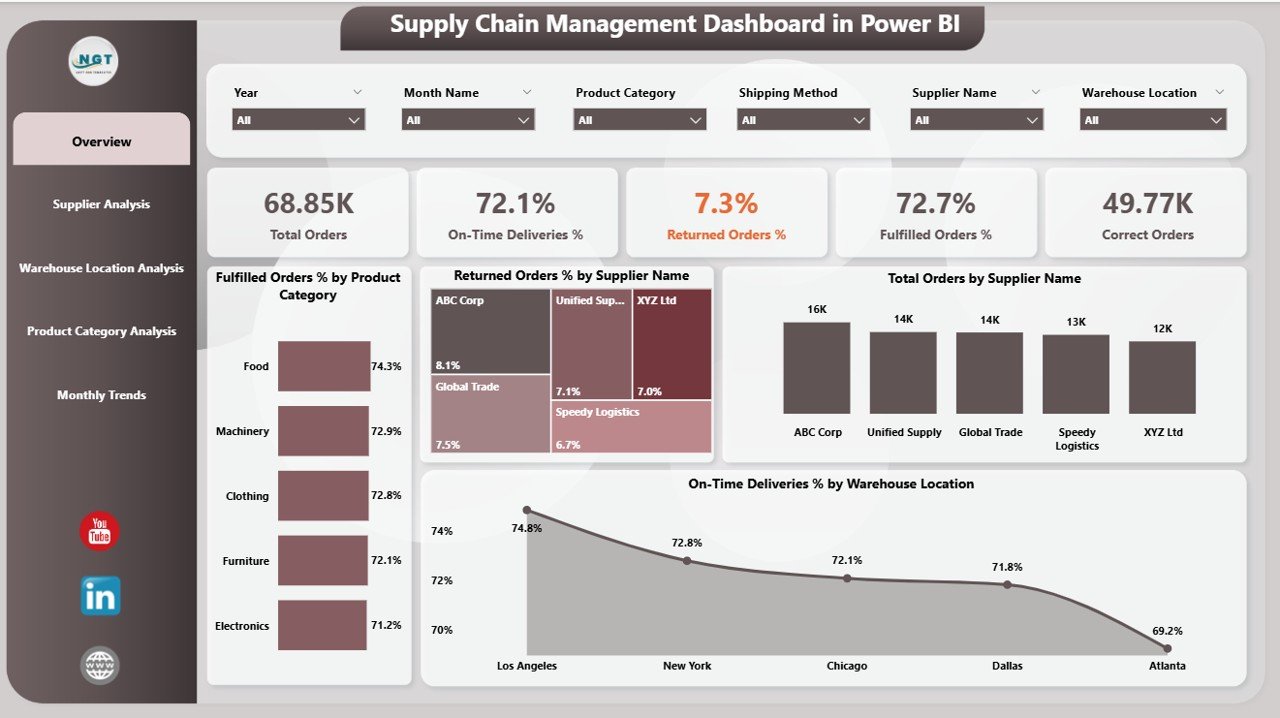
The Power BI twin of #1, for the meeting where your numbers meet the operations director. It runs on Excel data and has the same five layers: Overview, Supplier Analysis, Warehouse Location Analysis, Product Category Analysis and Monthly Trends.
What is inside:
- KPI cards for Total Orders, Fulfilled Orders, Return %, On-Time Delivery % and Correct Order %.
- Overview visuals for fulfilled order % by category, return order % by supplier and on-time deliveries % by warehouse location.
- A Supplier Analysis page comparing fulfilled, correct and on-time order % by supplier.
- Excel as the data source, so refreshing the report is a matter of updating one file.
How supply chain managers use it: present this instead of slides. When the director asks about one supplier or one site, click to it while everyone watches. Power BI Desktop is free; you only need a paid licence to publish and share online.
Price: $17.99, one-time. Get the Supply Chain Management Dashboard in Power BI. A separate Supply Chain Dashboard in Power BI ($17.99) is also available if you want a second layout.
Best for: monthly and quarterly reviews with leadership.
4. Supply Chain Procurement Dashboard in Google Sheets
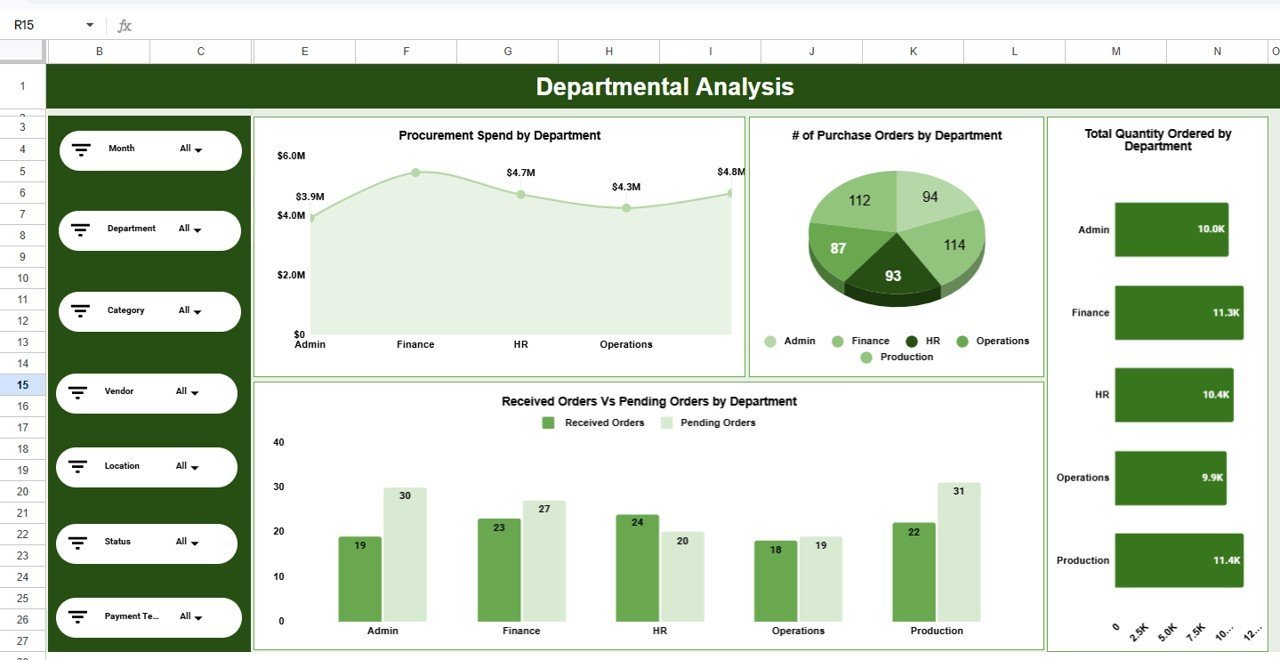
Late and short deliveries start with purchasing, so the supply chain manager needs to see the PO book, not just the stock. This Google Sheets dashboard tracks five KPI cards: number of purchase orders, total procurement spend, total quantity ordered, average vendor rating and pending orders.
What is inside:
- Five pages: Overview, Departmental Analysis, Vendor Analysis, Category & Item Insights, and Location & Payment Terms.
- 16+ charts that all follow the slicers for department, vendor, category, location and month.
- Received versus pending orders on every analysis page, so fulfilment gaps by vendor show up early.
- An editable data sheet with sample records; no add-ons or scripts, and setup takes under ten minutes.
How supply chain managers use it: share one link with the buyers. Before the weekly supplier call, filter to the vendor and show their pending orders by location. That is a better conversation than “you are always late”.
Price: $9.99, one-time. Get the Supply Chain Procurement Dashboard in Google Sheets. For Excel-based purchasing teams, compare the options in our procurement dashboard templates roundup.
Best for: tracking vendors and open POs with the buying team.
5. Supply Chain and Logistics Inventory Management KPI Dashboard in Excel
Inventory is where a supply chain manager’s decisions turn into cash. This is a supply chain KPI dashboard that compares each inventory and logistics KPI month-to-date and year-to-date against target and against the previous year.
What is inside:
- A seven-sheet system: Home, Dashboard, KPI Trend, Actual Numbers input, Target, Previous Year and KPI Definitions.
- A KPI Trend sheet: pick any KPI and see its MTD and YTD trend against target and last year.
- A KPI definitions sheet with the formula, unit and direction of each metric (upper-the-better or lower-the-better).
- Formulas and dropdowns only, with no coding, and navigation buttons between sheets.
How supply chain managers use it: enter the month’s actuals once, then read the arrows. Anything red against both target and last year goes on the agenda; everything else does not.
Price: $14.99, one-time. Get the Inventory Management KPI Dashboard. The same structure is available for quality assurance, revenue tracking and process improvement KPIs, $14.99 each.
Best for: monthly inventory performance against target.
6. Supply Chain and Logistics Cost Efficiency KPI Dashboard in Excel
Finance does not ask how many orders shipped; it asks what they cost. This dashboard tracks logistics and supply chain cost KPIs with MTD and YTD views, target versus actual, and previous-year comparison, in the same seven-tab layout as #5.
What is inside:
- A month dropdown that switches every MTD and YTD comparison, with up and down arrows and colour formatting.
- A fiscal start month you can change in one cell, so the YTD figures match your financial year.
- An editable KPI definition sheet, so you can add, remove or rename cost KPIs.
- Printable views for meetings and audits.
How supply chain managers use it: bring it to the monthly finance review. When freight or warehousing cost moves, the trend sheet shows whether it is a one-month spike or a six-month drift, which changes what you do about it.
Price: $14.99, one-time. Get the Cost Efficiency KPI Dashboard.
Best for: reporting logistics cost to finance.
Building supply chain reporting from zero? The Supply Chain End-to-End Bundle gives you ten inventory, procurement, PO and logistics templates for $78.99 instead of $141.90. One checkout, one download, no subscription.
7. Supply Chain – Logistics KPI Scorecard in Google Sheets
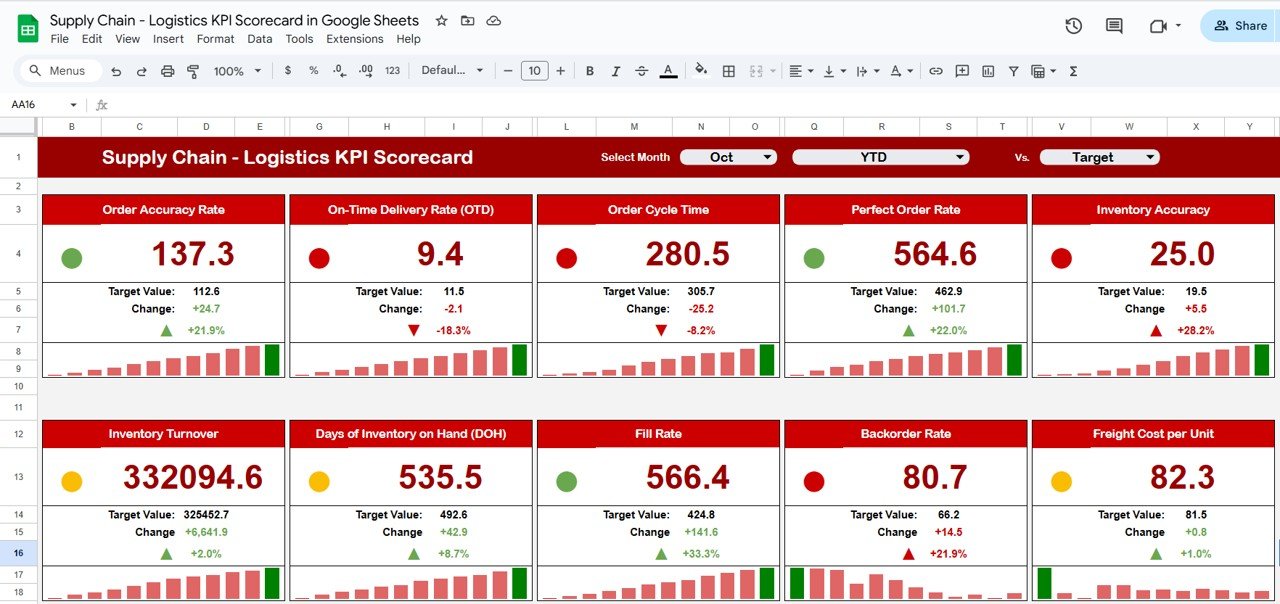
When the planners, buyers and the logistics coordinator all own a number, the scorecard has to live where they all can reach it. This Google Sheets scorecard shows the team’s logistics KPIs MTD and YTD with traffic-light indicators: green for good, yellow for average, red for needs attention.
What is inside:
- A dashboard driven by a month dropdown, with trend arrows and automatic calculations.
- A KPI Trend tab showing any KPI’s group, unit, formula, type and monthly trend.
- A KPI definition sheet to standardise how each metric is measured.
- Colour settings with editable thresholds, and real-time sharing through Google Sheets.
How supply chain managers use it: give each KPI an owner and a deadline for entering the month’s number. The traffic lights make the weekly stand-up short: talk only about the reds.
Price: $9.99, one-time. Get the Supply Chain – Logistics KPI Scorecard.
Best for: a shared team scorecard.
8. Supply Chain Analytics Dashboard in HTML
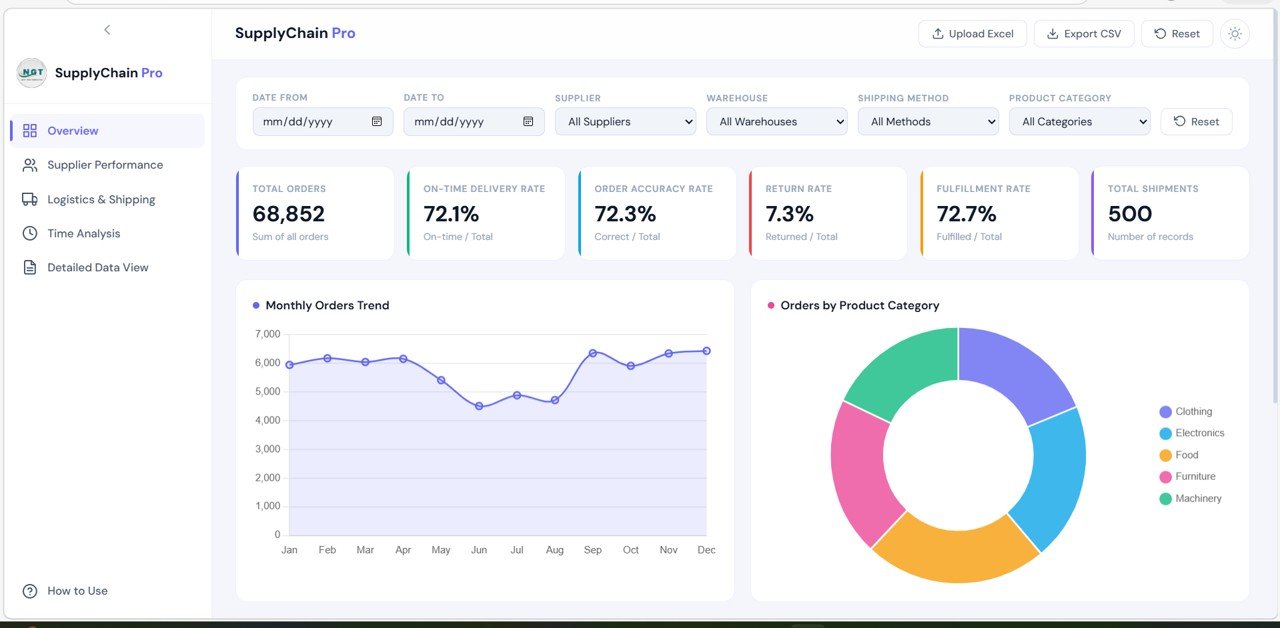
Some stakeholders will never open a spreadsheet. This dashboard runs in a web browser and looks like a SaaS product, but you own it. KPI cards cover Total Orders, On-Time Delivery Rate, Order Accuracy Rate, Return Rate, Fulfillment Rate and Total Shipments.
What is inside:
- An Overview page plus a Supplier Performance page with a supplier radar chart for delivery, accuracy and returns.
- A Logistics & Shipping page (orders by shipping method, warehouse fulfillment, category movement) and a Time Analysis page with monthly and quarterly trends.
- A detailed data view with search, sorting, pagination and CSV export.
- Real-time filters and a built-in user guide that explains the data structure and upload steps.
How supply chain managers use it: share it with sales or customer service, who want delivery performance without learning pivot tables. Upload the month’s data and they get a clean, clickable view.
Price: $14.99, one-time. Get the Supply Chain Analytics Dashboard in HTML.
Best for: stakeholders who prefer a browser to Excel.
9. Supply Chain – Logistics KPI Dashboard in Power BI

A lower-cost Power BI option focused on KPIs rather than the supplier and warehouse pages of #3. It covers shipping and delivery performance, inventory and turnover, supplier performance, order fulfillment and backlog, and logistics cost against budget.
What is inside:
- On-time delivery, shipping cost and transportation efficiency views.
- Stock levels, product turnover and order fulfillment rates.
- Supplier delivery accuracy, fulfillment rates and lead times.
- Logistics cost tracking (transport, warehousing, inventory) against budget, with filters and drill-downs.
How supply chain managers use it: use it as the KPI page of the quarterly business review, and drill from a red cost KPI straight into the month and category that caused it.
Price: $11.99, one-time. Get the Supply Chain – Logistics KPI Dashboard in Power BI.
Best for: a KPI-only Power BI view on a small budget.
10. Supply Chain Delivery Calendar in Excel
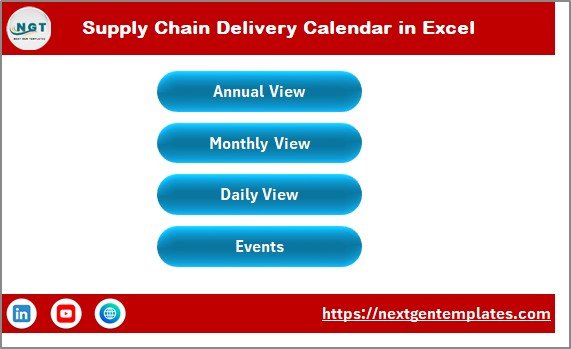
The cheapest tool in the stack, and the one that prevents the most avoidable surprises. It puts every inbound and outbound delivery on one calendar with Annual, Monthly and Daily views.
What is inside:
- Five worksheets, including a Home sheet with navigation buttons and Annual, Monthly and Daily views.
- An event manager to add, update or delete delivery records, stored in one central event database.
- Highlighting for key delivery days, plus year, month and starting-weekday controls.
- Several colour themes for presentation.
How supply chain managers use it: put supplier delivery days, customer ship dates, stock counts and holiday shutdowns on one calendar, and share it with the warehouse so labour is booked for the days trucks actually arrive.
Price: $4.99, one-time. Get the Supply Chain Delivery Calendar in Excel. For a one-off audit of your processes, the Supply Chain Management Checklist Template in Excel costs $3.49.
Best for: planning deliveries across the year.
The 30-day supply chain manager rollout plan
Don’t install ten tools in one week. Roll them out in the order the data flows, so each tool feeds the next one.
| Days | Tool | Goal by the end of the step |
|---|---|---|
| 1–3 | Supply Chain Delivery Calendar | Supplier delivery days, ship dates and shutdowns for the quarter on one calendar |
| 4–8 | Supply Chain Procurement Dashboard (or the PO tracker in the bundle) | All open POs loaded; buyers updating received and pending orders |
| 9–13 | Inventory system from the End-to-End Bundle | Items, locations and opening stock loaded; reorder alerts set |
| 14–17 | Inventory Management KPI Dashboard and Logistics KPI Scorecard | Targets and last year’s numbers entered; each KPI has an owner |
| 18–21 | Cost Efficiency KPI Dashboard | Logistics cost KPIs agreed with finance and the fiscal start month set |
| 22–26 | Supply Chain Management Dashboard in Excel | First monthly supplier, warehouse and category report |
| 27–30 | Power BI or HTML dashboard | First interactive review presented to the operations director |
Most of the time goes into cleaning supplier, item and location master data, not into configuring templates. Each single supply chain dashboard takes under an hour to set up once your export is ready.
Which KPIs should a supply chain manager track?
Ten to twelve KPIs are enough for a monthly report. The common definitions below follow the logic of the ASCM SCOR model, the industry reference for supply chain performance (reliability, responsiveness, cost and assets). Every template in this stack lets you edit the KPI list and targets.
| KPI | Formula | What it tells you |
|---|---|---|
| On-time delivery (OTD) | Orders delivered by the promised date ÷ total orders delivered | Whether customers get what was promised, when it was promised |
| Perfect order rate | Orders on time, complete, undamaged and correctly invoiced ÷ total orders | End-to-end reliability in one number |
| Fill rate | Units shipped from stock ÷ units ordered | How often stock was there when demand arrived |
| Supplier on-time rate | Supplier deliveries on or before due date ÷ total supplier deliveries | Which vendors put your service level at risk |
| Purchase order cycle time | Average days from PO creation to goods received | How long the buying process really takes |
| Inventory turnover | Cost of goods sold ÷ average inventory value | How fast stock turns into sales |
| Days of inventory on hand | Average inventory value ÷ (COGS ÷ 365) | How many days of demand are sitting in the building |
| Freight cost per unit | Total freight cost ÷ units shipped | Whether transport cost is rising faster than volume |
| Logistics cost as % of sales | Transport + warehousing + inventory carrying cost ÷ revenue | The headline number finance watches |
| Return rate | Orders returned ÷ orders delivered | Quality and picking problems that reach the customer |
For the full list of definitions and targets, read our guide to supply chain KPIs to track in 2026. Plant-side metrics such as OEE and scrap are covered in our manufacturing dashboard templates post.
How to choose between them
- You need one supply chain dashboard by Friday: start with the Supply Chain Management Dashboard in Excel ($17.99).
- You are building stock, purchasing and logistics reporting from nothing: buy the Supply Chain End-to-End Bundle ($78.99).
- Your director lives in Power BI: the Supply Chain Management Dashboard in Power BI ($17.99), or the KPI-only version for $11.99.
- Late suppliers are your biggest problem: the Supply Chain Procurement Dashboard in Google Sheets ($9.99).
- Finance keeps asking about cost: the Cost Efficiency KPI Dashboard ($14.99).
- Several people own the numbers: the Logistics KPI Scorecard in Google Sheets ($9.99).
If you manage the warehouse rather than the whole chain, also look at our Excel inventory management tools for warehouse managers.
When a template is NOT the right answer
Templates are the right supply chain management tools for most small and mid-sized businesses, but not for every operation. Buy dedicated software instead when:
- You need statistical demand forecasting at scale. Forecasting thousands of SKUs by location with automatic model selection is planning-software territory.
- You need multi-echelon inventory optimisation. Setting safety stock across plants, regional DCs and stores at once needs a solver, not a spreadsheet.
- You exchange EDI with hundreds of suppliers. Automated ASNs, invoices and order confirmations belong in an ERP or supplier portal.
- Many people must transact at the same moment. If dozens of users post receipts and shipments in real time, you need a database-backed ERP or WMS.
Even then, many supply chain teams keep Excel or Power BI dashboards on top of the ERP, because they are faster to change than the ERP’s own reports. That reporting layer is exactly where templates 1, 3, 6 and 9 fit.
Frequently asked questions
What are the best supply chain management tools for a small team?
For a small team, the Supply Chain Management Dashboard in Excel ($17.99) is our top pick because it covers suppliers, warehouses, product categories and monthly trends in one file. For a complete set, the Supply Chain End-to-End Bundle gives you ten inventory, procurement and logistics templates for $78.99.
What should a supply chain manager dashboard show?
A supply chain manager dashboard should show on-time delivery, fill rate, fulfilled and returned orders, supplier performance, inventory turnover or days on hand, and logistics cost. Add filters for supplier, warehouse, product category and month, so each question in a review can be answered with one click.
Can Excel replace supply chain software?
For reporting, tracking and simple inventory control, often yes. The templates here handle dashboards, KPIs, purchase orders, stock and delivery calendars. Excel does not replace an ERP or planning system for statistical forecasting at scale, multi-echelon optimisation, EDI with many suppliers or many simultaneous users.
Is Excel, Google Sheets or Power BI better for supply chain dashboards?
Excel is best for the monthly report one manager owns. Google Sheets is best when buyers, planners and coordinators all enter data on one shared link. Power BI is best for interactive reviews with leadership. Many supply chain teams use all three: Sheets for entry, Excel for analysis and Power BI to present.
How much does the full supply chain template stack cost?
All ten templates cost $196.90 in total, paid once. The nine single templates come to $117.91, and the Supply Chain End-to-End Bundle is $78.99. There are no per-user fees and no renewals. Most supply chain managers start with two or three tools and add the rest as each one proves useful.
Do I need Power BI Pro to use the Power BI templates?
No. Power BI Desktop is free, and you can open, edit and present both Power BI dashboards in it. You only need a paid Power BI licence if you want to publish the report to the Power BI service and share it online with colleagues who don’t have the file.
Which supply chain KPIs matter most?
Start with on-time delivery, perfect order rate, fill rate, supplier on-time rate, inventory turnover, days of inventory on hand, freight cost per unit and logistics cost as a percentage of sales. Ten to twelve KPIs make a readable monthly report; more than that and nobody reads past the first page.
How do you calculate inventory turnover?
Divide cost of goods sold for the period by the average inventory value for the same period. If annual COGS is $1.2 million and average inventory is $200,000, turnover is 6, which means stock turns roughly every 61 days. The inventory KPI dashboard in this stack tracks it against target and last year.
Can I customise these supply chain templates?
Yes. Formulas, KPI names, targets, dropdown lists and charts are editable, and you own the files outright. Rename suppliers, warehouses and categories, add your own KPIs and change the targets. Being editable was a selection rule for every template in this supply chain stack.
Get more supply chain templates
Run the chain from numbers, not from memory. The Supply Chain End-to-End Bundle packs ten inventory, procurement and logistics templates for $78.99 (save $62.91). Or start with the Supply Chain Management Dashboard in Excel for $17.99.
Watch demos of these dashboards on our NextGenTemplates YouTube channel, and see the metrics behind them in our supply chain KPIs guide.