

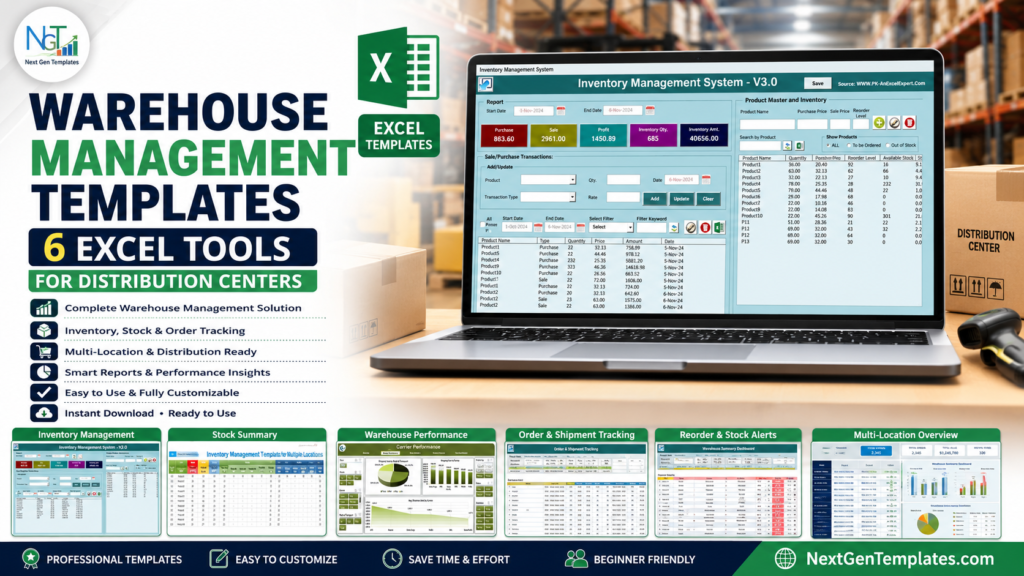
Warehouse management templates help distribution centers improve inventory accuracy, freight visibility, procurement control, and weekly reporting without waiting for a full warehouse management system rollout. The U.S. Census Bureau estimated U.S. retail e-commerce sales at $326.7 billion in the first quarter of 2026, equal to 16.9% of total retail sales. That volume eventually becomes receipts, picks, transfers, shipments, returns, purchase orders, and carrier invoices that warehouse teams must control.
For many small and mid-sized distribution centers, a full WMS can be too heavy for the first step. Excel warehouse management templates can close the gap quickly. They give managers a structured way to track stock, compare locations, monitor freight costs, review vendor performance, and explain operational issues without waiting months for a software rollout.
Key Features of Warehouse Management Templates
The best warehouse management templates do more than store rows of data. They turn daily activity into operational control. Look for tools that support product masters, stock in and stock out entries, reorder alerts, transfers, purchase tracking, shipment analysis, vendor scorecards, carrier performance, route views, and executive-ready dashboards.
Excel is especially useful when teams already collect warehouse data in CSV exports, ERP downloads, carrier reports, barcode logs, purchase order trackers, or manual receiving sheets. A well-built template gives that data a consistent structure, then uses formulas, PivotTables, slicers, VBA forms, and dashboard visuals to make the operation easier to review. Microsoft also notes that PivotTables help calculate, summarize, and analyze data, which is why they remain practical for distribution reporting.
 Launch offer
SUMIFS, XLOOKUP, FILTER, LAMBDA and checking AI-written formulas, with real business projects. 11h 47m of video by PK, with practice files, quizzes and a capstone.
Dashboard Pages and Operational Coverage
These six Excel tools cover the main layers of a distribution center: inventory control, multi-location stock visibility, advanced replenishment, transportation performance, freight cost analysis, and procurement spending.
1. Inventory Management System V3.0
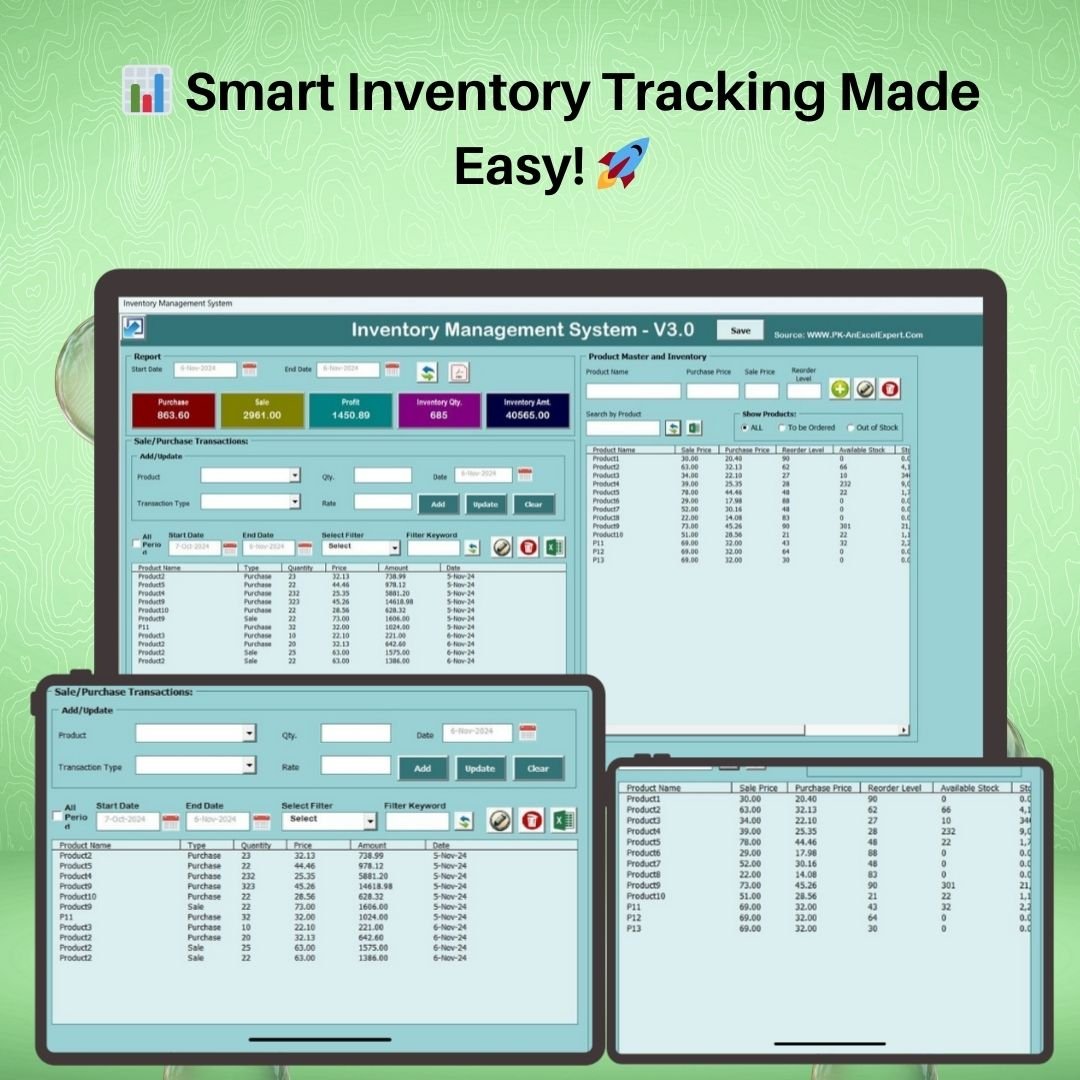
The Inventory Management System V3.0 is a VBA-powered Excel tool for tracking products, purchases, sales, stock adjustments, reorder levels, and PDF-ready reports. It is a strong fit when a warehouse needs a controlled inventory workflow but still wants the flexibility of Excel.
View Inventory Management System V3.0
2. Inventory Management Template for Multiple Locations
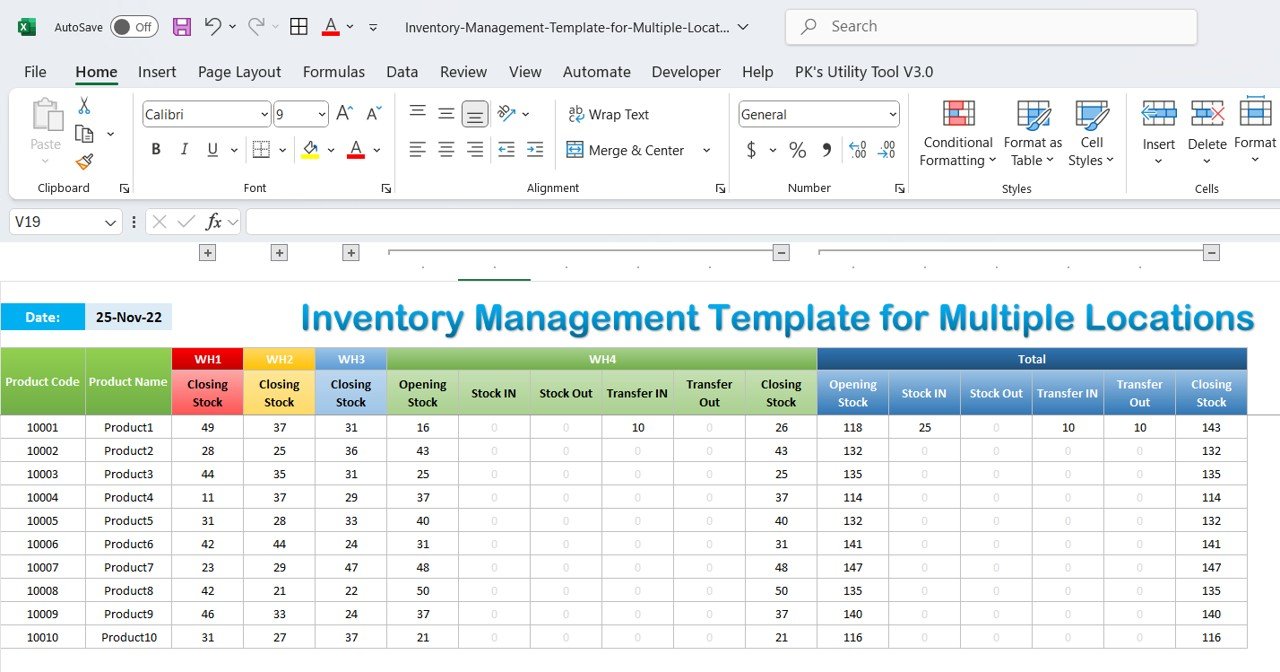
The Inventory Management Template for Multiple Locations is useful for distribution centers that split stock across branches, warehouses, retail points, or regional storage rooms. It helps track stock in, stock out, transfers, and location-level reports in one workbook.
View the Multi-Location Inventory Template
3. Advanced Inventory Management System V1.0
The Advanced Inventory Management System V1.0 supports deeper stock control, order management, replenishment alerts, barcode-oriented workflows, and inventory analytics. Use it when the business has outgrown a simple stock list and needs stronger operational checks.
View Advanced Inventory Management System V1.0
4. Transportation and Logistics Dashboard in Excel
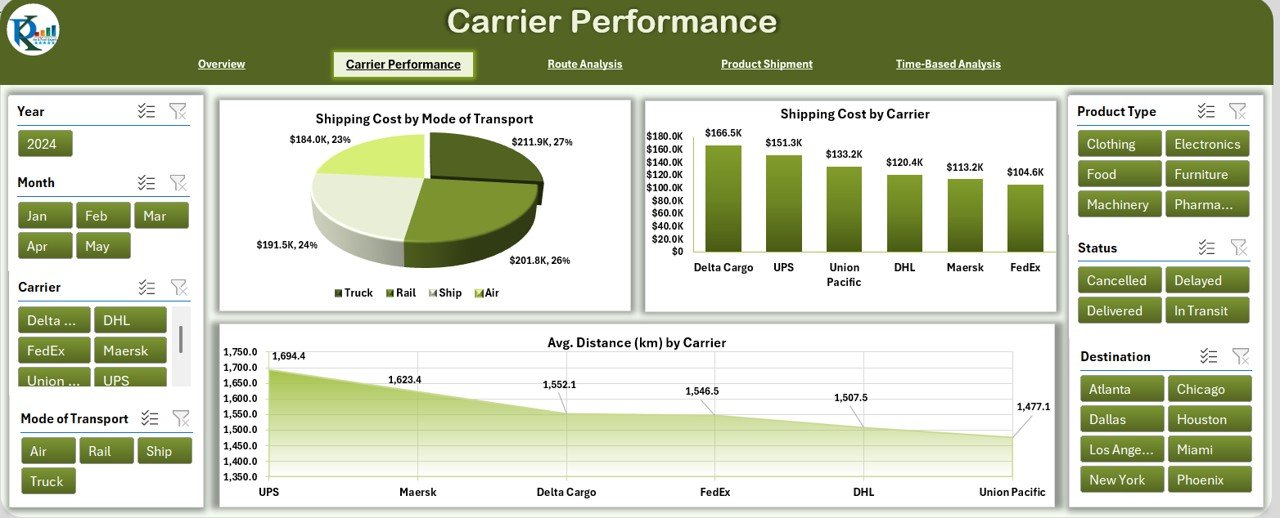
The Transportation and Logistics Dashboard in Excel includes dashboard pages for overview reporting, carrier performance, route analysis, product shipment analytics, and time-based analysis. It is ideal when warehouse managers need to connect outbound movement with cost, service, and delivery performance.
View the Transportation and Logistics Dashboard
5. Freight Cost KPI Dashboard in Excel
The Freight Cost KPI Dashboard in Excel focuses on freight spend, shipment cost, carrier comparison, delivery time, mode analysis, and trend monitoring. It is practical for distribution centers that want to see where freight cost is rising before it becomes a margin problem.
View the Freight Cost KPI Dashboard
6. Procurement Cost Analysis Dashboard in Excel
The Procurement Cost Analysis Dashboard in Excel helps analyze purchase orders, supplier spend, vendor ratings, pending orders, department costs, categories, locations, and payment terms. It gives warehouse and procurement teams a shared view of what is being purchased, from whom, and at what cost.
View the Procurement Cost Analysis Dashboard
Warehouse Management Templates vs. DIY Spreadsheets vs. Paid WMS – Feature Comparison
| Requirement | Excel warehouse templates | DIY spreadsheet | Paid WMS or SaaS |
|---|---|---|---|
| Setup speed | Fast, with ready sheets and dashboards | Slow, because structure must be built | Depends on implementation scope |
| Cost control | Low one-time template cost | Low software cost, high internal time cost | Subscription, onboarding, and configuration costs |
| Inventory visibility | Strong for small and mid-sized operations | Inconsistent unless maintained carefully | Strong when fully implemented |
| Customization | High, because the workbook can be adapted | High, but error-prone | Limited by platform rules and plan level |
| Analytics | Dashboards, KPIs, slicers, and reports | Usually manual charts | Advanced, often with additional modules |
| Best fit | Practical warehouse control without enterprise complexity | Very small teams with simple needs | Large operations with scanning, integrations, and IT support |
Who Should Use These Excel Tools
These templates are a good fit for warehouse managers, distribution center supervisors, inventory controllers, logistics coordinators, procurement teams, operations analysts, and small business owners who need better visibility without a large software project. They are also useful for consultants who need a quick reporting layer while documenting a client process.
If you supervise a shift rather than manage the whole building, see the warehouse supervisor template stack, which adds a 30-day rollout plan and a shift-level KPI table.
Real-World Use Cases
A distribution center can use the inventory system to manage daily stock movement, then use the multi-location template to compare availability across branches. The logistics dashboard can show which carriers are missing delivery targets, while the freight dashboard highlights expensive lanes or shipment modes. The procurement dashboard adds another layer by showing supplier costs, pending purchase orders, and vendor performance.
Together, these tools create a practical operating pack: stock control for the floor, transportation analysis for outbound shipments, cost visibility for finance, and procurement reporting for replenishment decisions.
Warehouse KPIs to Review Every Week
Use these templates to build a weekly review rhythm. Start with inventory accuracy, stockout count, negative stock lines, reorder items, transfer delays, inventory value by location, and slow-moving items. Then add on-time shipment rate, freight cost per shipment, carrier delay count, route cost trends, pending purchase orders, supplier rating, purchase spend by category, and late supplier deliveries.
The value is not only the dashboard view. The real value is the question each metric triggers: which item is creating stockouts, which location is overstocked, which carrier is becoming expensive, and which supplier is slowing replenishment?
How to Choose the Right Starting Template
If stock accuracy is the main issue, start with Inventory Management System V3.0 or Advanced Inventory Management System V1.0. If the operation has several warehouses, choose the multi-location inventory template first. If shipping cost or delivery service is the problem, begin with the transportation dashboard or freight KPI dashboard. If purchasing is creating delays, excess stock, or cost surprises, start with procurement cost analysis.
The bundle makes sense when the warehouse team wants one connected supply chain reporting pack instead of buying separate tools one at a time. It gives managers a broader view across inventory, logistics, procurement, shipment activity, and cost control.
Advantages of Using Excel Warehouse Management Templates
The main advantage is speed. A warehouse team can start with familiar Excel skills, import existing records, and begin reviewing KPIs quickly. The second advantage is transparency. Managers can inspect formulas, edit tables, add fields, and adapt views to the way their operation actually works. The third advantage is affordability. Instead of paying for a full platform before the process is stable, teams can standardize the basics first.
Opportunities for Improvement
Excel templates are not a replacement for every warehouse system. High-volume operations with live scanning, handheld devices, automated putaway, EDI, slotting optimization, or real-time ERP integration may eventually need a dedicated WMS. The opportunity is to use Excel as a controlled bridge: clean the data, define KPIs, identify weak processes, and prepare the business for a stronger system later.
Best Practices
Start with a clean product master and consistent location codes. Separate raw transactions from dashboards. Protect formula sheets, refresh PivotTables on a schedule, and keep one owner responsible for version control. Review negative stock, delayed transfers, late deliveries, high freight costs, and overdue purchase orders every week. For distribution centers with several sites, agree on one item naming standard before combining location reports.
Explore Relevant Templates
If you want the fastest starting point, review the Supply Chain End-to-End Bundle. It combines multiple Excel and Google Sheets tools for inventory, logistics, procurement, shipment, and supply chain reporting. You can also browse product tutorials and template walkthroughs on the NextGenTemplates YouTube channel.
Frequently Asked Questions
What are warehouse management templates?
Warehouse management templates are prebuilt spreadsheets or dashboards used to track inventory, stock movement, locations, purchase orders, freight costs, shipments, and warehouse KPIs.
Can Excel handle distribution center inventory?
Yes, Excel can handle distribution center inventory when the process is structured, the data volume is reasonable, and the workbook uses clear product, location, transaction, and reporting tables.
Which template should I start with?
Start with an inventory management template if stock accuracy is the main issue. Start with logistics or freight dashboards if delivery performance and cost control are the biggest pain points.
Do these templates replace a WMS?
They can replace manual spreadsheets for smaller teams, but they do not replace a full WMS when a business needs live scanning, automated integrations, complex warehouse workflows, or real-time ERP synchronization.
Are these templates useful for multiple warehouses?
Yes. The multi-location inventory template is designed for stock visibility across different warehouses, branches, or storage locations.
About the Author
Built by PK – Microsoft Certified Professional with 15+ years of Excel, Google Sheets, and Power BI experience. Founder of NextGenTemplates, reaching 300K+ subscribers across YouTube channels. Every template is hand-built and tested before release.
Conclusion
Warehouse management templates give distribution centers a practical way to improve inventory accuracy, logistics visibility, freight cost control, and procurement reporting. Start with the template that matches your biggest bottleneck, then build a connected operating pack as your warehouse process matures.
Once these tools are in place, track performance against the 10 warehouse KPIs to track in 2026 so you can see whether distribution-centre efficiency is actually improving.