


The 10 recruitment KPIs to track in 2026 are time to hire, time to fill, cost per hire, offer acceptance rate, application completion rate, quality of hire, source of hire effectiveness, recruiter productivity, pipeline conversion (selection ratio) and first-year new-hire turnover. Each has a simple formula and a benchmark range, and eight ready-made NGT dashboard templates (from $9.99) calculate them automatically.
Last updated: September 2026
Key takeaways
- The average cost per hire is roughly $4,700 and the average time to fill is about 36–44 days (SHRM / LinkedIn benchmarking) — track both monthly or you cannot tell if hiring is getting cheaper or slower.
- A healthy offer acceptance rate is 85–90%+; anything under 80% usually means slow decisions or below-market pay, not bad candidates.
- Measure quality of hire and first-year turnover, not just speed — a fast, cheap hire that quits in six months is the most expensive hire you will make.
- The Recruitment KPI Scorecard in Excel ($14.99) tracks all 10 recruitment KPIs against targets with traffic-light flags — our best overall pick.
- The Recruitment Pipeline Dashboard in Google Sheets ($9.99) is the cheapest way to start; the Recruitment & Talent Acquisition Bundle ($35.99, 7 templates) is the best value for full coverage.
The 10 recruitment KPIs at a glance
| Recruitment KPI | Formula | Benchmark range | Where to see it |
|---|---|---|---|
| 1. Time to hire | Days from candidate entering pipeline to offer accepted | ~3–4 weeks (median 23–30 days) | Funnel / pipeline dashboard |
| 2. Time to fill | Days from requisition approved to offer accepted | ~36–44 days | Pipeline dashboard |
| 3. Cost per hire | (Internal + external recruiting costs) ÷ number of hires | ~$4,000–$4,700 | KPI scorecard |
| 4. Offer acceptance rate | Offers accepted ÷ offers extended × 100 | 85–90%+ | KPI scorecard / pipeline |
| 5. Application completion rate | Completed applications ÷ started applications × 100 | 40–60%+ | Application management system |
| 6. Quality of hire | Composite: 1-yr performance + ramp + retention | >80% meeting expectations | KPI scorecard |
| 7. Source of hire effectiveness | Hires per channel ÷ total hires; cost per channel | Referrals usually highest quality | Pipeline / agency dashboard |
| 8. Recruiter productivity | Number of hires ÷ number of recruiters per period | Varies by role complexity | Agency dashboard |
| 9. Pipeline conversion (selection ratio) | Candidates advancing ÷ candidates at prior stage × 100 | Interview-to-offer ~40–60% | Funnel dashboard |
| 10. First-year new-hire turnover | New hires who left within 12 months ÷ new hires × 100 | <15–20% | KPI scorecard |
The 8 dashboard templates compared
| Template | Format | Best for | Price |
|---|---|---|---|
| Recruitment KPI Scorecard in Excel — Best overall | Excel | Tracking all 10 KPIs vs targets | $14.99 |
| Recruitment Funnel KPI Dashboard in Excel | Excel | Stage-by-stage funnel conversion | $12.99 |
| Recruitment Pipeline Dashboard in Power BI | Power BI | Interactive pipeline & source analysis | $17.99 |
| Recruitment Pipeline Dashboard in Google Sheets — Cheapest | Google Sheets | Free-tool teams starting out | $9.99 |
| Recruitment & Talent Acquisition Bundle — Best value | Excel + Sheets | Full-stack coverage (7 templates, save 37%) | $35.99 |
| Candidate Application Management System | Excel VBA | Capturing & tracking applicants | $19.99 |
| Recruitment Agencies Dashboard in Power BI | Power BI | Agencies with client/placement views | $17.99 |
| Recruitment Agencies Dashboard in Excel | Excel | Agencies on Excel | $13.99 |
How we picked these
We searched the full NextGenTemplates catalog of 300+ Excel, Google Sheets and Power BI templates for tools that calculate the 10 recruitment KPIs above rather than just list job openings. We kept templates that expose formulas you can audit, map cleanly to at least one KPI in the table, and cover all three formats so teams can self-select. We excluded generic HR trackers with no metric layer and any template that could not show a benchmark or target against actuals.
The 10 recruitment KPIs, explained
Each KPI below gives you a one-sentence definition, the exact formula, a realistic 2026 benchmark range, and the single mistake most teams make with it.
1. Time to hire
Definition: the number of days from a candidate first entering your pipeline (application or sourcing) to accepting your offer. It measures candidate experience and process speed.
Formula: Time to hire = Date offer accepted − Date candidate entered pipeline, averaged across hires.
Benchmark: around 3–4 weeks; a median of 23–30 days is competitive for most non-executive roles.
Common mistake: confusing time to hire with time to fill. Time to hire starts the clock when a specific candidate appears; time to fill starts when the requisition opens. Reporting one as the other hides weeks of sourcing lag.
2. Time to fill
Definition: the number of days from a job requisition being approved to the day an offer is accepted. It is the metric hiring managers actually feel.
Formula: Time to fill = Date offer accepted − Date requisition approved.
Benchmark: roughly 36–44 days on average across industries (SHRM and LinkedIn benchmarking), longer for senior or specialised roles.
Common mistake: reporting a single blended average. Segment by role family and seniority — a 40-day blended figure can hide a 90-day engineering bottleneck.
3. Cost per hire
Definition: the total recruiting spend required to fill a role, including both internal and external costs.
Formula: Cost per hire = (Internal recruiting costs + External recruiting costs) ÷ Total number of hires.
Benchmark: the widely cited SHRM average is about $4,700 per hire; many roles land in the $4,000–$4,700 band.
Common mistake: counting only agency fees and job-board spend while ignoring internal costs — recruiter salaries, referral bonuses and technology. Leaving those out makes cost per hire look artificially low.
4. Offer acceptance rate
Definition: the share of extended offers that candidates accept. It is an early-warning signal for pay, speed and candidate experience.
Formula: Offer acceptance rate = (Offers accepted ÷ Offers extended) × 100.
Benchmark: 85–90% or higher is healthy; consistently below 80% points to slow decisions or below-market compensation.
Common mistake: not capturing decline reasons. Without a structured reason field you cannot tell whether you are losing candidates to salary, timing or a competing offer.
5. Application completion rate
Definition: the percentage of candidates who finish an application after starting it — a direct read on how much friction your apply flow creates.
Formula: Application completion rate = (Completed applications ÷ Started applications) × 100.
Benchmark: 40–60%+ is reasonable; long forms and non-mobile flows push it far lower.
Common mistake: ignoring the mobile funnel. A large share of candidates apply on a phone, and desktop-only optimisation quietly kills completion.
6. Quality of hire
Definition: a composite measure of how well new hires perform and stay, judged after they start rather than at offer stage.
Formula: Quality of hire = average of (first-year performance rating + ramp-to-productivity + retention), often expressed as the % of new hires meeting expectations at 12 months.
Benchmark: aim for 80%+ of new hires meeting or exceeding performance expectations at one year.
Common mistake: measuring only at the point of hire. Quality of hire is a post-hire metric; if you stop tracking after the start date you are guessing.
7. Source of hire effectiveness
Definition: which channels — referrals, job boards, agencies, careers site, LinkedIn — actually produce hires, and at what cost and quality.
Formula: Source effectiveness = Hires from a channel ÷ Total hires (paired with cost per hire and first-year retention by channel).
Benchmark: employee referrals typically deliver the highest quality and retention per dollar; no single channel wins for every role.
Common mistake: ranking channels by applicant volume. A board that floods you with 500 unqualified applicants is worse than a referral channel that sends five hires.
8. Recruiter productivity
Definition: how many hires each recruiter closes in a period, used for capacity planning and workload balancing.
Formula: Recruiter productivity = Number of hires ÷ Number of recruiters (per month or quarter).
Benchmark: highly role-dependent — high-volume retail recruiting supports far more hires per recruiter than executive search.
Common mistake: comparing recruiters without adjusting for requisition complexity. Twelve warehouse hires and two VP hires are not the same workload.
9. Pipeline conversion (selection ratio)
Definition: the rate at which candidates advance from one stage to the next — applied, screened, interviewed, offered, hired.
Formula: Stage conversion = (Candidates advancing to next stage ÷ Candidates at current stage) × 100.
Benchmark: interview-to-offer conversion commonly sits around 40–60%; top-of-funnel screen rates are much lower.
Common mistake: only watching top-of-funnel volume. A big applicant pool means nothing if your interview-to-offer stage leaks.
10. First-year new-hire turnover
Definition: the share of new hires who leave within their first 12 months — the truest test of whether your other KPIs are producing good hires.
Formula: First-year turnover = (New hires who left within 12 months ÷ Total new hires in the period) × 100.
Benchmark: keep it under 15–20%; higher rates usually trace back to weak quality-of-hire or misleading sourcing.
Common mistake: not linking turnover back to source of hire and quality of hire. Turnover is a downstream symptom — analyse it against the channels and roles that produced those hires.
The 8 ready-made recruitment KPI dashboard templates
Every metric above is only useful if something calculates it for you each week. These eight NextGenTemplates tools already do — ranked with our reasoning, in Excel, Google Sheets and Power BI so you can match your stack.
1. Recruitment KPI Scorecard in Excel — best overall
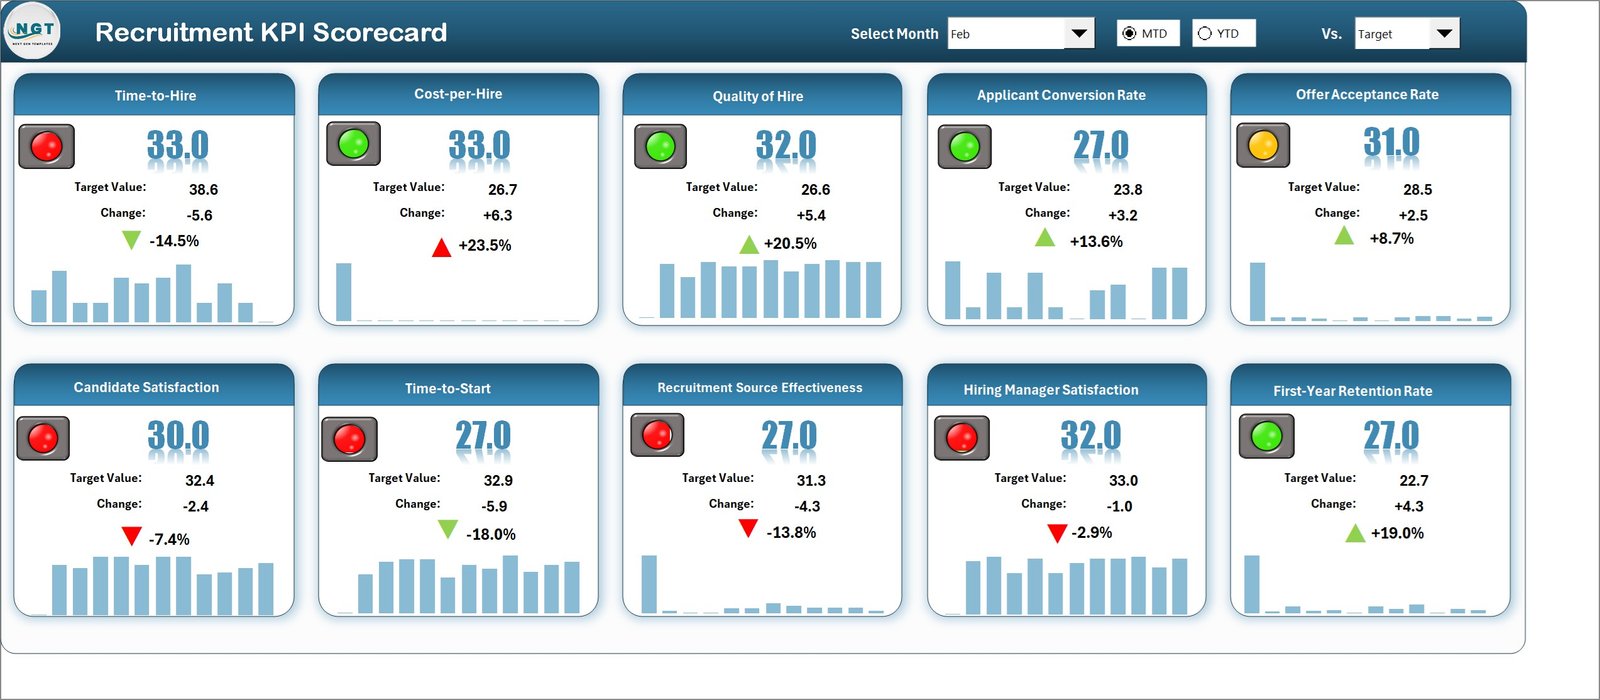
What it is: a single Excel scorecard that tracks your recruitment KPIs against targets with month-to-date and year-to-date views and traffic-light flags. Who it is for: HR and TA leads who want one page for the whole funnel.
- Pre-built rows for cost per hire, time to fill, offer acceptance, quality of hire and turnover
- Target vs actual with red/amber/green status
- Trend sparklines so you see direction, not just this month’s number
- Editable benchmark column — drop in the ranges from the table above
Use it to run a monthly hiring review: if cost per hire drifts above $4,700 or offer acceptance falls below 85%, the flag turns red before the quarter is lost. Price: $14.99. Get the Recruitment KPI Scorecard in Excel.
Best for: tracking all 10 recruitment KPIs on one page against benchmarks.
2. Recruitment Funnel KPI Dashboard in Excel

What it is: a funnel-first Excel dashboard that shows stage-by-stage conversion from applications received to hires made, with MTD and YTD actual-vs-target columns. Who it is for: teams whose problem is a leaking pipeline, not volume.
- Applications → screened → interviewed → offers → hires conversion
- Selection ratios and offer acceptance built in
- Cost per hire and recruiter productivity rows
- Month picker to compare periods
This is the fastest way to see where candidates drop out — pipeline conversion (KPI #9) is the whole point of the layout. Price: $12.99. Get the Recruitment Funnel KPI Dashboard.
Best for: diagnosing stage-by-stage funnel leaks.
3. Recruitment Pipeline Dashboard in Power BI

What it is: an interactive Power BI report for the full recruitment pipeline with slicers for role, source and recruiter. Who it is for: data teams and larger TA functions already on Power BI.
- Drill-through from source of hire to individual requisitions
- Time to hire and time to fill by role family
- Source-effectiveness visuals for channel decisions
- Refreshable from your ATS export
Because it is interactive, one report answers “which source fills senior roles fastest?” without rebuilding anything. Price: $17.99. Get the Recruitment Pipeline Dashboard in Power BI.
Best for: interactive pipeline and source-of-hire analysis.
4. Recruitment Pipeline Dashboard in Google Sheets — cheapest

What it is: the same pipeline logic in a free-to-run Google Sheet — the lowest-cost way to start measuring recruitment KPIs. Who it is for: startups and small teams living in Google Workspace.
- Shareable with hiring managers by link, no software to install
- Pipeline conversion, time to hire and offer acceptance
- Editable targets and benchmark ranges
- Works on any device including mobile
At $9.99 it is the cheapest entry point in this list and upgrades cleanly to the bundle later. Price: $9.99. Get the Recruitment Pipeline Dashboard in Google Sheets.
Best for: Google Workspace teams on a budget.
5. Recruitment & Talent Acquisition Bundle — best value
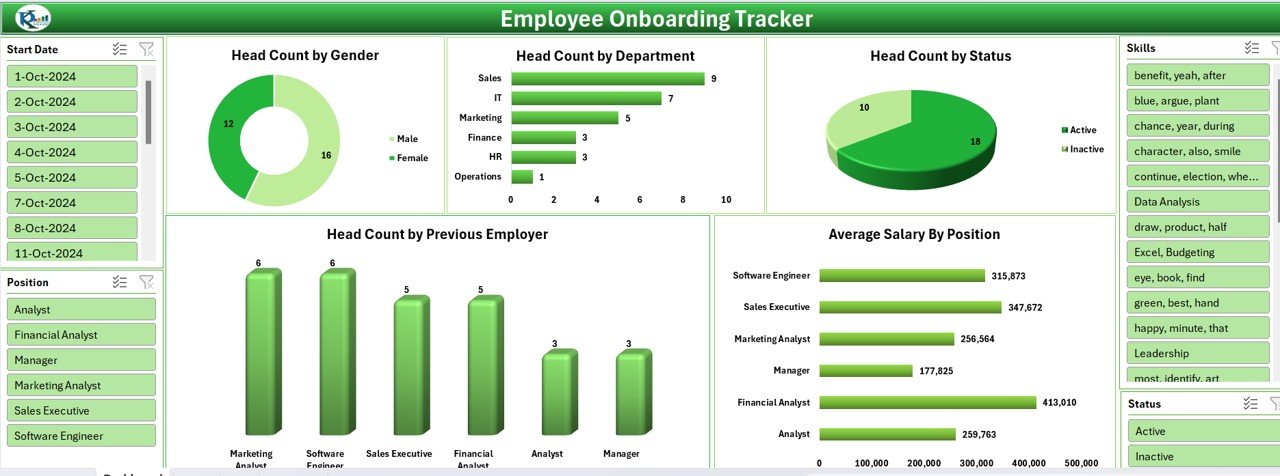
What it is: seven premium Excel and Google Sheets templates covering recruitment, pipeline, KPIs and onboarding in one discounted pack (save 37%). Who it is for: teams that want the whole talent-acquisition toolkit at once.
- Covers every KPI in this article across multiple templates
- Excel and Google Sheets versions included
- Onboarding tracker to connect hiring to first-year retention
- Cheaper than buying the components separately
If you expect to need more than two of the tools above, the bundle is the best value on this page. Price: $35.99. Get the Recruitment & Talent Acquisition Bundle.
Best for: full-stack talent-acquisition coverage in one purchase.
6. Candidate Application Management System
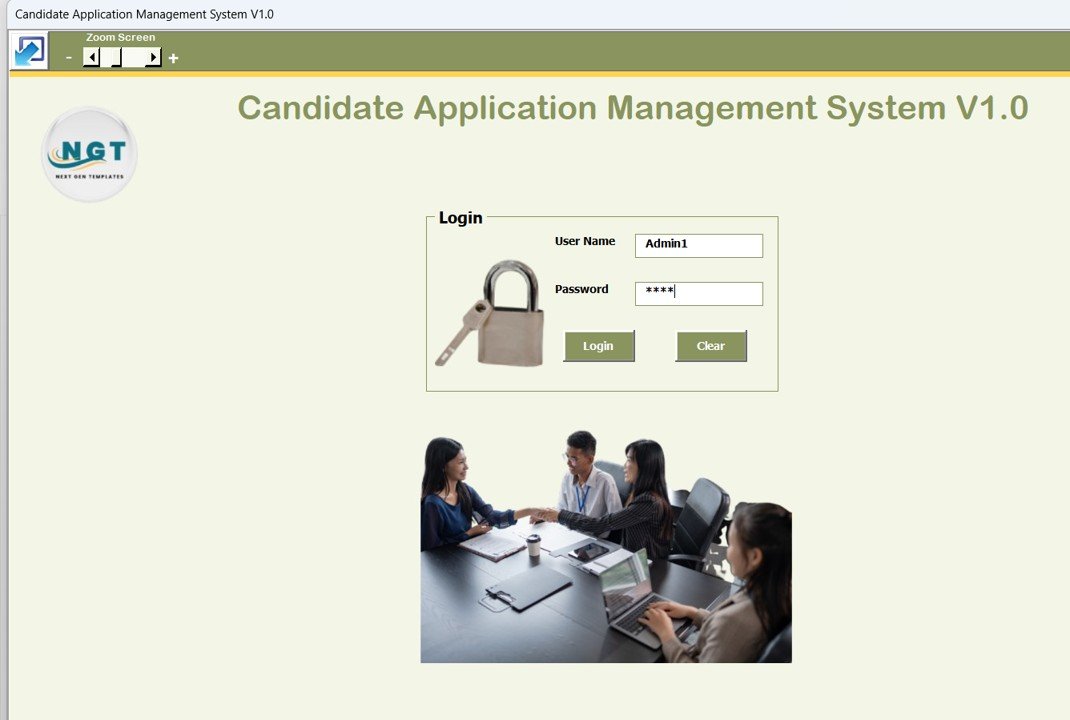
What it is: an Excel VBA application that captures candidate applications, tracks their stage and feeds the raw data your KPIs are built from. Who it is for: teams without a full ATS that still need structured applicant data.
- Add / update / search candidate records with a form UI
- Stage tracking that powers application completion and pipeline conversion
- Source field so you can measure source of hire
- Export-ready data for the scorecard or dashboards above
It solves the upstream problem — clean applicant data — so KPIs #5, #7 and #9 have something reliable to calculate from. Price: $19.99. Get the Candidate Application Management System.
Best for: capturing and tracking applicants without an ATS.
7. Recruitment Agencies Dashboard in Power BI
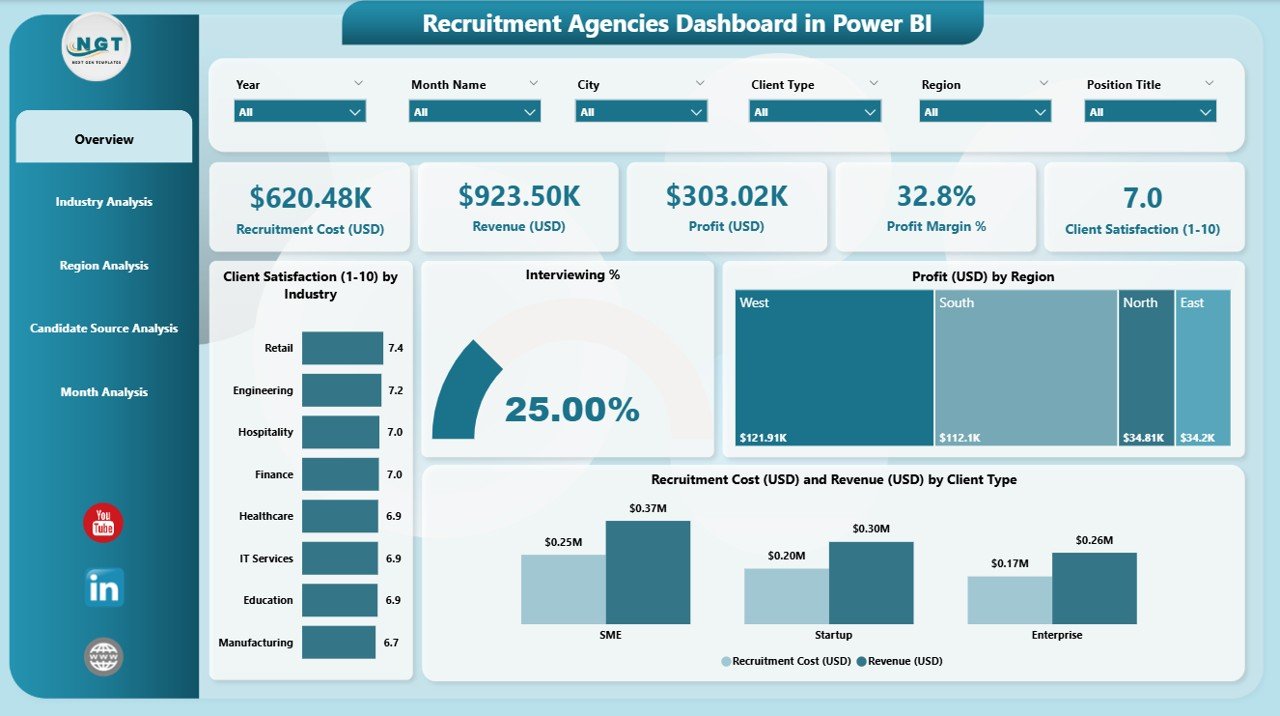
What it is: a Power BI dashboard built for staffing and recruitment agencies, with client, consultant and placement views on top of the core KPIs. Who it is for: agencies billing on placements and recruiter output.
- Placements and revenue by client and consultant
- Recruiter productivity and time-to-fill by desk
- Source effectiveness across candidate channels
- Interactive filters for period and team
For an agency, recruiter productivity (KPI #8) is a revenue metric, and this report puts it front and centre. Price: $17.99. Get the Recruitment Agencies Dashboard in Power BI.
Best for: agencies that need client and consultant views.
8. Recruitment Agencies Dashboard in Excel

What it is: the agency dashboard in pure Excel for teams that prefer spreadsheets to Power BI. Who it is for: smaller agencies without a BI stack.
- Placements, fill rate and recruiter productivity
- Client and role breakdowns
- Time to fill and source of hire
- No add-ins required — opens in standard Excel
Same agency metrics as the Power BI version, at a lower price and zero setup. Price: $13.99. Get the Recruitment Agencies Dashboard in Excel.
Best for: agencies that want agency KPIs in Excel.
How to choose between them
| If you want to… | Choose | Price |
|---|---|---|
| Track all 10 KPIs on one page | Recruitment KPI Scorecard in Excel | $14.99 |
| Fix a leaking funnel | Recruitment Funnel KPI Dashboard in Excel | $12.99 |
| Start as cheaply as possible | Recruitment Pipeline Dashboard in Google Sheets | $9.99 |
| Get everything and save | Recruitment & Talent Acquisition Bundle | $35.99 |
| Run an agency | Recruitment Agencies Dashboard (Power BI or Excel) | $13.99–$17.99 |
Rule of thumb: pick the format your team already lives in (Excel, Sheets or Power BI), start with the scorecard or a pipeline dashboard, and only add the Candidate Application Management System if you do not yet have clean applicant data.
When a recruitment KPI dashboard is NOT the right answer
A spreadsheet dashboard is the right tool when you hire a few to a few hundred people a year and your applicant data lives in exports, sheets or a light ATS. It is the wrong tool in three cases:
- Very high-volume, real-time hiring. If you hire thousands monthly and need live dashboards wired to your ATS, buy dedicated recruiting analytics software instead — a manual refresh will always lag.
- You have no clean source data. No dashboard invents data. If applications are scattered across inboxes, fix capture first (the Candidate Application Management System helps) before expecting reliable KPIs.
- Compliance-grade audit trails. Regulated hiring that needs immutable, per-decision logs belongs in a purpose-built system, not a shared spreadsheet.
For most HR teams and agencies, though, a well-built template gives you 90% of the insight at a fraction of the cost — which is exactly why these dashboards sell.
Frequently asked questions
What are the most important recruitment KPIs to track in 2026?
The core recruitment KPIs are time to hire, time to fill, cost per hire, offer acceptance rate and quality of hire. Together they cover speed, cost and outcome. Add first-year turnover and source of hire to connect the quality of your hiring back to the channels that produced it.
How do you calculate cost per hire?
Cost per hire = (internal recruiting costs + external recruiting costs) ÷ total number of hires in the period. Internal costs include recruiter salaries and referral bonuses; external costs include agency fees, job boards and advertising. The widely cited SHRM average is about $4,700 per hire.
What is a good time to fill?
Across industries, average time to fill sits around 36–44 days, though senior and specialised roles run longer. Track it by role family rather than as one blended number, because a single average can hide a serious bottleneck in one function.
What is the difference between time to hire and time to fill?
Time to fill counts days from the requisition being approved to offer acceptance — the hiring manager’s view. Time to hire counts days from a specific candidate entering the pipeline to accepting — the candidate-experience view. Time to fill is always equal to or longer than time to hire.
What is a good offer acceptance rate?
A healthy offer acceptance rate is 85–90% or higher. If yours sits below 80%, the usual causes are slow decision-making, below-market compensation or a poor candidate experience. Capture decline reasons so you can tell which one is costing you offers.
How do you measure quality of hire?
Quality of hire is a composite of first-year performance rating, time to reach full productivity and retention, often summarised as the percentage of new hires meeting expectations at 12 months. Because it is measured after the start date, you need to keep tracking hires well beyond their first week.
Can I track recruitment KPIs in Excel or Google Sheets?
Yes. Excel, Google Sheets and Power BI all handle recruitment KPIs well, and the eight templates in this article cover all three formats. A pre-built dashboard or scorecard saves you from building funnel formulas and traffic-light logic from scratch, starting from $9.99.
What is a benchmark for first-year new-hire turnover?
Aim to keep first-year new-hire turnover under 15–20%. Higher rates usually signal weak quality of hire or misleading source-of-hire data. Always analyse turnover against the channels and roles that produced those hires rather than treating it as one flat number.
Which recruitment KPI dashboard should a small team buy first?
Start with the Recruitment Pipeline Dashboard in Google Sheets at $9.99 or the Recruitment KPI Scorecard in Excel at $14.99. Both cover the essential KPIs with editable targets. If you expect to need several tools, the Recruitment & Talent Acquisition Bundle at $35.99 is the best value.
How often should I review recruitment KPIs?
Review headline KPIs — time to fill, cost per hire, offer acceptance — monthly, and deeper ones like quality of hire and first-year turnover quarterly. A scorecard with month-to-date and year-to-date columns makes both cadences easy from a single file.
Get more recruitment KPI templates
Ready to measure what matters? The Recruitment KPI Scorecard in Excel ($14.99) is the fastest way to track all 10 recruitment KPIs against benchmarks, and the Recruitment & Talent Acquisition Bundle ($35.99, 7 templates, save 37%) gives you the full toolkit for less. Prefer Google Sheets? Start with the Recruitment Pipeline Dashboard in Google Sheets at $9.99.
For setup walkthroughs and dashboard tutorials, subscribe to the NextGenTemplates YouTube channel. You may also like our guides to recruitment and onboarding templates every HR team needs, procurement KPIs to track in 2026, inventory KPIs, supply chain KPIs and manufacturing KPIs. External benchmark data in this guide draws on SHRM talent-acquisition benchmarking.