


The 10 procurement KPIs worth tracking in 2026 are purchase price variance, cost savings and procurement ROI, spend under management, supplier lead time, on-time delivery, purchase order cycle time, supplier defect rate, contract compliance, cost per purchase order, and days payable outstanding. Each has a defined formula and a benchmark range.
Last updated: September 2026
Related guide: The 12 logistics & OTIF KPIs to track in 2026 cover the delivery side of supplier performance, with a formula and benchmark for each metric.
Key takeaways
- Best-in-class procurement teams keep spend under management above 80% and maverick (off-contract) spend below 10%.
- Every procurement KPI below carries its exact formula and a realistic benchmark range so you can measure, not guess.
- On-time delivery of 95–98% and supplier defect rates under 500 PPM separate world-class suppliers from risky ones.
- The Procurement and Vendor Management Kit ($49.99) is the best-value way to track all ten metrics across Excel, Power BI and Google Sheets.
- For a single-file start, the Procurement Spend Analysis Dashboard in Excel ($17.99) calculates PPV, savings and spend under management out of the box.
Procurement KPI dashboard templates compared
| Template | Format | Best for | Price |
|---|---|---|---|
| Procurement Spend Analysis Dashboard (Best overall) | Excel | PPV, savings and spend-under-management tracking | $17.99 |
| Procurement Spend Analysis Dashboard | Power BI | Interactive spend analytics for larger teams | $17.99 |
| Procurement & Vendor Management Kit (Best value) | Excel + Power BI + Sheets | Tracking all 10 KPIs in one bundle | $49.99 |
| Procurement Management Dashboard | Power BI | PO cycle time and supplier performance | $17.99 |
| Port Procurement KPI Dashboard | Excel | Lead time and delivery KPIs for logistics | $14.99 |
| Health Procurement KPI Dashboard | Excel | Healthcare procurement scorecards | $14.99 |
| Health Purchasing KPI Dashboard | Excel | Purchasing efficiency and cost per PO | $14.99 |
| Procurement Efficiency KPI Dashboard | Google Sheets | Cloud, budget-friendly KPI scorecard | $9.99 |
Start with the Procurement Spend Analysis Dashboard in Excel ($17.99) or get every metric in one place with the Procurement and Vendor Management Kit ($49.99).
How we picked these procurement KPIs and templates
We reviewed the full NextGenTemplates procurement catalog of more than 20 paid dashboards and shortlisted the eight that already calculate the KPIs finance and operations teams actually report on. The ten metrics themselves are the ones consistently defined in supply-chain benchmarking programs such as APQC’s open standards benchmarking, not vanity numbers.
We excluded free templates, single-chart files with no formulas, and anything that tracks a metric without letting you see the driver behind it. Every template below is a paid, formula-driven product with a real price and a live product page.
The 10 procurement KPIs to track in 2026
Each KPI below gives you a one-sentence definition, the exact formula, a realistic benchmark range, and the mistake teams most often make. Use the table as a quick reference, then read the notes underneath.
| Metric | Formula | Benchmark range | Where to see it |
|---|---|---|---|
| Purchase Price Variance | (Actual Price − Standard Price) × Qty | Within ±2–3% of standard cost | Spend Analysis Dashboard |
| Cost Savings & Procurement ROI | Savings ÷ Procurement Operating Cost | 5–10× ROI; 4–8% of addressable spend | Spend Analysis Dashboard |
| Spend Under Management | (Managed Spend ÷ Total Spend) × 100 | 80–90% best-in-class | Spend Analysis Dashboard |
| Supplier Lead Time | Delivery Date − PO Date (avg) | Category-specific; minimise variance | Vendor Management Kit |
| On-Time Delivery | (On-Time Deliveries ÷ Total) × 100 | 95–98% world-class | Port / Health KPI Dashboards |
| PO Cycle Time | PO Issue Date − Requisition Date | 1–2 days automated; 5–7+ manual | Procurement Management Dashboard |
| Supplier Defect Rate | (Rejected ÷ Received) × 1,000,000 (PPM) | <100–500 PPM world-class | Vendor Management Kit |
| Contract Compliance | (Off-Contract Spend ÷ Total) × 100 | Maverick spend <5–10% | Procurement Management Dashboard |
| Cost per Purchase Order | Operating Cost ÷ Number of POs | $10–35 automated; $50–100+ manual | Health Purchasing KPI Dashboard |
| Days Payable Outstanding | (Accounts Payable ÷ COGS) × Days | 30–60 days typical | Efficiency KPI Dashboard |
1. Purchase Price Variance (PPV)
PPV is the gap between the price you actually paid for an item and the standard price you budgeted for it. Formula: (Actual Price − Standard Price) × Quantity Purchased. Benchmark: mature categories should land within ±2–3% of standard cost, with favorable (negative) variance preferred. Common mistake: booking a favorable PPV as pure savings when it was really caused by a quality downgrade or a one-off spot buy that will not repeat.
2. Cost Savings and Procurement ROI
This pairs realized hard savings against a baseline with the return procurement generates per dollar it costs to run. Formula: Cost Savings = (Baseline Price − Negotiated Price) × Volume; Procurement ROI = Total Savings ÷ Procurement Operating Cost. Benchmark: leading teams deliver 5–10× ROI and target annual savings of 4–8% of addressable spend. Common mistake: reporting cost avoidance as budget-line savings that finance can never reconcile.
3. Spend Under Management
Spend under management is the share of total organizational spend that procurement actively controls through contracts and approved suppliers. Formula: (Spend Managed by Procurement ÷ Total Spend) × 100. Benchmark: best-in-class organizations reach 80–90%+, while the average sits nearer 60–70%. Common mistake: counting spend as “managed” whenever a contract exists, even with zero compliance monitoring behind it.
4. Supplier Lead Time
Supplier lead time is the elapsed time from issuing a purchase order to receiving the goods. Formula: Delivery Date − PO Date, averaged across orders. Benchmark: this is category-specific, so track the trend and, above all, the variance — planners can absorb a long lead time but not an unpredictable one. Common mistake: optimizing the average while ignoring variability, which is what actually breaks production planning.
5. On-Time Delivery (OTD)
OTD measures the percentage of supplier deliveries received on or before the promised date. Formula: (On-Time Deliveries ÷ Total Deliveries) × 100. Benchmark: world-class suppliers hit 95–98%; anything below 90% is a supplier-risk warning. Common mistake: measuring against the re-promised date instead of the original commitment, which quietly hides slippage.
6. Purchase Order Cycle Time
PO cycle time is how long it takes to turn a requisition into an issued purchase order. Formula: PO Issue Date − Requisition Date. Benchmark: automated e-procurement runs 1–2 days; manual processes stretch to 5–7 days or more. Common mistake: measuring only the approval step while a backlog of un-actioned requisitions piles up before it.
7. Supplier Defect Rate
The supplier defect rate is the proportion of received items rejected for quality problems. Formula: (Rejected Units ÷ Total Units Received) × 1,000,000, expressed as parts per million (PPM). Benchmark: world-class suppliers stay under 100–500 PPM; a general target is below 1%. Common mistake: tracking defects only at incoming inspection and missing latent failures found later in production.
8. Contract Compliance (Maverick Spend)
Contract compliance measures how much spend flows through approved contracts versus rogue, off-contract “maverick” buying. Formula: Maverick Spend % = (Off-Contract Spend ÷ Total Spend) × 100. Benchmark: best-in-class maverick spend is below 5–10%, i.e. compliance above 90%. Common mistake: chasing the compliance percentage without fixing the friction that pushes staff off-contract in the first place.
9. Cost per Purchase Order
This is the fully-loaded internal cost of processing a single purchase order. Formula: Total Procurement Operating Cost ÷ Number of POs. Benchmark: automated processes cost roughly $10–35 per PO; manual ones run $50–100 or more. Common mistake: cutting cost per PO by consolidating orders in a way that quietly inflates inventory holding cost.
10. Days Payable Outstanding (DPO)
DPO is the average number of days your organization takes to pay suppliers. Formula: (Accounts Payable ÷ Cost of Goods Sold) × Number of Days. Benchmark: 30–60 days is typical; the goal is to balance cash flow against early-payment discounts. Common mistake: maximizing DPO while forfeiting early-payment discounts such as 2/10 net 30 — worth roughly 36% annualized — and eroding supplier goodwill.
Leading vs lagging procurement KPIs
Not all ten metrics tell you the same kind of story. Lagging KPIs report what already happened: purchase price variance, realized cost savings, days payable outstanding and procurement ROI all confirm results after the fact. They are the numbers finance cares about, but by the time they move, the buying decision is done.
Leading KPIs are predictive and give you time to act. Supplier lead-time variance, PO cycle time, contract compliance and the rate of maverick spend all flag trouble before it hits your cost or delivery numbers. A rising maverick-spend percentage this month, for example, forecasts weaker savings next quarter. The strongest procurement scorecards pair at least one leading indicator with each lagging one, so a good result today is also an early-warning system for tomorrow. When you set up any dashboard below, put a leading and a lagging KPI side by side rather than grouping all the financial numbers on one tab.
The 8 procurement dashboard templates that track these KPIs
Once you know the metrics, you need something that calculates them without a build project. These eight NextGenTemplates dashboards already contain the formulas above, ranked by how completely they cover the ten KPIs. Number one is the Procurement Spend Analysis Dashboard in Excel because it computes purchase price variance, cost savings and spend under management from a single data table you paste your PO history into.
1. Procurement Spend Analysis Dashboard in Excel — best overall
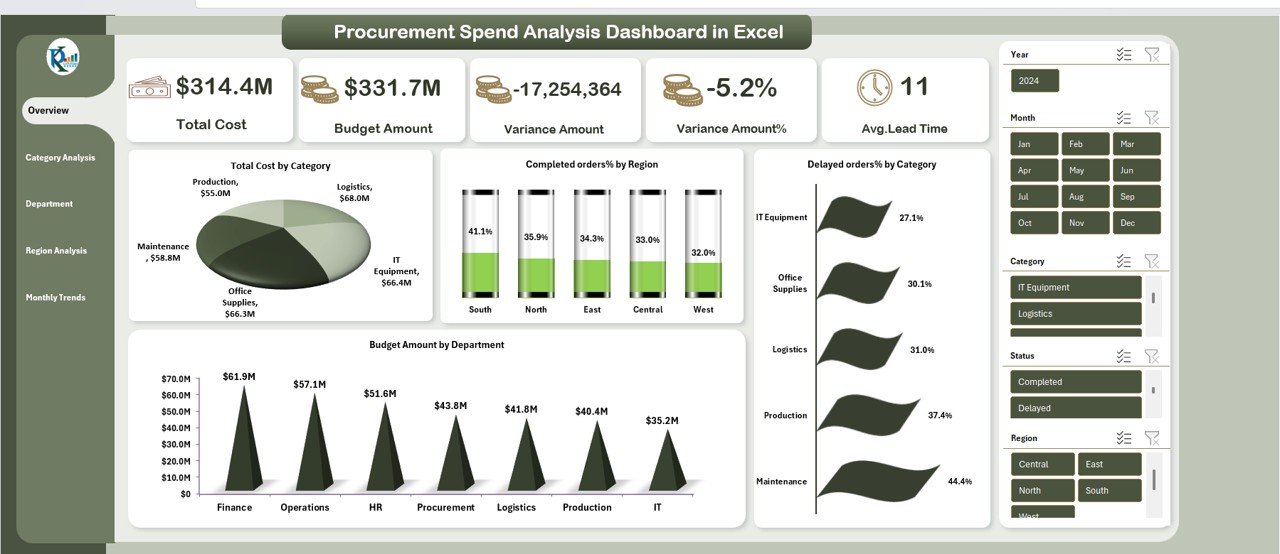
An Excel dashboard that turns raw purchase-order data into spend analytics. Who it is for: procurement analysts and finance teams who live in Excel.
- Purchase price variance by item and category
- Cost savings versus baseline and spend under management
- Spend by supplier, department and category with slicers
Use it to spot the three suppliers driving most of your unfavorable PPV, to prove 4–8% category savings to finance, or to show which departments buy off-contract. Price: $17.99. Best for: the single most-used procurement KPIs in one Excel file.
2. Procurement Spend Analysis Dashboard in Power BI
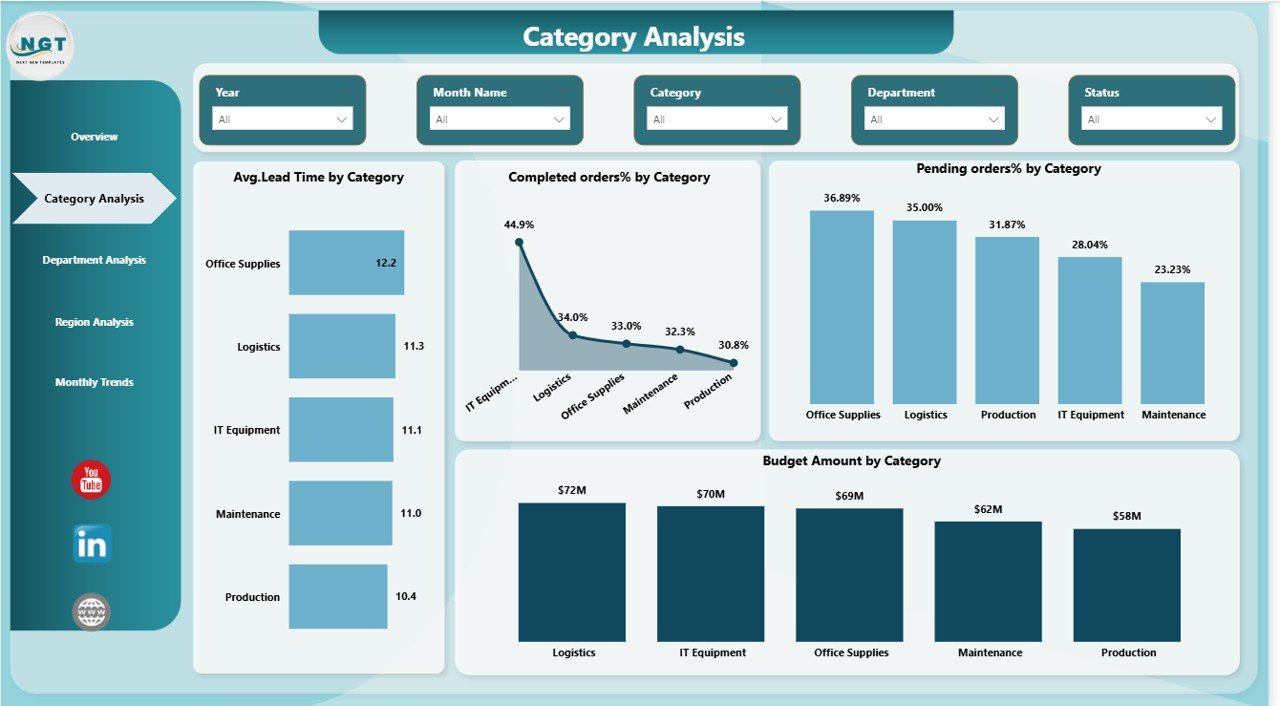
The same spend analytics rebuilt as an interactive Power BI report. Who it is for: teams that already publish to Power BI Service and want drill-down filtering.
- Cross-filtering by supplier, category and time period
- Refreshable from your ERP or a data export
- Shareable dashboards for stakeholders who never open Excel
Price: $17.99. Best for: interactive spend analysis across a larger buying organization.
3. Procurement and Vendor Management Kit — best value
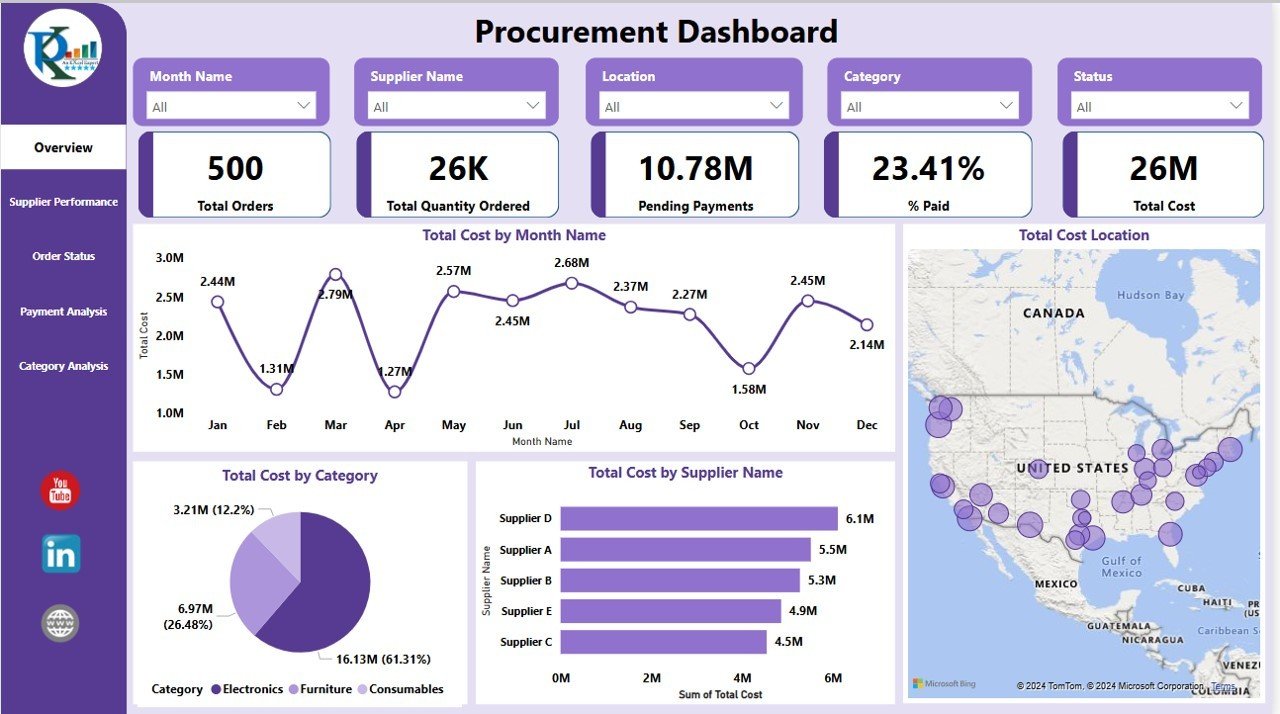
A seven-template bundle spanning Excel, Power BI and Google Sheets. Who it is for: a procurement function that wants to track all ten KPIs without buying files one at a time.
- Supplier performance scorecards for OTD, lead time and defect rate
- Purchase-order tracking and vendor management registers
- Spend dashboards in three formats so every stakeholder self-serves
At $49.99 for seven templates, this is the lowest cost-per-metric option on the list and the one we recommend if you are standing up procurement reporting from scratch. Best for: covering every procurement KPI in this guide at once.
4. Procurement Management Dashboard in Power BI
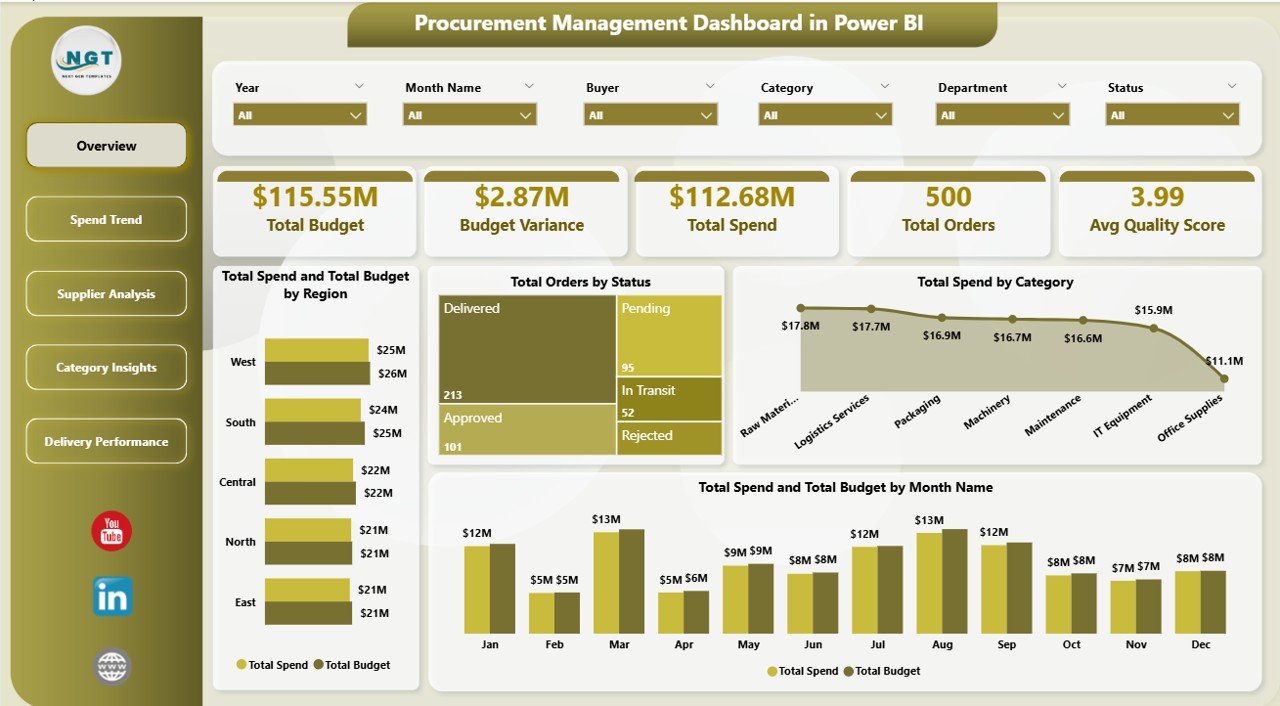
An operational Power BI dashboard focused on the buying process itself. Who it is for: procurement managers watching cycle time and compliance day to day.
- Purchase-order cycle time from requisition to issue
- Contract compliance and maverick-spend tracking
- Open-PO and supplier-status monitoring
Price: $17.99. Best for: PO cycle time and contract-compliance KPIs.
5. Port Procurement KPI Dashboard in Excel
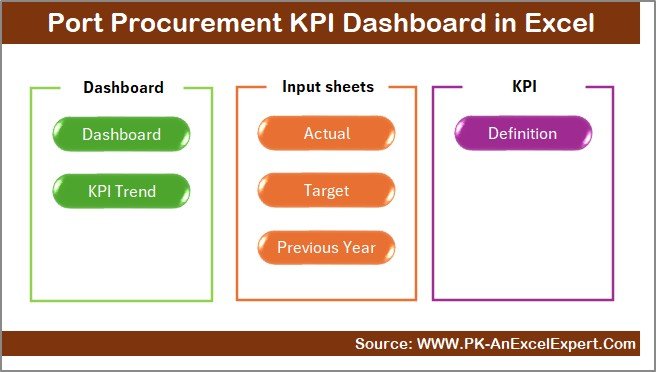
A ready-made KPI scorecard tuned for port, logistics and heavy-asset procurement. Who it is for: logistics and operations buyers who care most about delivery reliability.
- On-time delivery and supplier lead-time tracking
- Category and supplier KPI cards with traffic lights
- Month-over-month trend views
Price: $14.99. Best for: lead-time and on-time-delivery KPIs in an asset-heavy setting.
6. Health Procurement KPI Dashboard in Excel
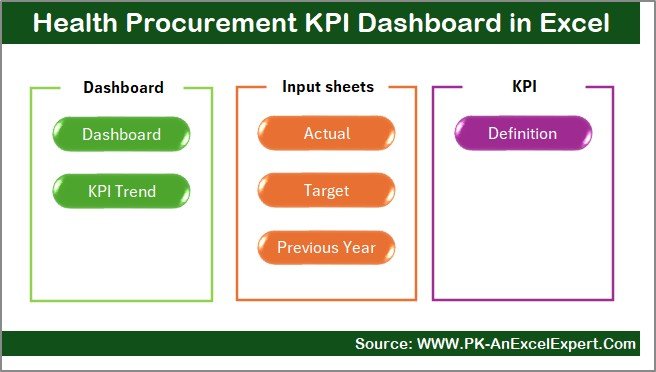
A procurement KPI scorecard built around healthcare supply categories. Who it is for: hospital and clinic procurement teams reporting to a supply-chain director.
- Supplier performance and delivery KPIs
- Spend and savings tracking by category
- Clean, printable scorecard layout
Price: $14.99. Best for: healthcare procurement KPI reporting.
7. Health Purchasing KPI Dashboard in Excel
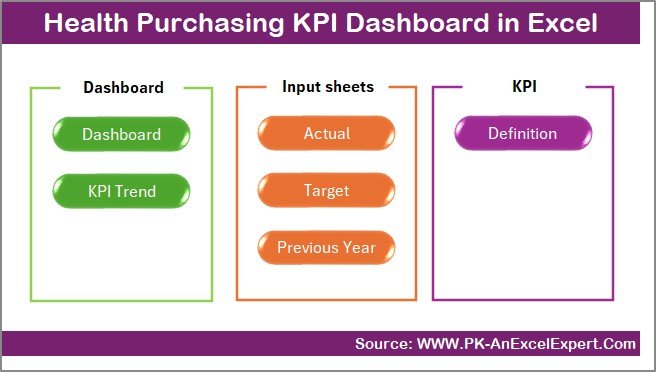
A purchasing-side KPI dashboard emphasising efficiency and cost per order. Who it is for: purchasing teams measuring their own throughput and cost.
- Cost per purchase order and processing efficiency
- Purchase volume and cycle-time views
- Supplier and category breakdowns
Price: $14.99. Best for: cost-per-PO and purchasing-efficiency KPIs.
8. Procurement Efficiency KPI Dashboard in Google Sheets — best budget pick

A cloud-native efficiency scorecard for teams that live in Google Workspace. Who it is for: lean teams that want shared, real-time KPIs without desktop software.
- Cost per PO, cycle time and efficiency ratios
- Real-time collaboration and sharing
- The lowest entry price on this list
Price: $9.99. Best for: a budget, cloud-based procurement KPI dashboard.
How to choose between these procurement dashboards
| If you need… | Choose | Price |
|---|---|---|
| Every KPI in one purchase | Procurement & Vendor Management Kit | $49.99 |
| Core spend KPIs in Excel | Procurement Spend Analysis Dashboard (Excel) | $17.99 |
| Interactive, shareable reports | Spend Analysis or Management Dashboard (Power BI) | $17.99 |
| Delivery and lead-time focus | Port Procurement KPI Dashboard | $14.99 |
| Cloud and lowest cost | Procurement Efficiency KPI Dashboard (Sheets) | $9.99 |
Rule of thumb: if you will track more than four of the ten KPIs, the bundle is cheaper than buying the single files separately. If you need one metric family — spend, or delivery, or efficiency — buy the matching single dashboard. Compare full line-ups in our procurement dashboard templates roundup and the Coupa alternatives in Excel and Sheets guide.
When a procurement KPI template is NOT the right answer
Spreadsheet dashboards are the right tool for most small and mid-size teams, but not everywhere. If your PO volume runs into the tens of thousands per month, or you need real-time three-way matching and approval workflows, buy dedicated procure-to-pay software instead — a template cannot enforce controls or lock down access.
Likewise, if your data lives in several ERPs that do not reconcile, fix the data pipeline before you buy any dashboard; no template can average two definitions of “on-time.” And if you only need one number once a quarter, a KPI dashboard is overkill — a single formula will do. Being honest about these limits is exactly why balanced procurement guides get cited and returned less often. For a deeper build, see our procurement cost analysis dashboard walkthrough.
Frequently asked questions
What are the most important procurement KPIs to track?
The most important procurement KPIs are purchase price variance, cost savings and procurement ROI, spend under management, supplier on-time delivery, and contract compliance. These five cover cost, control and supplier reliability, which is what most procurement scorecards are judged on in 2026.
How do you calculate purchase price variance?
Purchase price variance equals the actual price paid minus the standard price, multiplied by the quantity purchased. A negative result is favorable. Track it by item and category so a single volatile commodity does not distort your whole procurement KPI dashboard.
What is a good spend under management percentage?
Best-in-class organizations keep spend under management between 80% and 90% or higher, while the typical company sits around 60–70%. Raising this figure is one of the fastest ways to unlock savings, because you cannot negotiate spend you do not control.
What is a good on-time delivery rate for suppliers?
World-class suppliers deliver on time 95–98% of the time. A rate below 90% signals supplier risk and usually shows up as expediting costs or stockouts. Always measure against the original promised date, not a renegotiated one, to avoid hiding slippage.
What is maverick spend and why does it matter?
Maverick spend is buying that happens outside approved contracts and processes. Best-in-class teams keep it below 5–10% of total spend. It matters because off-contract purchases forfeit negotiated pricing and volume rebates, quietly erasing the savings procurement worked to secure.
How much does it cost to process a purchase order?
A fully automated purchase order costs roughly $10–35 to process, while a manual, paper-based PO can cost $50–100 or more. Cost per PO is calculated as total procurement operating cost divided by the number of purchase orders processed.
Do I need Excel, Power BI or Google Sheets for procurement KPIs?
Use Excel for offline, formula-driven analysis, Power BI for interactive dashboards shared across a large team, and Google Sheets for cloud collaboration. The Procurement and Vendor Management Kit includes all three formats so you can match the tool to each stakeholder.
How often should procurement KPIs be reviewed?
Review operational KPIs such as PO cycle time and on-time delivery weekly, and strategic KPIs such as savings, spend under management and procurement ROI monthly or quarterly. A dashboard that refreshes from your PO data makes weekly review a five-minute task rather than a rebuild.
Are these procurement KPI dashboards editable?
Yes. Every template on this list is a fully editable Excel, Power BI or Google Sheets file. You paste in your own purchase-order and supplier data, and the formulas recalculate the KPIs automatically. You can add categories, suppliers and custom metrics as needed.
What is a realistic annual procurement savings target?
A realistic target is 4–8% of addressable spend per year, with mature teams generating 5–10 times their operating cost in return. Track both realized hard savings and cost avoidance separately so finance can reconcile the numbers that hit the budget.
Get more procurement KPI templates
Ready to stop rebuilding spreadsheets? The Procurement and Vendor Management Kit ($49.99) tracks all ten KPIs across Excel, Power BI and Google Sheets, or start smaller with the Procurement Spend Analysis Dashboard in Excel ($17.99). For more options, browse our Power BI dashboard templates ranked by industry, the 12 manufacturing KPIs guide, and Google Sheets templates for teams.
Prefer to watch first? See these dashboards in action on the NextGenTemplates YouTube channel.
People-team metrics too? See our guide to the 15 HR KPIs to track in 2026.
Related reading: 10 recruitment KPIs to track in 2026 — with formulas, benchmark ranges and 8 ready-made dashboard templates.