

The employee turnover rate is the percentage of staff who leave over a set period, calculated as separations divided by average headcount, multiplied by 100. To understand why people leave and where, track it alongside nine related metrics: voluntary, involuntary, new-hire and regretted attrition, attrition rate, retention rate, average tenure, segmented turnover and the cost of turnover.
Last updated: September 2026
Key takeaways
- Employee turnover rate = (separations / average headcount) × 100; most industries run a healthy 12-20% a year, though the US Bureau of Labor Statistics JOLTS data shows total separation rates vary widely by sector.
- Track 10 metrics, not one: voluntary, involuntary, attrition, retention, new-hire, regretted and segmented turnover each point to a different root cause.
- Replacing one employee typically costs 0.5x to 2x their annual salary once recruiting, onboarding and lost productivity are counted.
- The Employee Turnover Dashboard in Excel ($17.99) calculates every core turnover metric out of the box – our best overall pick.
- On a budget, the Employee Exit Tracker in Google Sheets ($6.99) is the fastest way to start measuring exits – our best value pick.
The 10 employee turnover & attrition metrics at a glance
Here is the full metric map: the definition, the exact formula, a realistic benchmark range, and which ready-made NGT dashboard already calculates it. Detailed explanations follow below.
| Metric | Formula | Benchmark range | Where to see it |
|---|---|---|---|
| 1. Overall employee turnover rate | (Total separations / Avg headcount) × 100 | 12-20% per year | Employee Turnover Dashboard (Excel / Power BI) |
| 2. Voluntary turnover rate | (Voluntary exits / Avg headcount) × 100 | 6-13% per year | Employee Turnover Dashboard |
| 3. Involuntary turnover rate | (Involuntary exits / Avg headcount) × 100 | 2-6% per year | Employee Turnover Dashboard |
| 4. Attrition rate | (Unbackfilled exits / Avg headcount) × 100 | Context-specific | Employee Performance & Attrition Dashboard |
| 5. Retention rate | (Employees retained / Employees at start) × 100 | 85-90%+ per year | Employee Retention Dashboard / KPI Dashboards |
| 6. New-hire (first-year) turnover rate | (First-year leavers / New hires) × 100 | Under 20% healthy; over 30% high | Employee Exit Tracker |
| 7. Regretted (high-performer) attrition | (Regretted exits / Total exits) × 100 | Keep under 10% | Employee Performance & Attrition Dashboard |
| 8. Average tenure | Sum of tenure / Headcount (use median) | ~4 years (BLS median 4.1) | Retention KPI Dashboards |
| 9. Turnover by department / demographic | (Segment separations / Segment avg headcount) × 100 | Compare vs company average | Retail & ESG Retention KPI Dashboards |
| 10. Cost of turnover | Cost per exit × number of exits | 0.5x-2x salary per exit | Retention KPI Dashboards |
The 10 metrics explained
1. Overall employee turnover rate
Definition: The share of your workforce that leaves – for any reason – during a period.
Formula: (Total separations / Average headcount) × 100. Average headcount = (start headcount + end headcount) / 2.
Benchmark: A healthy annual employee turnover rate sits around 12-20% for most industries; retail, hospitality and call centres run much higher, while government and utilities run lower.
The mistake teams make: Dividing by ending headcount instead of average headcount. In a growing team this understates turnover; in a shrinking team it overstates it. Always use the average, and state the period (monthly figures annualise very differently).
2. Voluntary turnover rate
Definition: The percentage of employees who chose to leave – resignations, not terminations.
Formula: (Voluntary exits / Average headcount) × 100.
Benchmark: Roughly 6-13% a year is normal; sustained numbers above that signal pay, manager or career-path problems.
The mistake teams make: Reporting one blended turnover number. Voluntary and involuntary turnover have opposite meanings – one is a retention failure, the other is often a deliberate management action – so blending them hides the story a leadership team actually needs.
3. Involuntary turnover rate
Definition: The percentage of employees the company exits – layoffs, performance terminations, end of contract.
Formula: (Involuntary exits / Average headcount) × 100.
Benchmark: Around 2-6% a year in stable organisations; spikes usually map to restructuring or a hiring-quality problem upstream.
The mistake teams make: Mislabelling a managed-out low performer as voluntary because they technically resigned. That flatters the voluntary number and masks a recruiting or onboarding gap that a new-hire turnover metric would expose.
4. Attrition rate
Definition: Strictly, attrition is the natural reduction of headcount when roles are left unfilled after someone leaves; in everyday HR use it is often a synonym for turnover.
Formula: (Unbackfilled exits / Average headcount) × 100 for true attrition; many teams use the same formula as turnover.
Benchmark: Context-specific – a deliberate attrition strategy during a cost freeze looks very different from unplanned attrition.
The mistake teams make: Using attrition and turnover interchangeably in a board report without defining which you mean. Pick one definition, write it on the dashboard, and stick to it.
5. Retention rate
Definition: The percentage of employees present at the start of a period who are still employed at the end.
Formula: (Employees retained from start / Employees at start) × 100. Note that new hires who arrive and leave within the period are excluded.
Benchmark: 85-90%+ annual retention is the target for most teams.
The mistake teams make: Assuming retention rate = 100% minus turnover rate. It does not, because turnover counts anyone who left (including new hires) while retention only tracks the starting cohort. The two answer different questions.
6. New-hire (first-year) turnover rate
Definition: The share of recent hires who leave within their first year – and the 90-day early-attrition slice inside it.
Formula: (First-year leavers / New hires in the period) × 100; the 90-day version divides leavers-within-90-days by new hires.
Benchmark: Under 20% first-year turnover is healthy; above 30% points to a hiring, expectation-setting or onboarding failure. Keep 90-day early attrition under 10%.
The mistake teams make: Never segmenting by tenure, so a broken onboarding process hides inside the company-wide rate for years.
7. Regretted (high-performer) attrition rate
Definition: The proportion of departures the company wishes it had kept – typically high performers and hard-to-replace skills.
Formula: (Regretted exits / Total exits) × 100, or top performers lost / total top performers.
Benchmark: Aim to keep regretted attrition under 10% of exits; the raw turnover number matters far less than who is leaving.
The mistake teams make: Treating every exit as equally bad. Losing a disengaged under-performer can be healthy; losing your best engineer is not. Tag exits as regretted or non-regretted at offboarding.
8. Average tenure
Definition: How long employees stay, on average, before leaving.
Formula: Sum of all employees tenure / headcount – but report the median, not the mean.
Benchmark: The BLS median employee tenure is about 4.1 years; younger and tech-heavy workforces trend lower.
The mistake teams make: Using the mean, which a handful of 20-year veterans can drag upwards until it hides high churn among newer staff. The median is far more honest for a fast-moving team.
9. Turnover by department and demographic
Definition: The employee turnover rate broken out by team, location, manager, gender, age band or job level.
Formula: (Segment separations / Segment average headcount) × 100 for each slice.
Benchmark: Compare each segment against the company average; a hotspot is any group running materially above it.
The mistake teams make: Reporting only a single company-wide number. One toxic team or one region can be 40% while the company average looks fine at 15%. Segmentation is where the fix actually lives.
10. Cost of turnover
Definition: The full financial impact of losing and replacing an employee.
Formula: Cost per exit (recruiting + onboarding + training + lost productivity + backfill overtime) × number of exits.
Benchmark: Widely estimated at 0.5x to 2x annual salary per departure, and higher for senior or specialised roles.
The mistake teams make: Counting only the agency or job-board fee. The largest costs are invisible on an invoice – ramp-up time, lost institutional knowledge and the drag on the team left behind.
8 ready-made employee turnover dashboard templates compared
Every metric above is already built into one of these paid templates, so you get formulas, benchmarks and charts without building a workbook from scratch. Prices are in USD.
| Template | Format | Best for | Price |
|---|---|---|---|
| Employee Turnover Dashboard (Best overall) | Excel | Full turnover metric suite in Excel | $17.99 |
| Employee Turnover Dashboard | Power BI | Interactive, filterable turnover reporting | $17.99 |
| Employee Retention Dashboard | Power BI | Retention-first leadership view | $17.99 |
| Employee Performance & Attrition Dashboard | Google Sheets | Linking attrition to performance | $9.99 |
| Employee Retention KPI Dashboard | Excel | Retention KPI scorecard | $12.99 |
| Retail & E-commerce Retention KPI Dashboard | Excel | High-churn retail and e-commerce teams | $14.99 |
| Environmental & Sustainability Retention KPI Dashboard | Excel | ESG and sustainability workforces | $14.99 |
| Employee Exit Tracker (Best value) | Google Sheets | Starting to measure exits cheaply | $6.99 |
How we picked these
We searched the full NextGenTemplates HR and workforce catalogue and shortlisted only templates that actually calculate the turnover and attrition metrics above – not generic HR sheets. We prioritised multi-format coverage (Excel, Google Sheets and Power BI) so you can self-select, real dashboards with charts and filters over static tables, and price points from $6.99 to $17.99. We excluded free samples, broad HR management systems and anything that only stores records without computing a rate.
The 8 best employee turnover & attrition dashboard templates for 2026
1. Employee Turnover Dashboard in Excel – best overall
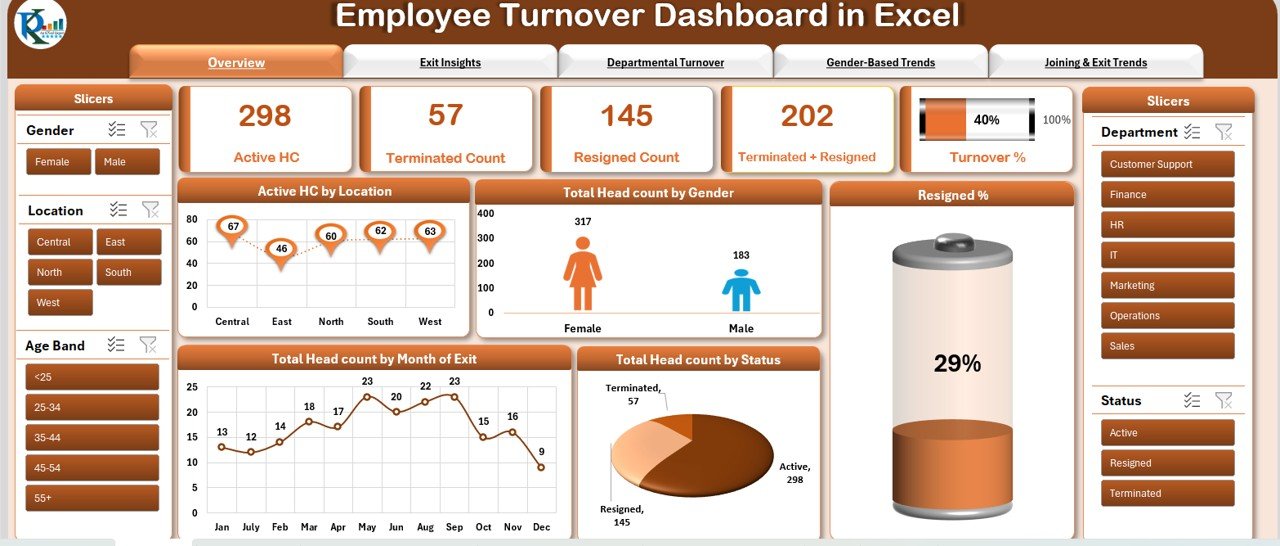
What it is: A complete Excel dashboard that turns a headcount and exit list into every core turnover metric automatically.
Who it is for: HR and people-ops teams who live in Excel and want one file that just works.
What is inside:
- Overall, voluntary and involuntary turnover rate cards
- Terminated vs resigned counts and turnover % by month
- Headcount by gender, department, location and status
- Exit-reason and joining-vs-exit trend charts
Load 298 active and 202 exited employees and it recalculates the whole board; filter to one department to expose a 40% hotspot hiding behind a 15% company average; track resigned-count month over month to catch a resignation spike early.
Price: $17.99. Get the Employee Turnover Dashboard in Excel.
Best for: The single most complete employee turnover rate tool for Excel users.
2. Employee Turnover Dashboard in Power BI
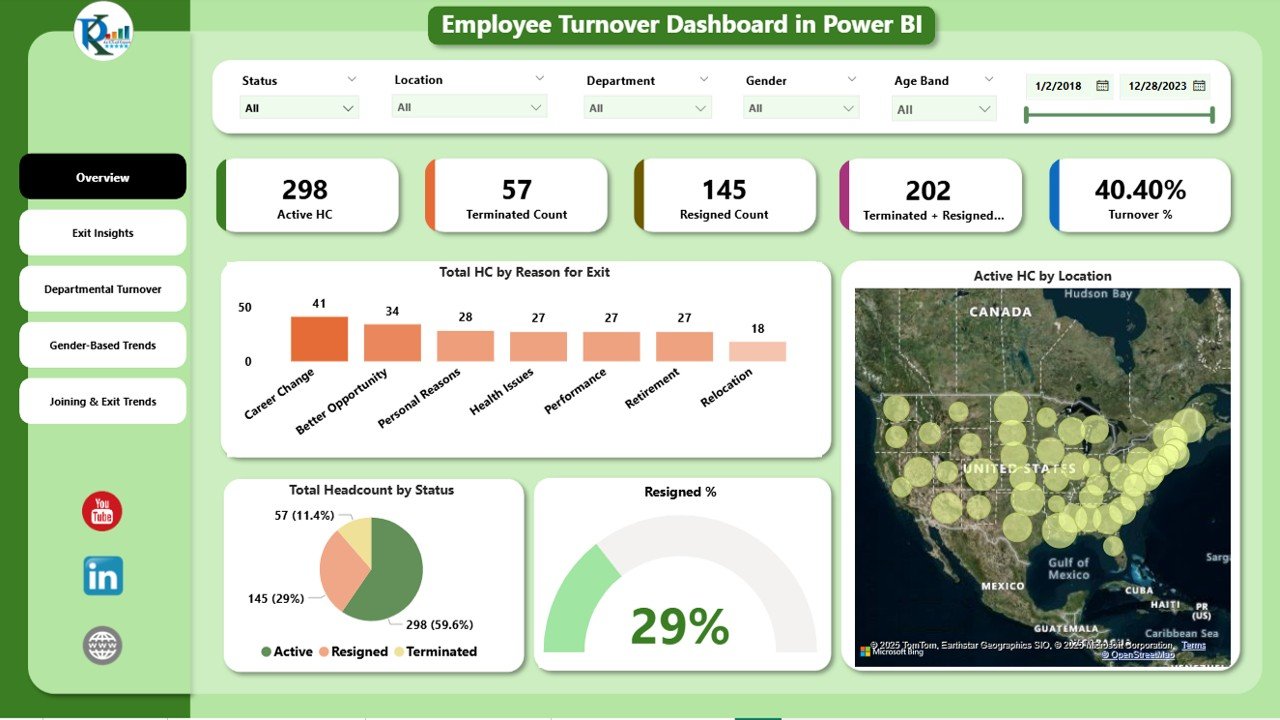
What it is: The same turnover metric suite rebuilt as an interactive Power BI report.
Who it is for: Teams that already publish to Power BI and need slicers, drill-down and a refreshable data model.
What is inside:
- Slicer-driven turnover % by department, location and job role
- Headcount and status visuals with cross-filtering
- Gender-based and joining-and-exit trend pages
Connect it to your HRIS export and the whole model refreshes; hand executives a filterable page instead of a static screenshot; compare two regions side by side in one click.
Price: $17.99. Get the Power BI turnover dashboard.
Best for: Interactive, self-service turnover reporting.
3. Employee Retention Dashboard in Power BI

What it is: A retention-first Power BI dashboard that frames the same data around who stays rather than who leaves.
Who it is for: Leadership teams whose goal is stated as a retention target.
What is inside:
- Retention rate and active headcount cards
- Resigned % gauges and status breakdowns
- Department and region retention comparisons
Set an 88% retention goal and watch progress; spot the team dragging the average down; pair it with the turnover dashboard for both sides of the same equation.
Price: $17.99. Get the Power BI retention dashboard.
Best for: Retention-goal reporting in Power BI.
4. Employee Performance & Attrition Dashboard in Google Sheets
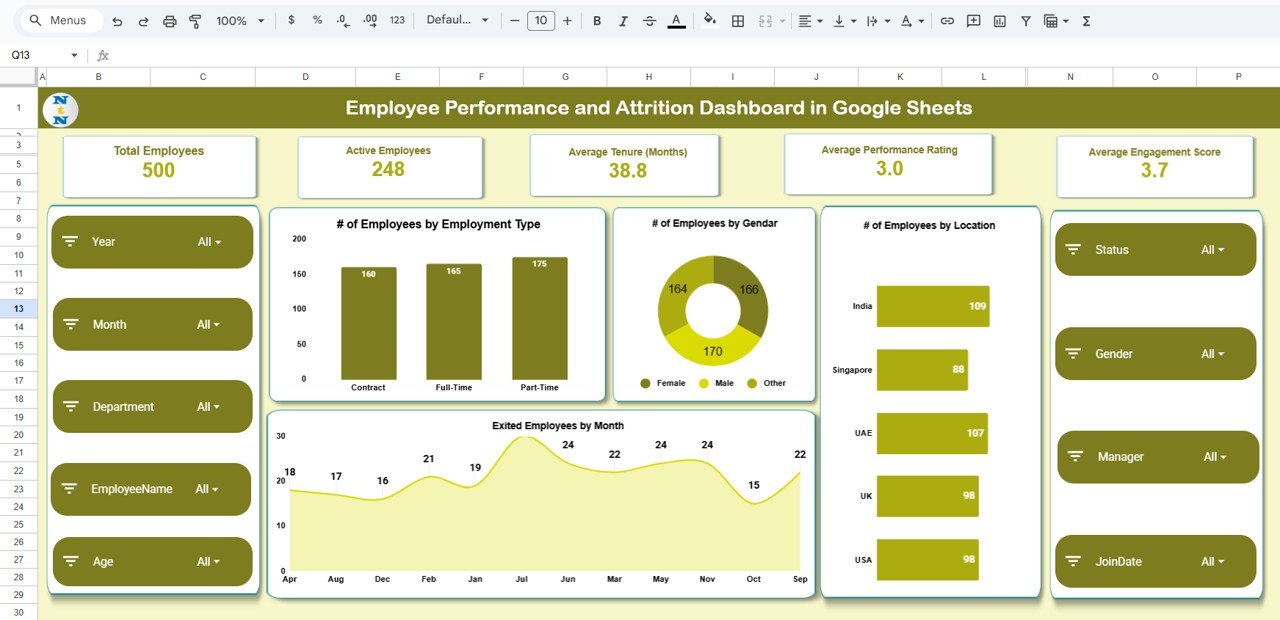
What it is: A Google Sheets dashboard that links attrition to performance ratings, so you can measure regretted attrition.
Who it is for: Teams that want to know not just how many left, but how good they were.
What is inside:
- Attrition rate tied to performance bands
- Regretted vs non-regretted exit split
- Shareable, real-time Google Sheets access
Flag every exit as regretted at offboarding and this surfaces whether you are losing your best people; share a live link with managers; no software licence required.
Price: $9.99. Get the attrition dashboard in Google Sheets.
Best for: Connecting attrition to performance.
5. Employee Retention KPI Dashboard in Excel

What it is: A KPI scorecard that tracks retention, tenure and turnover targets against actuals.
Who it is for: HR teams that report monthly KPIs to leadership.
What is inside:
- Retention rate, average tenure and turnover KPIs with targets
- Traffic-light status against goals
- Monthly trend lines
Set targets once and track red/amber/green each month; show tenure moving as retention initiatives land; a clean board-ready scorecard.
Price: $12.99. Get the retention KPI dashboard.
Best for: Monthly KPI reporting on retention.
6. Retail & E-commerce Employee Retention KPI Dashboard in Excel

What it is: A retention KPI dashboard tuned for high-churn retail and e-commerce workforces.
Who it is for: Store and fulfilment operations where seasonal and hourly turnover is the norm.
What is inside:
- Store and channel-level turnover and retention
- Seasonal and hourly-vs-salaried breakdowns
- New-hire and early-attrition tracking
Benchmark one store against the fleet; separate seasonal churn from real problem attrition; watch first-90-day drop-off during peak hiring.
Price: $14.99. Get the retail retention dashboard.
Best for: High-churn retail and e-commerce teams.
7. Environmental & Sustainability Employee Retention KPI Dashboard in Excel
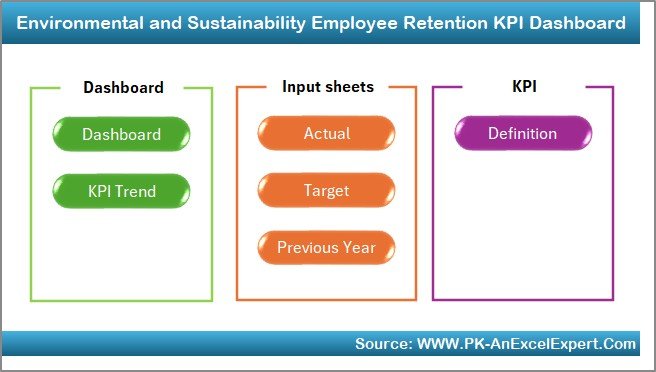
What it is: The retention KPI scorecard framed for ESG and sustainability-focused organisations.
Who it is for: Employers who report workforce stability as part of an ESG or social scorecard.
What is inside:
- Retention and turnover KPIs aligned to social metrics
- Diversity-segment turnover views
- Target-vs-actual tracking
Report workforce retention inside an ESG pack; segment turnover by demographic for a social disclosure; keep one clean source for stability metrics.
Price: $14.99. Get the ESG retention dashboard.
Best for: ESG and sustainability workforce reporting.
8. Employee Exit Tracker in Google Sheets – best value
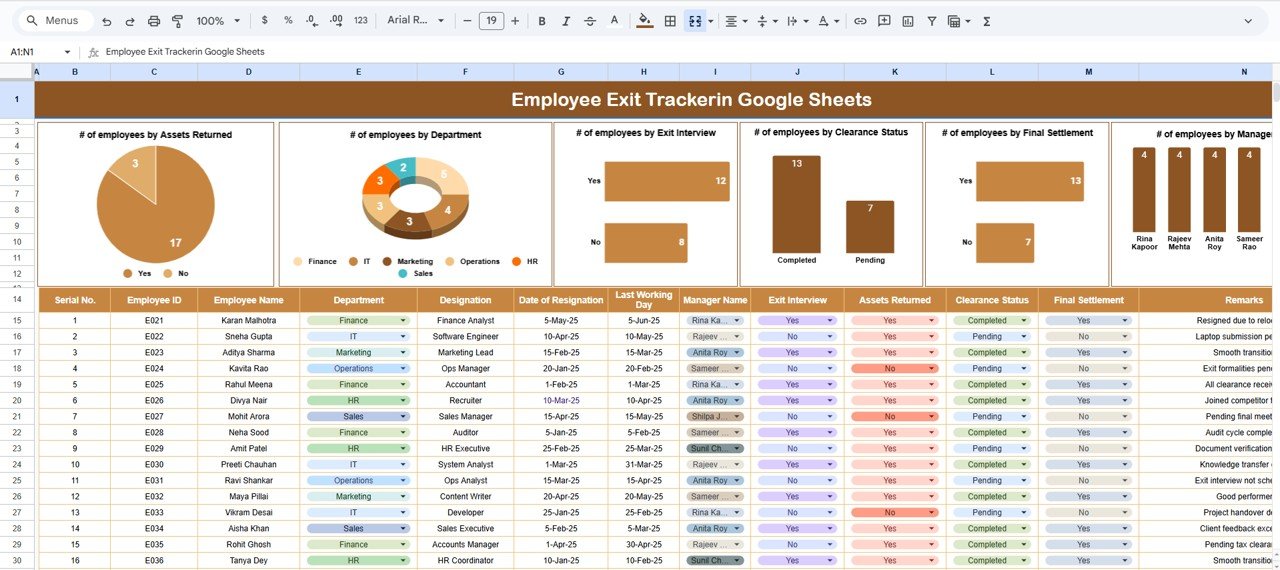
What it is: A lightweight Google Sheets tracker for logging every leaver, their reason and their tenure.
Who it is for: Small teams that need to start measuring turnover today for under $7.
What is inside:
- Exit log with reason, department and tenure
- Automatic turnover and new-hire turnover summaries
- Free, shareable Google Sheets access
Capture exit reasons the moment they happen; get a first employee turnover rate without buying software; upgrade to a full dashboard later.
Price: $6.99. Get the Employee Exit Tracker.
Best for: The cheapest way to start tracking exits.
How to choose between them
- You live in Excel and want everything: Employee Turnover Dashboard in Excel ($17.99).
- You need interactive, filterable reporting: the Power BI turnover or retention dashboard ($17.99).
- You want a shareable, no-licence tool: the Google Sheets attrition dashboard ($9.99) or Exit Tracker ($6.99).
- You report monthly KPIs: a retention KPI dashboard ($12.99-$14.99), including the retail and ESG editions.
- You are just starting: the Employee Exit Tracker, then upgrade.
For context on which format suits your team, see our guide to HR dashboards in Excel vs Google Sheets.
When a dashboard template is NOT the right answer
A spreadsheet dashboard is the wrong tool when you have thousands of employees and a live HRIS such as Workday or BambooHR – use its native analytics instead of exporting to Excel. It is also wrong when you need automated, real-time alerts, strict role-based access to sensitive personal data, or an audited system of record. And no dashboard fixes turnover on its own: it tells you where and how much, but the fix is manager coaching, pay and career design. If you only need to store records rather than compute rates, a simple employee satisfaction dashboard or an employee benefits dashboard in Excel may serve you better.
Frequently asked questions
What is a good employee turnover rate in 2026?
A healthy annual employee turnover rate is roughly 12-20% for most industries, but the right target depends heavily on your sector. Retail, hospitality and contact centres normally run far higher, while government, utilities and skilled manufacturing run lower. Compare against your own industry, not a single global number.
How do you calculate employee turnover rate?
Divide the number of separations in a period by the average headcount for that period, then multiply by 100. Average headcount is the start headcount plus the end headcount divided by two. Using average headcount, rather than the ending figure, keeps the rate accurate when your team is growing or shrinking.
What is the difference between turnover and attrition?
Turnover counts everyone who leaves, and those roles are usually refilled. Strict attrition counts departures where the role is deliberately left unfilled, shrinking headcount naturally. In everyday HR use the terms overlap, so the important thing is to define which one you mean on your dashboard and use it consistently.
What is the difference between voluntary and involuntary turnover?
Voluntary turnover is when the employee chooses to leave, such as a resignation. Involuntary turnover is when the company ends the employment, such as a layoff or performance termination. They mean opposite things for retention, so report them separately rather than as one blended turnover figure.
How is retention rate different from turnover rate?
Retention rate tracks the percentage of a starting cohort still employed at period end, ignoring new hires. Turnover rate counts everyone who left, including new hires who came and went. Because the two use different populations, retention rate does not simply equal 100% minus the turnover rate.
How much does employee turnover cost?
Most estimates put the cost of replacing an employee at 0.5x to 2x their annual salary, and higher for senior or specialised roles. The bulk is hidden: recruiting, onboarding, training, lost productivity during ramp-up and the drag on colleagues who cover the gap – not just the visible agency or job-board fee.
What is regretted attrition?
Regretted attrition is the share of departures the company wishes it had prevented, typically high performers and hard-to-replace skills. It matters more than the headline turnover rate, because losing a disengaged under-performer can be healthy while losing your best people is costly. Tag exits as regretted or non-regretted at offboarding.
What is a healthy new-hire turnover rate?
First-year turnover under 20% is generally healthy; above 30% signals a problem with hiring quality, expectation-setting or onboarding. Watch the 90-day slice too – early attrition above 10% usually means new hires are not getting the ramp-up or clarity they were promised during recruiting.
Which dashboard should I use to track employee turnover rate?
For Excel users who want the complete metric suite, the Employee Turnover Dashboard in Excel ($17.99) is the best overall choice. If you need interactive filtering, use the Power BI version. To start cheaply, the Employee Exit Tracker in Google Sheets ($6.99) is the best value entry point.
Can I track employee turnover rate in Google Sheets?
Yes. The Employee Exit Tracker and the Employee Performance & Attrition Dashboard both run entirely in Google Sheets, need no software licence, and can be shared with a live link. They calculate turnover and new-hire turnover automatically, making Sheets a strong option for smaller or distributed teams.
Get more employee turnover templates
Start measuring today: the Employee Turnover Dashboard in Excel ($17.99) is our best overall pick, and the Employee Exit Tracker in Google Sheets ($6.99) is the best value way to begin. Browse the full range of employee retention and turnover dashboards in Excel, Google Sheets and Power BI on NextGenTemplates, and subscribe to NextGenTemplates on YouTube for walkthroughs of every dashboard.