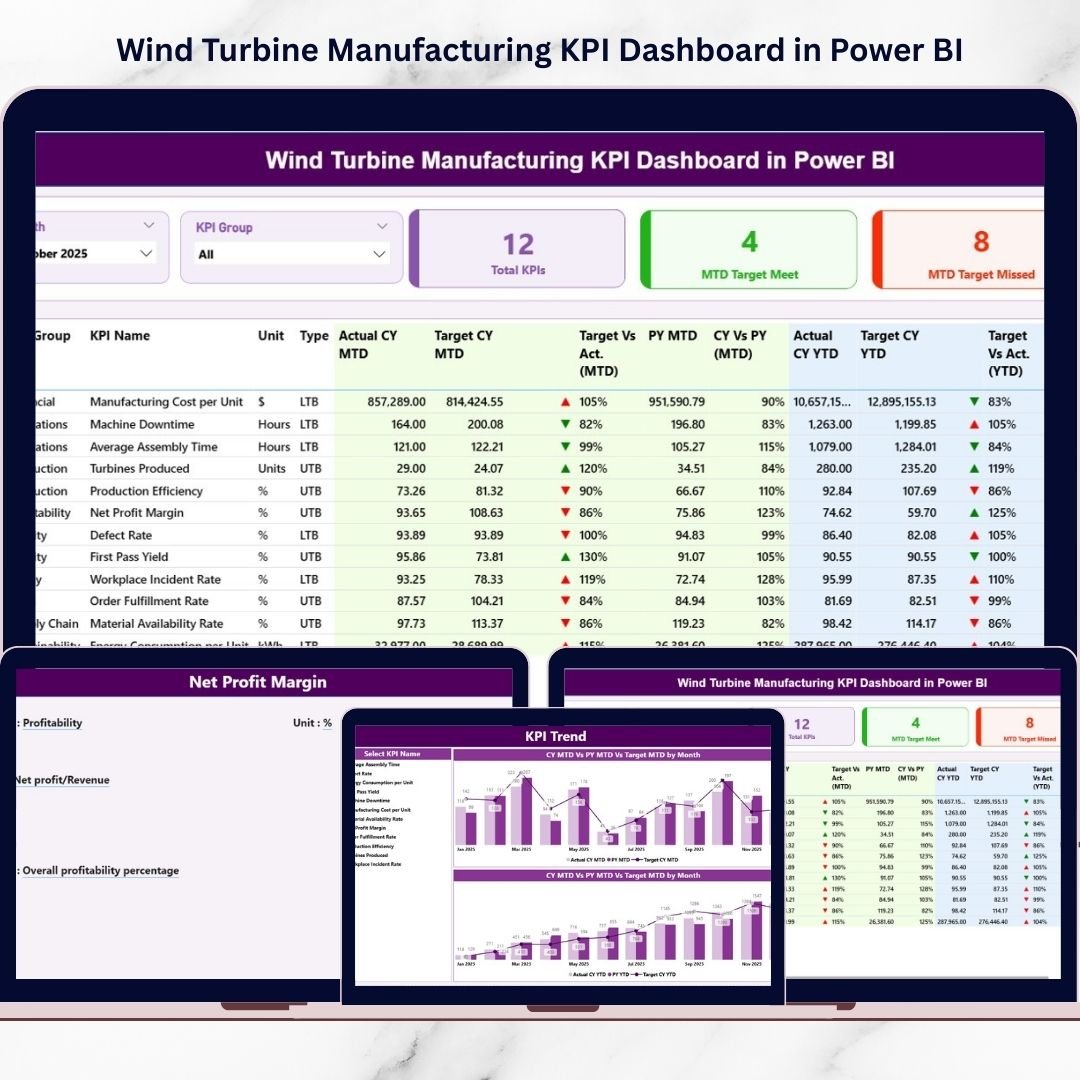

Wind Turbine Manufacturing KPI Dashboard in Power BI

Power BI - instant download

Original price was: ₹1,799.00.Current price is: ₹1,199.00.
Details, requirements and demo below
Sale!

Wind Turbine Manufacturing KPI Dashboard in Power BI

Original price was: ₹1,799.00.Current price is: ₹1,199.00.

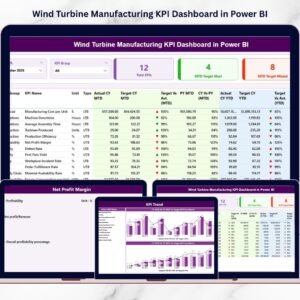
Optimize renewable manufacturing performance using the Wind Turbine Manufacturing KPI Dashboard in Power BI — an interactive solution for tracking production KPIs, targets, and trends in real time.

🔹 📊 Central KPI Dashboard – Monitor manufacturing performance from one screen.
🔹 🎯 Target vs Actual Insights – Instantly identify performance gaps.
🔹 📈 MTD & YTD Tracking – Analyze both monthly and yearly progress.
🔹 📉 Trend Analysis Charts – Detect performance patterns quickly.
🔹 🔄 Year-over-Year Comparison – Measure growth and improvement clearly.
🔹 ⚡ Interactive Filters – Explore KPIs dynamically using slicers.
🔹 📂 Excel Data Integration – Use existing operational data easily.
🔹 🚀 Automated Reporting – Reduce manual reporting effort.
🔹 🧩 Fully Customizable Dashboard – Adapt KPIs to manufacturing needs.

- +

💡 Buy any 2 templates and save 20% automatically at checkout.

Pricing country
Prices follow your selected country; checkout uses your billing country.
Excel Pivot Tables & Dashboards: Basic to Advanced courseLaunch offer
🎓 NEXTGENTEMPLATES ACADEMY
Like this dashboard? Learn to build your own.
Excel Pivot Tables & Dashboards: Basic to Advanced

From your first Pivot Table to the Data Model, DAX, Power Query and a one-page KPI dashboard. 11h 51m of video by PK, with practice files, quizzes and a capstone.

The renewable energy industry is expanding rapidly, and wind turbine manufacturers must continuously improve productivity, control operational costs, and maintain strict quality standards. However, relying on scattered spreadsheets and manual reporting often creates delays, data confusion, and slow decision-making.

The Wind Turbine Manufacturing KPI Dashboard in Power BI provides a modern, intelligent solution.

This ready-to-use interactive dashboard transforms manufacturing data into powerful visual insights. Instead of reviewing multiple reports, managers can monitor KPIs, compare targets with actual performance, analyze trends, and identify production gaps — all within one centralized Power BI environment.

Designed specifically for wind turbine manufacturing operations, this dashboard empowers organizations to make faster, smarter, and data-driven decisions while improving operational efficiency.


🔑 Key Feature of Wind Turbine Manufacturing KPI Dashboard in Power BI

📊 Centralized KPI Monitoring
Track all manufacturing performance indicators in one unified dashboard.

🎯 Target vs Actual Performance Analysis
Instantly measure production achievement using automated calculations.

📈 MTD & YTD Performance Tracking
Monitor both short-term and long-term manufacturing performance.

🔄 Year-over-Year Comparison
Evaluate growth using Previous Year vs Current Year analytics.

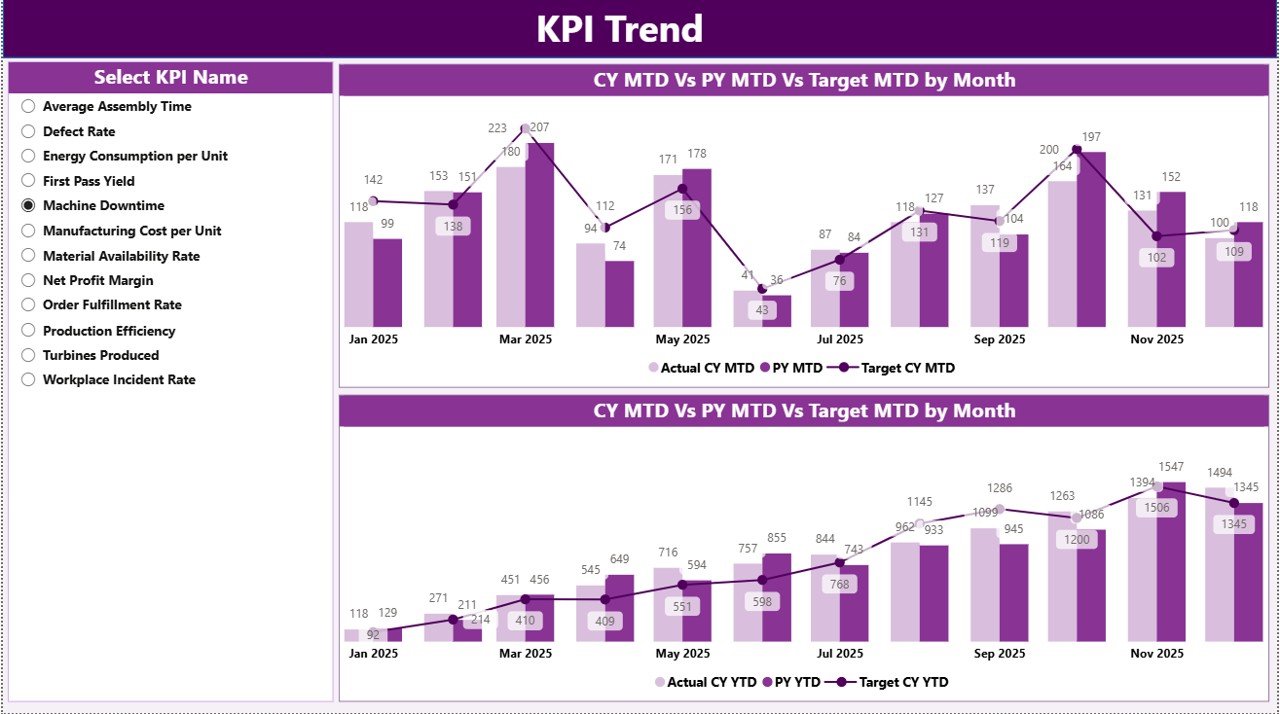
📉 Interactive KPI Trend Analysis
Visual combo charts reveal performance patterns and operational trends.

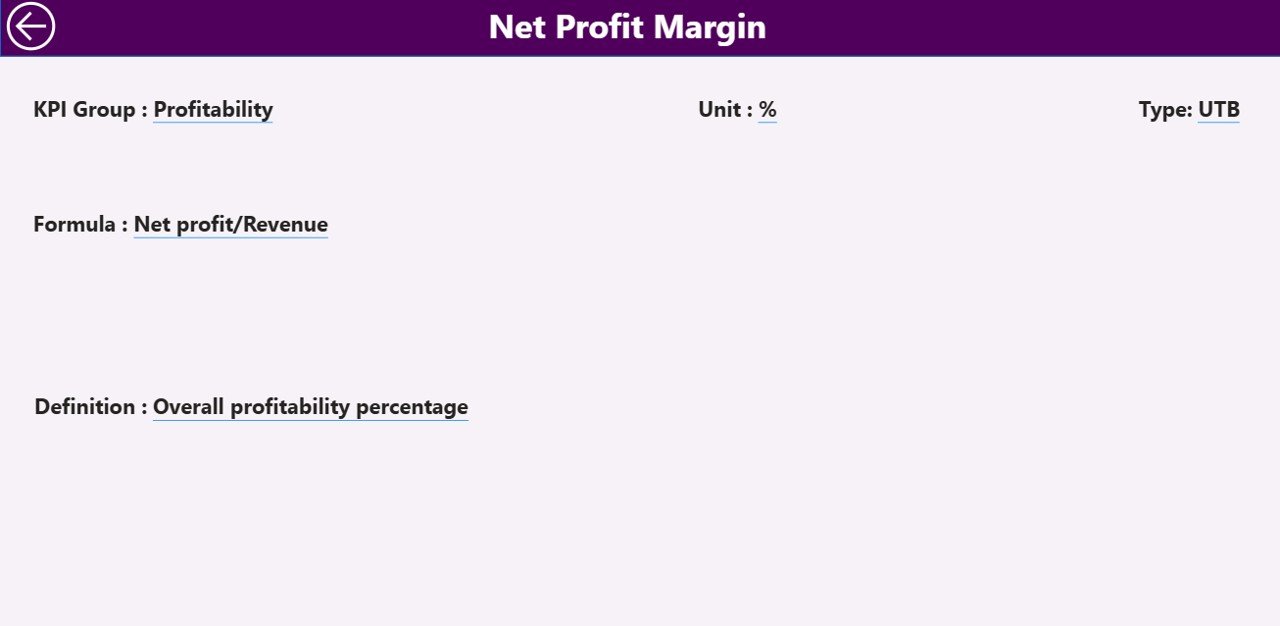
🧩 KPI Drill-Through Definition Page
Understand KPI formulas, logic, and measurement standards instantly.

⚡ Dynamic Power BI Slicers
Filter dashboards by month or KPI group in real time.

📂 Excel-Based Data Integration
Connect easily with existing Excel operational datasets.

🚀 Automated Visual Updates
Refresh data and instantly update the entire dashboard.


📦 What’s Inside the Wind Turbine Manufacturing KPI Dashboard in Power BI

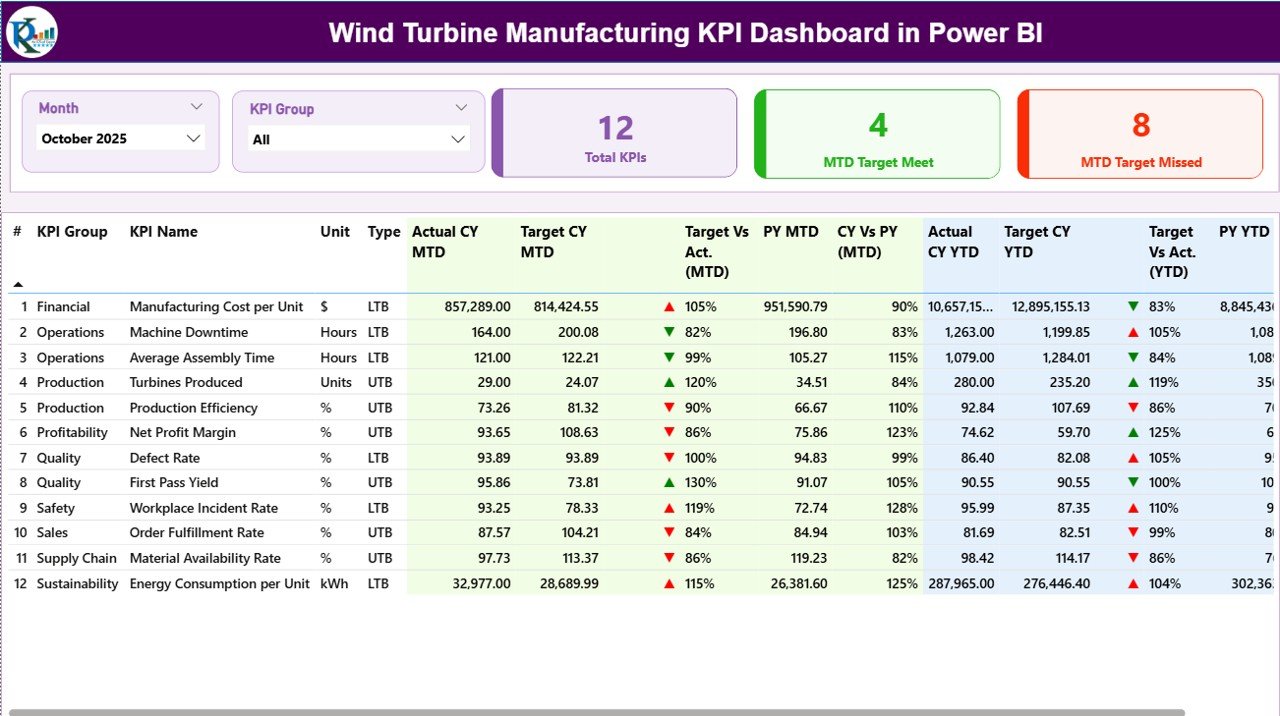
The dashboard includes three powerful analytical pages:
Wind Turbine Manufacturing KPI Dashboard

✔️ Summary Page – Overall KPI performance overview
✔️ KPI Trend Page – Historical performance and trend analysis
✔️ KPI Definition Page – Detailed KPI formulas and explanations

Supporting Excel data structure includes:

  • Input_Actual Sheet (Actual KPI values)

  • Input_Target Sheet (Performance targets)

  • KPI Definition Sheet (KPI metadata and logic)

This structure ensures accurate, scalable, and easy performance monitoring.


🛠️ How to Use the Wind Turbine Manufacturing KPI Dashboard in Power BI

Follow these simple steps:

Step 1: Enter Actual KPI data in Excel input sheets
Step 2: Add monthly targets and KPI definitions
Step 3: Load Excel data into Power BI
Step 4: Refresh the dashboard dataset
Step 5: Use slicers to analyze performance dynamically
Step 6: Review KPI cards and trend visuals for insights

Within minutes, your organization gains a professional manufacturing analytics system.


🎯 Who Can Benefit from This Wind Turbine Manufacturing KPI Dashboard in Power BI

This dashboard is ideal for:

✅ Wind Turbine Manufacturers
✅ Renewable Energy Production Teams
✅ Plant Managers & Supervisors
✅ Manufacturing Analysts
✅ Quality Assurance Teams
✅ Operations & Strategy Managers
✅ Supply Chain Leaders

Whether managing a single plant or multi-location production operations, this dashboard supports scalable performance analysis.


Why This Dashboard Improves Manufacturing Performance

Instead of manual reporting, you gain:

✔️ Real-time production visibility
✔️ Faster issue identification
✔️ Improved quality monitoring
✔️ Better production planning
✔️ Data-driven operational decisions
✔️ Enhanced accountability across teams

As a result, manufacturers improve efficiency and strengthen competitiveness in the renewable energy sector.


### Click hare to read the Detailed blog post

📺 Visit our YouTube channel to learn step-by-step video tutorials

👉 Youtube.com/@PKAnExcelExpert
Watch the step-by-step video tutorial:

Frequently asked questions

What do I need to open it?
Power BI Desktop, which is free from Microsoft (Windows). No Power BI Pro licence is needed to open, edit or refresh the file.
Does it work on Mac?
Power BI Desktop runs on Windows only. On a Mac you can use a Windows virtual machine, or publish the report to the Power BI Service and view it in a browser.
What is in the download?
The .pbix report and the Excel data file that feeds it (newer products also include a PDF user manual).
How do I use my own data?
Paste your data over the sample rows in the Excel file (keep the column headers), then click Home > Refresh in Power BI Desktop. To use a different file, use Transform data to point the source to it.
Do I need Power BI Pro?
Only if you want to publish the report to the Power BI Service and share it online with colleagues. Opening and editing on your PC is free.
Can I edit the visuals?
Yes - every page, visual, measure and colour is editable in Power BI Desktop.
Is it a one-time payment or a subscription?
One-time payment. No subscription, no per-user fees and nothing to renew - the file is yours to keep.
How do I get the file after payment?
Instantly. The download link appears on screen after checkout, is emailed to you, and stays under My Account > Downloads on our website. If the email does not arrive within a few minutes, check your spam or promotions folder.
Is a user manual included?
Most of our newer products include a PDF user manual in the download. If yours does not have one, message us with your order number and we will send it.
Do I get free updates?
Bug fixes are always free - if something does not work as described, we fix it and send you the corrected file. New versions with new features are not included in the price, unless this product's description says otherwise.
Can you customise it for me?
Yes. Small changes to this template (your columns, categories, logo, colours, minor layout) cost the template price plus $40-80 (Rs 3,000-6,000 + GST), quoted once you send your list. A fully custom build is usually $100-200 (Rs 8,000-18,000 + GST) with two revision rounds. Email your requirements to [email protected] or message us on WhatsApp.
Can I use it for my business or my clients?
Yes, for your own personal or internal business use, for as long as you like. Reselling or redistributing the template is not allowed.
What is your refund policy?
Because these are digital downloads, they are non-refundable once delivered - except when the product does not match its description (report it within 48 hours of purchase) or there is a technical problem our team cannot fix within 72 hours. Email [email protected] with your order number.
How do I get help?
Email [email protected] (Mon-Fri, 10 AM-7 PM IST) or message us on WhatsApp +91 80770 90260 (chat only, no calls). Please include your order number.

Still have a question? Click Need help? at the bottom-left to ask our assistant, or message us on WhatsApp.

Application

Power BI

Template Type

KPI Dashboard

Price

Paid

Business Or Department

Production and Manufacturing

Wind Turbine Manufacturing KPI Dashboard in Power BIWind Turbine Manufacturing KPI Dashboard in Power BI
Original price was: ₹1,799.00.Current price is: ₹1,199.00.
- +
Scroll to Top