

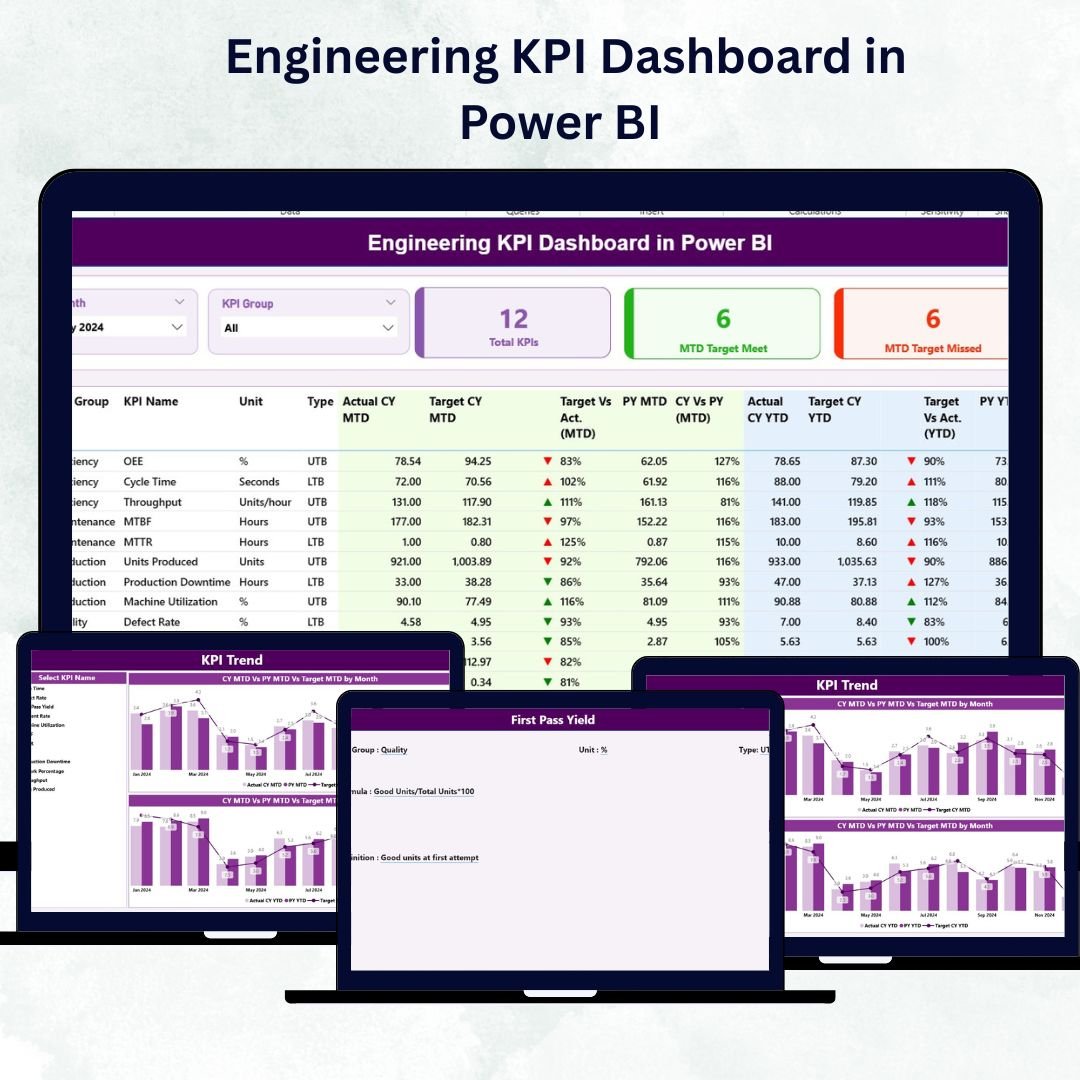

In a world where engineering excellence drives business success, data is the foundation for smarter decisions. The Engineering KPI Dashboard in Power BI 💡 transforms complex performance data into simple, visual insights — helping you track productivity, efficiency, quality, and resource utilization with just a glance.
Built on Microsoft Power BI and powered by Excel data, this ready-to-use dashboard gives engineering leaders real-time visibility across multiple projects and departments. It eliminates the guesswork, automates analysis, and delivers clear visuals that empower data-driven engineering management.
⚡ Key Features of Engineering KPI Dashboard in Power BI
✅ Comprehensive Performance View: Consolidates all engineering KPIs — from production yield to project efficiency — in one place.
✅ Interactive Filters: Month and KPI Group slicers for quick, dynamic analysis.
✅ Automated Cards & KPIs: Displays Total KPI Count, MTD Target Met, and MTD Target Missed automatically.
✅ Drill-Through Analysis: Click any KPI to view detailed trends and definitions instantly.
✅ MTD, YTD & PY Comparisons: Monitor Month-to-Date, Year-to-Date, and Previous Year data side by side.
✅ Dynamic Visuals: Combo charts, color-coded arrows (▲ / ▼), and conditional formatting simplify performance tracking.
✅ Excel Powered Source: Easily refresh data through linked Excel sheets for Actuals, Targets, and Definitions.
✅ Fully Customizable: Add or edit KPIs, thresholds, or visuals without coding.
✅ Professional Reports: Ready for executive meetings and engineering reviews.
✅ Seamless Automation: Refreshes data automatically — saving time and improving accuracy.
With this dashboard, engineers and executives get an instant, 360° view of performance to boost productivity, reduce waste, and ensure projects stay on track.
🧩 What’s Inside the Engineering KPI Dashboard in Power BI
The template includes three interactive pages plus a connected Excel data model:
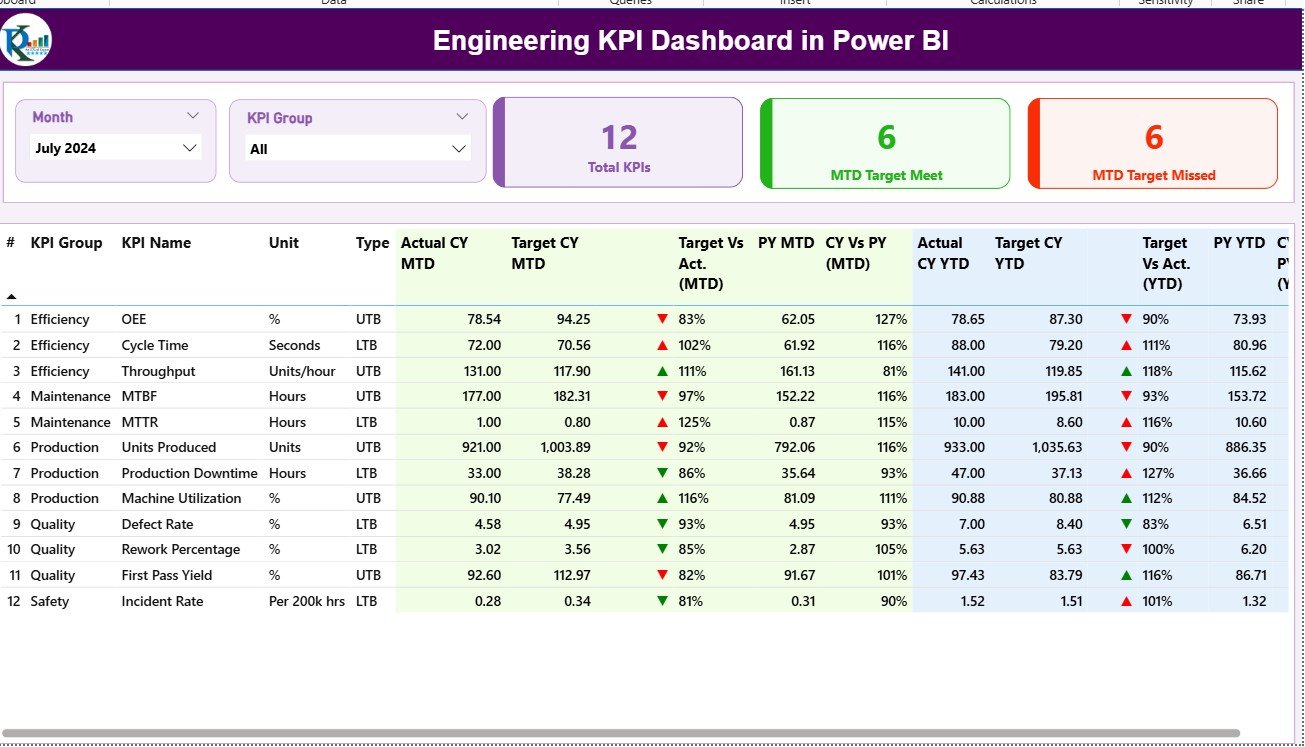
1️⃣ Summary Page – Your Performance Overview
The main page for real-time analysis.
Month and KPI Group slicers filter results dynamically.
Cards show Total KPIs, Target Met, and Target Missed.
Detailed table displays KPI Name, Unit, Type (UTB/LTB), MTD and YTD Actual vs Target, and Previous Year comparisons.
Conditional icons (green ▲ / red ▼) highlight performance status.
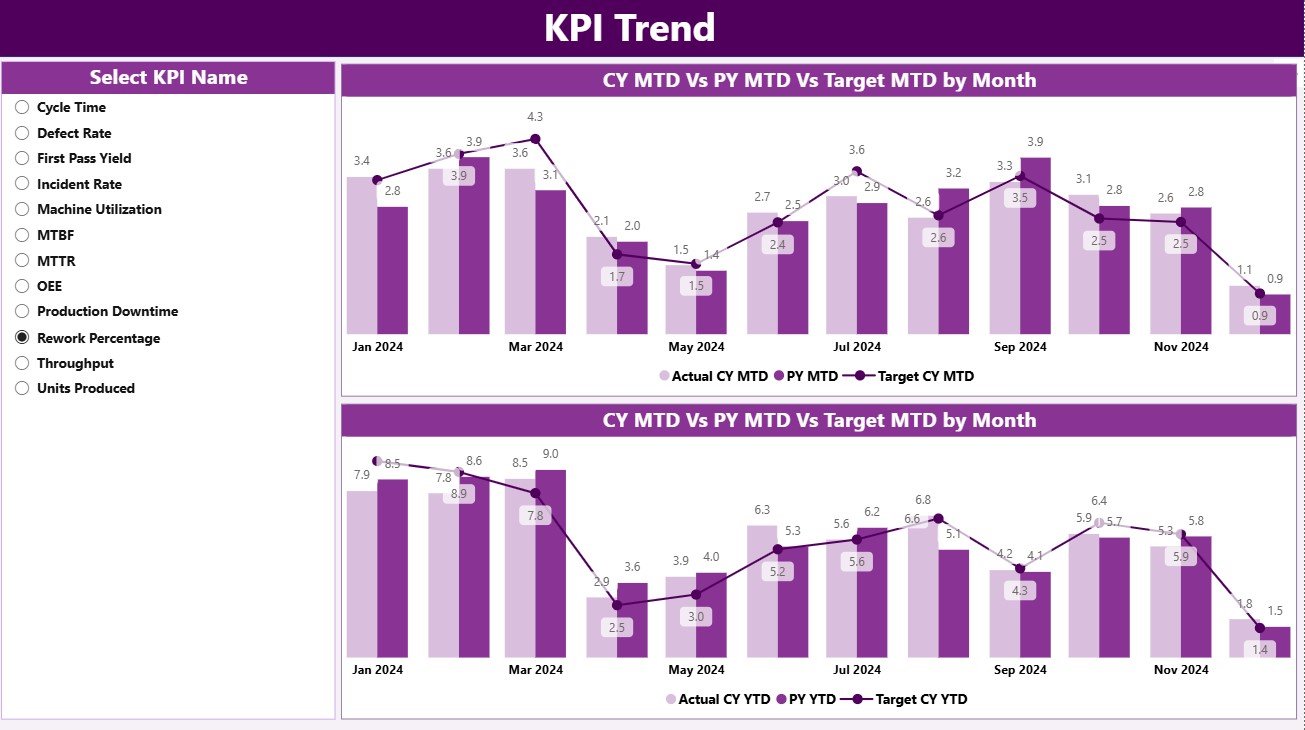
2️⃣ KPI Trend Page – Visualize Progress Over Time
Analyze how each KPI performs across months or years.
KPI slicer lets you select any metric to view trends.
Dual combo charts display MTD and YTD Actual vs Target vs PY values.
Ideal for engineering reviews and root-cause analysis.
3️⃣ KPI Definition Page – Reference and Transparency
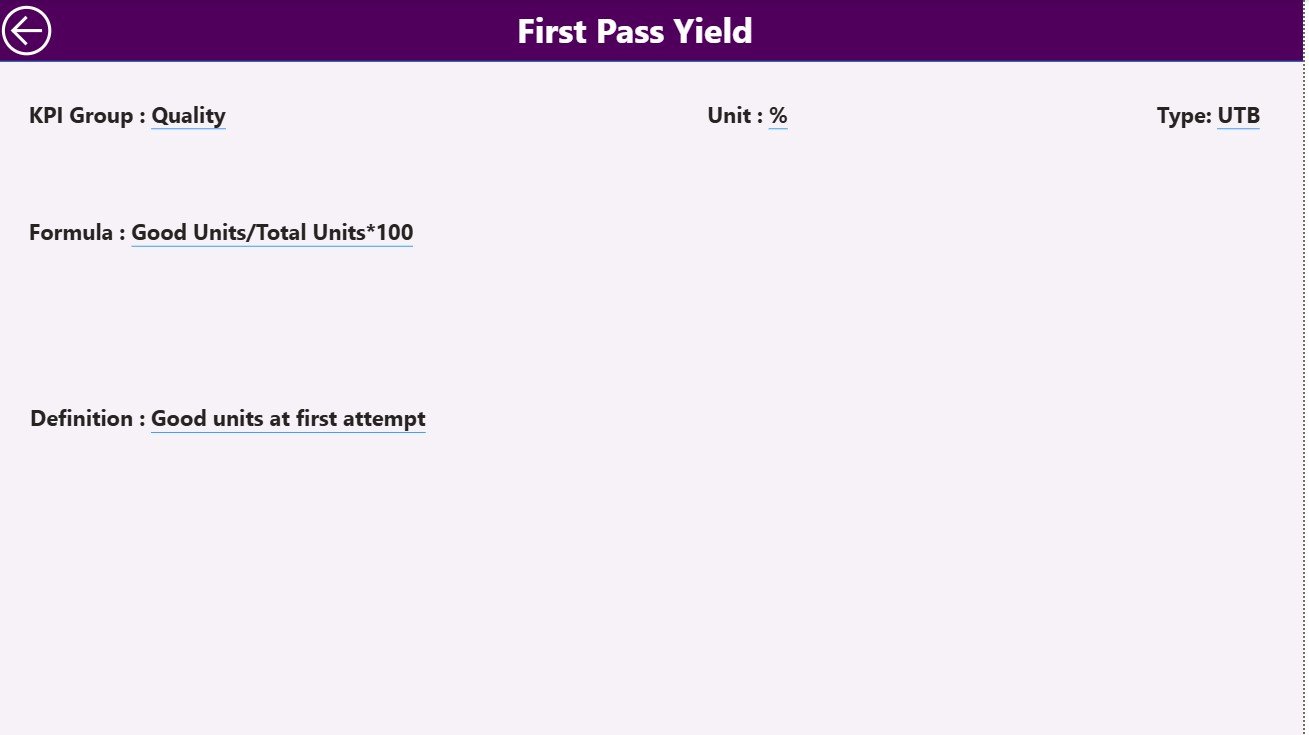
A drill-through page that shows Formula, Definition, Unit, and Type for every KPI.
Includes a Back button to return to the main dashboard.
🔗 Excel Data Model Includes:
Input_Actual – Enter monthly MTD & YTD Actual values.
Input_Target – Record monthly and annual Targets.
KPI Definition – Maintain KPI Group, Name, Unit, Formula, Definition, and Type.
Together, these elements deliver a complete end-to-end reporting solution for engineering operations.
🧠 How to Use the Engineering KPI Dashboard in Power BI
⚙️ Step 1: Prepare your Excel file with Actual, Target, and Definition data.
📊 Step 2: Connect the Excel file to Power BI and load the tables.
🎯 Step 3: Refresh the dashboard to view updated KPI cards and charts.
📈 Step 4: Use filters and drill-throughs to analyze specific KPIs.
📘 Step 5: Share reports with teams for collaborative decision-making.
In just minutes, your engineering data transforms into a live performance dashboard ready for action.
👥 Who Can Benefit from This Dashboard
👨🏭 Engineering Managers: Monitor efficiency, quality, and resource allocation.
🏗️ Project Leads: Track deadlines, budgets, and delivery performance.
⚙️ Operations Teams: Spot process bottlenecks and improve throughput.
📊 Executives & Analysts: Review strategic KPI trends for decision-making.
💼 Manufacturing & Industrial Firms: Standardize performance measurement across plants and teams.
This dashboard empowers every engineering professional to turn data into insight and insight into action.
🔗 Click here to read the Detailed Blog Post
🎥 Visit our YouTube channel for step-by-step tutorials
👉 YouTube.com/@PKAnExcelExpert
Watch the step-by-step video tutorial:
Compatibility and Requirements
- Works in Power BI Desktop, which is free to download. Microsoft explains the install in Get Power BI Desktop.
- The data comes from a connected Excel file with the Input_Actual, Input_Target and KPI Definition sheets.
Frequently Asked Questions
Which pages are included?
Three pages: Summary, KPI Trend and KPI Definition. The template also connects to an Excel file with Input_Actual, Input_Target and KPI Definition sheets.
Where do I enter my data?
Enter monthly MTD and YTD actual values in Input_Actual and your targets in Input_Target. Maintain the KPI group, name, unit, formula, definition and type in the KPI Definition sheet, then refresh the report in Power BI.
Can I filter the Summary page?
Yes. The Month and KPI Group slicers filter the cards and the table. The cards show Total KPI Count, MTD Target Met and MTD Target Missed.
How do I see the trend for one KPI?
Open the KPI Trend page and pick a KPI in the slicer. The combo charts show MTD and YTD actual against target and previous year.
Is there an Excel or Google Sheets version?
There is an Engineering KPI Dashboard in Excel and an Engineering Dashboard in Google Sheets.
Related Engineering Templates
- Engineering KPI Dashboard in Excel: the same KPI set in Excel
- Engineering Dashboard in Power BI: another engineering view in Power BI
- Engineering Dashboard in Google Sheets: an engineering dashboard for Google Sheets
- Operations KPI Dashboard in Power BI: KPIs for day-to-day operations
- Power BI Dashboard Mega Collection: 15 Power BI templates in one download
Browse all Power BI KPI dashboards.
















Reviews
There are no reviews yet.