

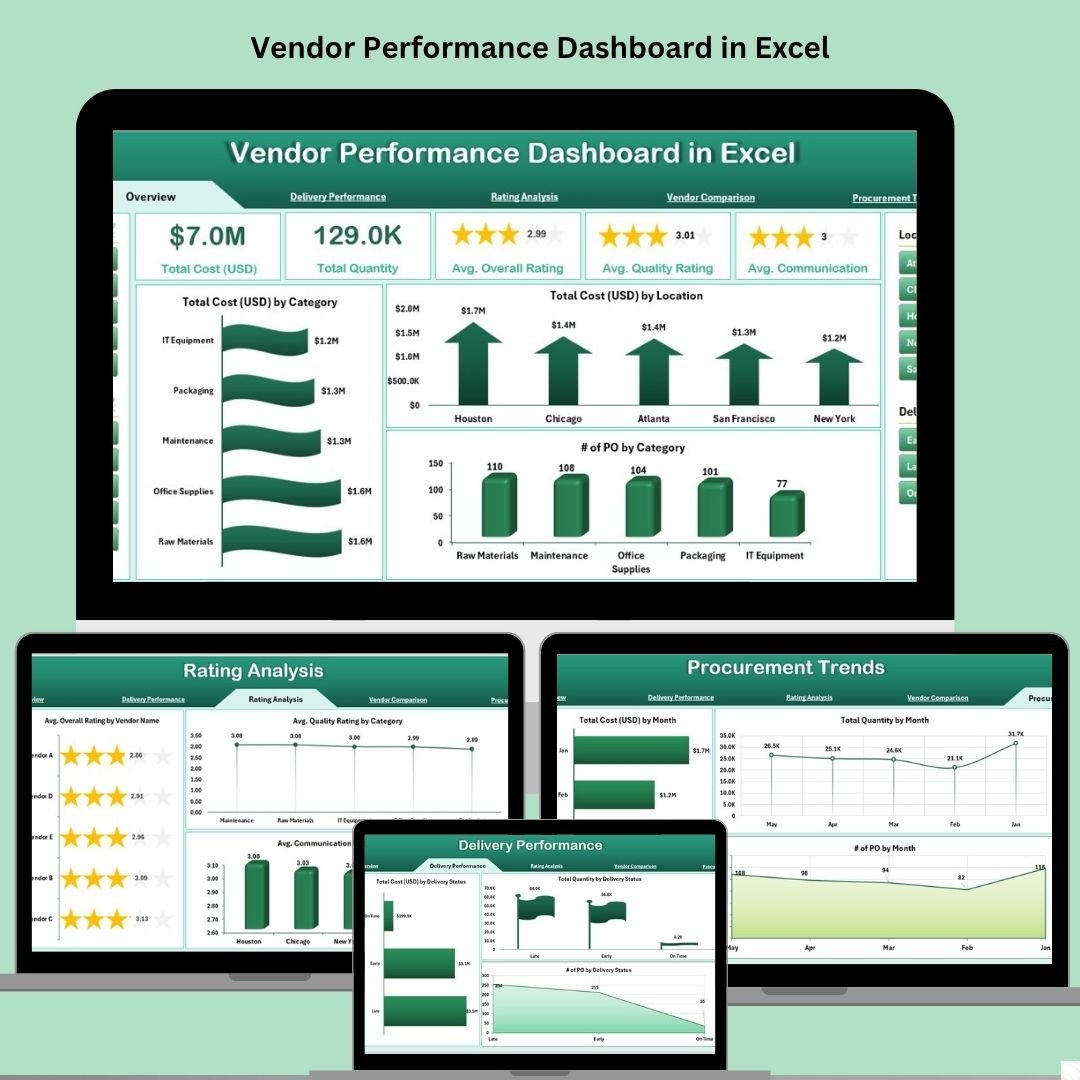

This ready-to-use Excel template is packed with powerful visuals, slicers, and advanced analytics — no coding or external tools required. From cost breakdowns and delivery performance to rating trends and vendor comparisons, this dashboard gives you the complete picture in one place.
🧩 Key Features of Vendor Performance Dashboard
🧭 Interactive Page Navigator
Jump between 5 performance views instantly using the built-in menu.
📋 Overview Page
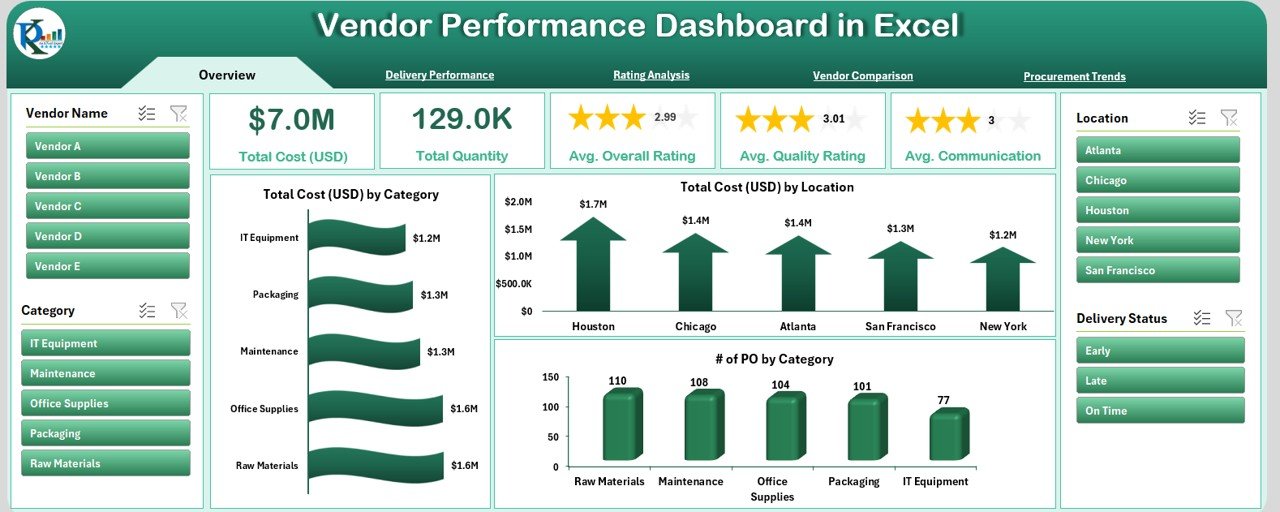
5 summary cards (e.g., Total Orders, Vendors)
Charts for cost by category and location
Purchase order trends at a glance
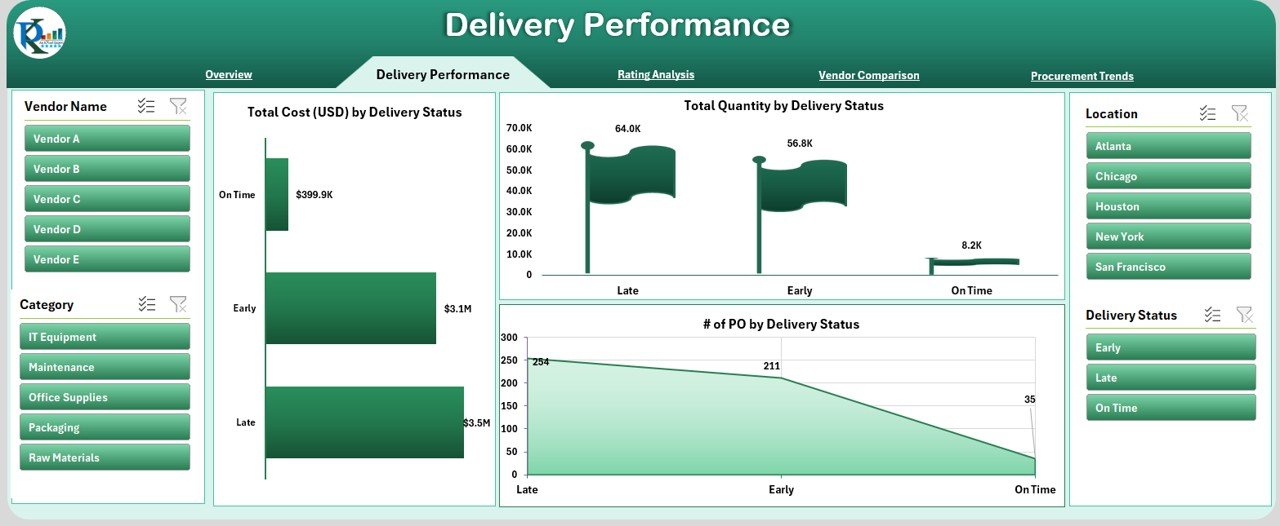
🚚 Delivery Performance Page
See cost, quantity, and POs by delivery status
Quickly identify late or incomplete deliveries
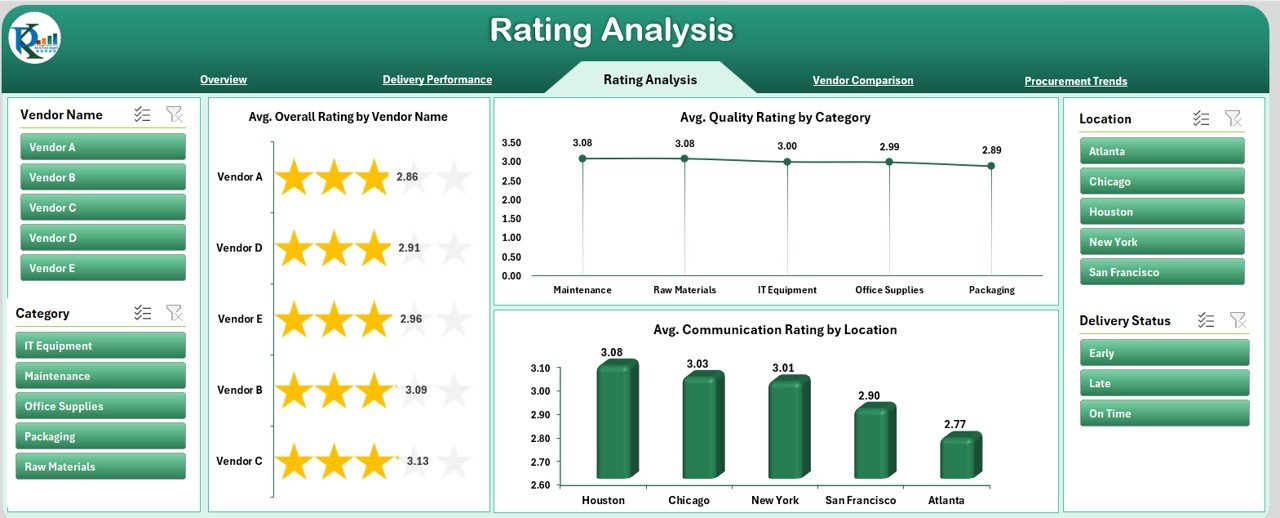
⭐ Rating Analysis Page
Average quality and communication ratings
Vendor-level performance visualized beautifully
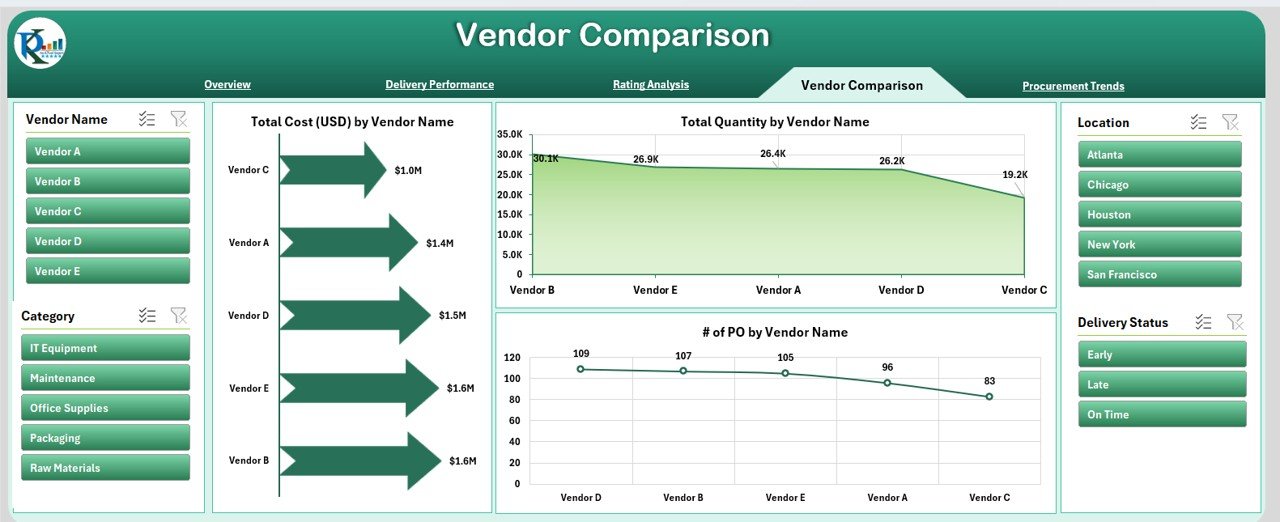
⚖️ Vendor Comparison Page
Compare vendors by cost, quantity, and PO count
Perfect for evaluating procurement efficiency
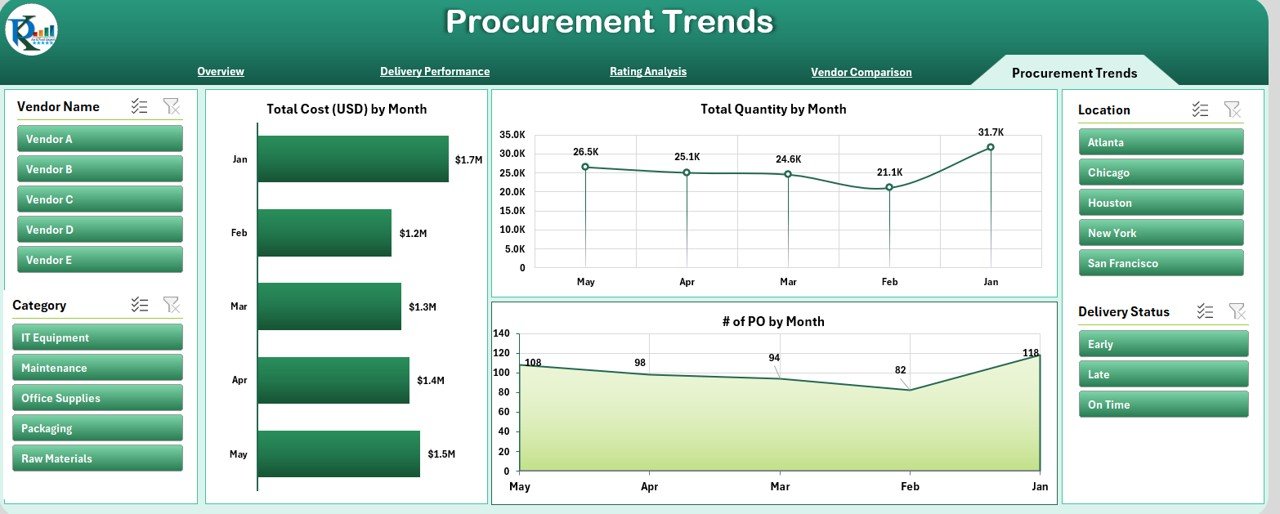
📈 Procurement Trends Page
Monthly cost, quantity, and PO trends
Spot seasonal patterns or inconsistencies
📦 What’s Inside the Dashboard?
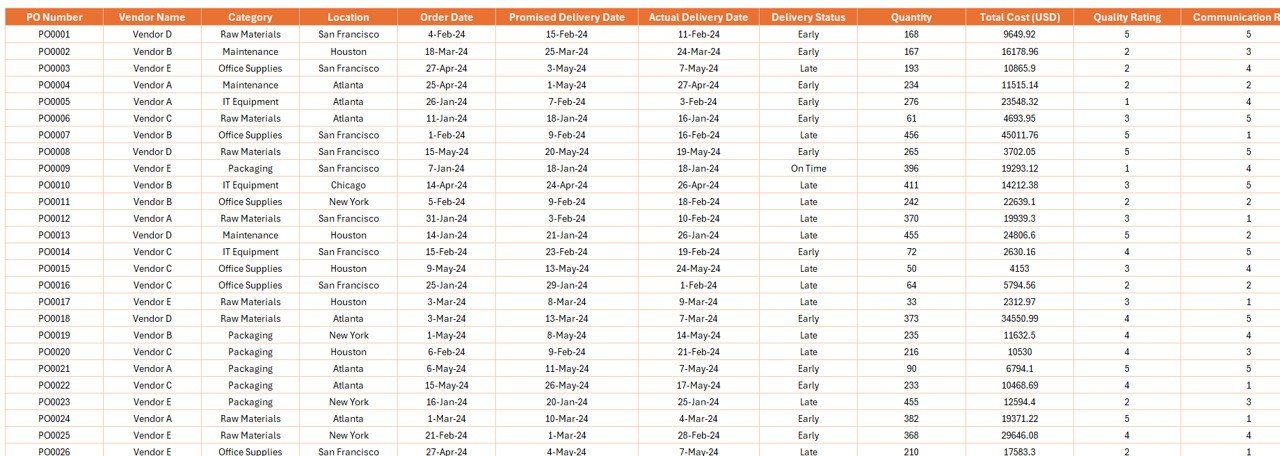
🧾 Data Sheet: Raw data like PO number, vendor name, cost, delivery dates, and ratings
🛠️ Support Sheet: Dropdowns and slicers for interactivity
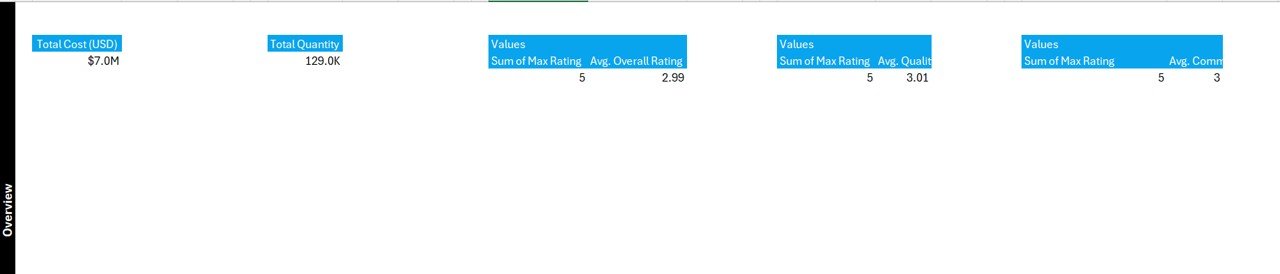
📊 5 Analytical Pages: Ready-made charts and metrics powered by PivotTables
This dashboard is built entirely with Excel tools you already know — PivotTables, slicers, data bars, and conditional formatting.
💡 How to Use the Dashboard
Prepare Your Data – Fill in the data sheet with vendor records.
Explore the Dashboard – Use slicers to filter by vendor, category, or location.
Analyze Metrics – View delivery delays, cost trends, and rating patterns.
Make Data-Driven Calls – Use the visuals to assess performance and improve vendor decisions.
Customize if Needed – Add columns, update charts, or reformat visuals — all in Excel.
🧑💼 Who Can Benefit from This Dashboard?
✅ Procurement Teams – Spot inefficiencies and save on costs
✅ Vendor Managers – Evaluate supplier quality and communication
✅ Operations Teams – Get real-time performance snapshots
✅ SMEs & Enterprises – Use in any industry like retail, manufacturing, or healthcare
Whether you’re tracking 5 vendors or 500, this dashboard scales effortlessly.
🔥 Why Excel for Vendor Performance Tracking?
Unlike complex BI tools, Excel is:
💸 Cost-Effective – No software subscription needed
🧰 Customizable – Modify formulas, add columns, change visuals
📤 Shareable – Export to PDF or share over email
🧩 Expandable – Easily integrate with Power Query or Power BI later
📈 Pro Tips to Enhance Performance
🔍 Use slicers for dynamic filtering
📉 Apply conditional formatting for visual clarity
🔁 Use COUNTIFS and AVERAGEIFS for KPI metrics
🔐 Protect the sheet to avoid accidental edits
📬 Add VBA to automate monthly email reports
📌 Future Ready and Scalable
Start in Excel. Grow into Power BI. With simple tweaks, this dashboard can be:
Integrated with live data
Automated using Power Query
Converted into a cloud-based web dashboard
✅ Click here to read the Detailed blog post
📺 Visit our YouTube channel to learn step-by-step video tutorials
👉 youtube.com/@PKAnExcelExpert
















Reviews
There are no reviews yet.