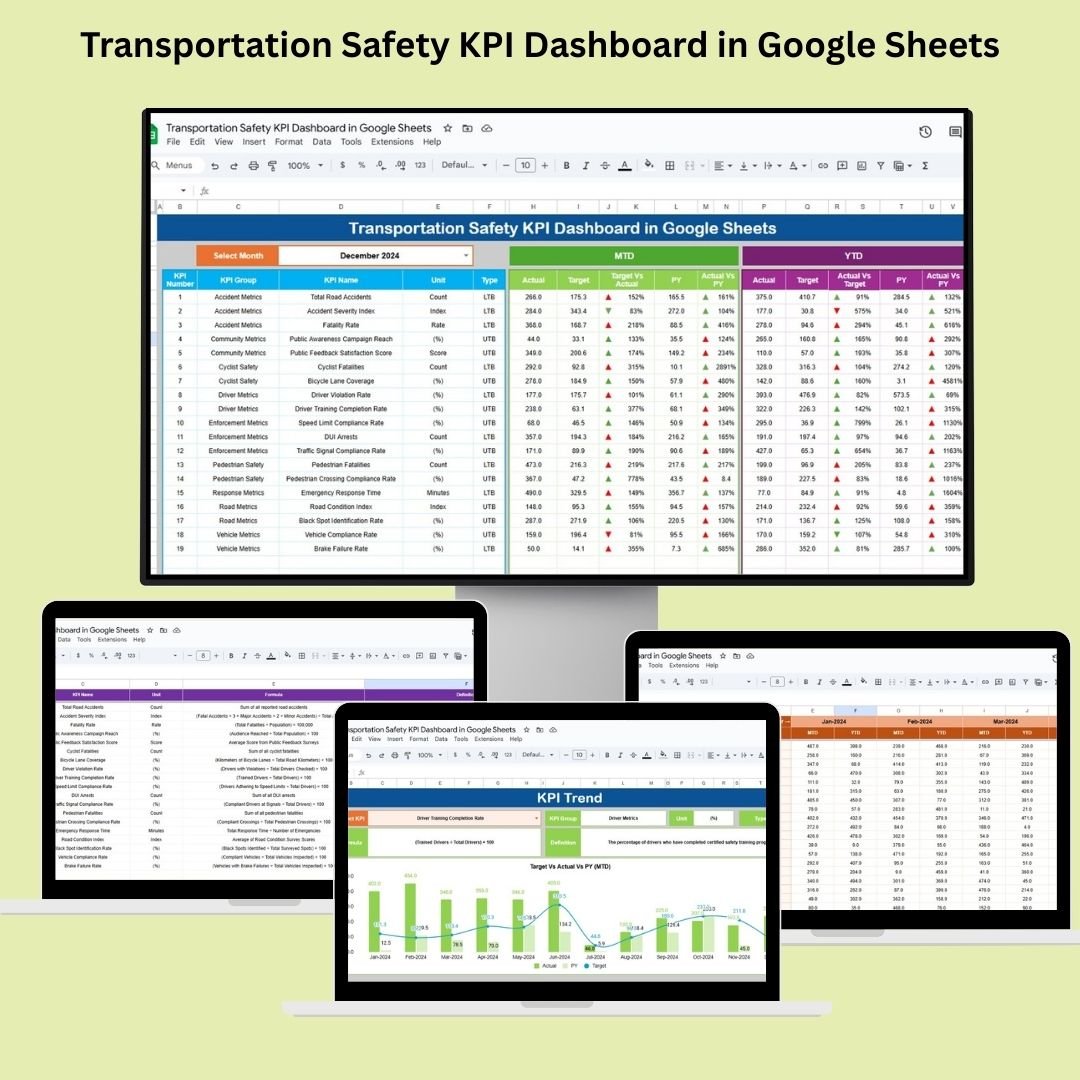
The Transportation Safety KPI Dashboard in Google Sheets is a robust, easy-to-use tool designed for fleet managers, safety officers, and transportation analysts. It helps you monitor and manage essential safety metrics to ensure that your fleet operates efficiently and safely. Whether you’re tracking accidents, driver behavior, or vehicle compliance, this dashboard offers real-time insights that enable data-driven decisions to improve safety standards.
🔑 Key Features of the Transportation Safety KPI Dashboard:
-
Real-Time Performance Tracking: Stay up-to-date with MTD (Month-to-Date), YTD (Year-to-Date), and previous year data to quickly identify safety issues.
-
Target vs. Actual Comparison: Visualize performance gaps using easy-to-read metrics and conditional formatting (up/down arrows).
-
Comprehensive Safety Metrics: Track accident rates, driver behavior, vehicle compliance, and more in one place.
-
Customizable Structure: Tailor the dashboard to fit your fleet’s unique safety metrics and needs.
-
KPI Trend Analysis: View long-term trends and take proactive action to address safety issues before they escalate.
What’s Inside the Transportation Safety KPI Dashboard 🛠️📊
Inside this Transportation Safety KPI Dashboard, you’ll find six essential worksheets designed to track and analyze your fleet’s safety performance:
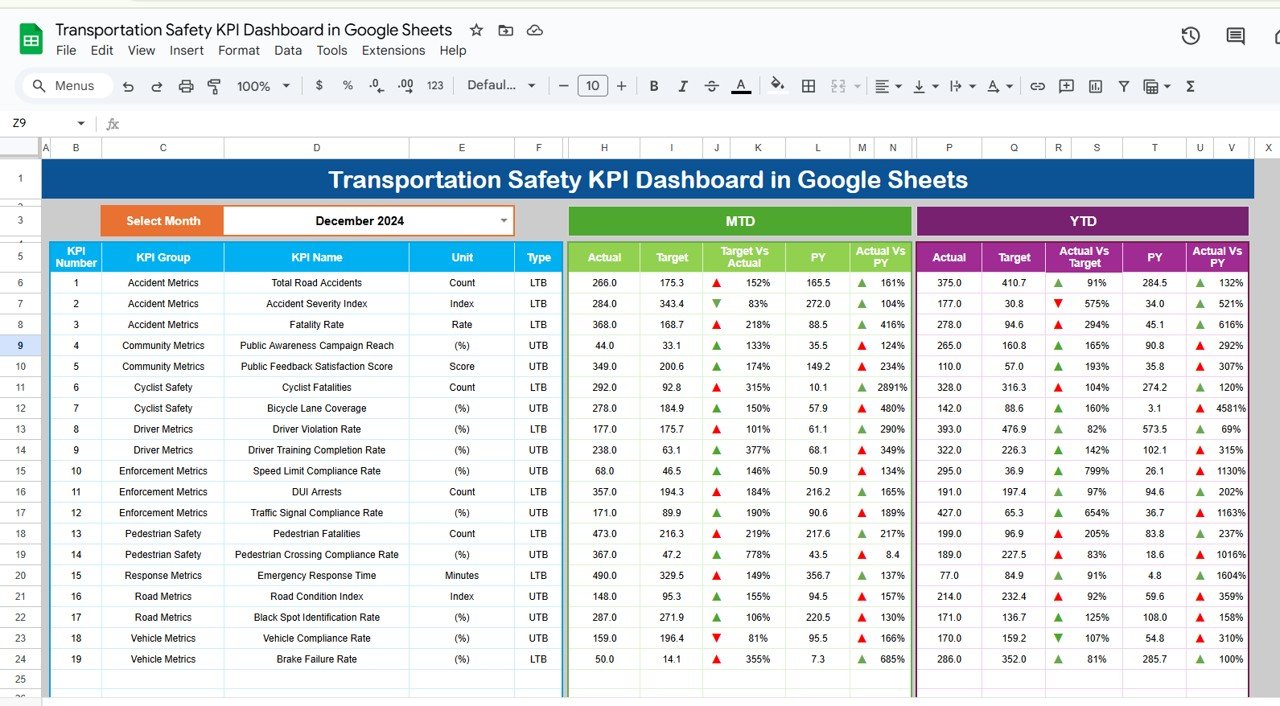
-
Dashboard Sheet: The central hub where all key safety metrics are displayed. Includes month-to-date (MTD), year-to-date (YTD) data, target comparisons, and visual trends.
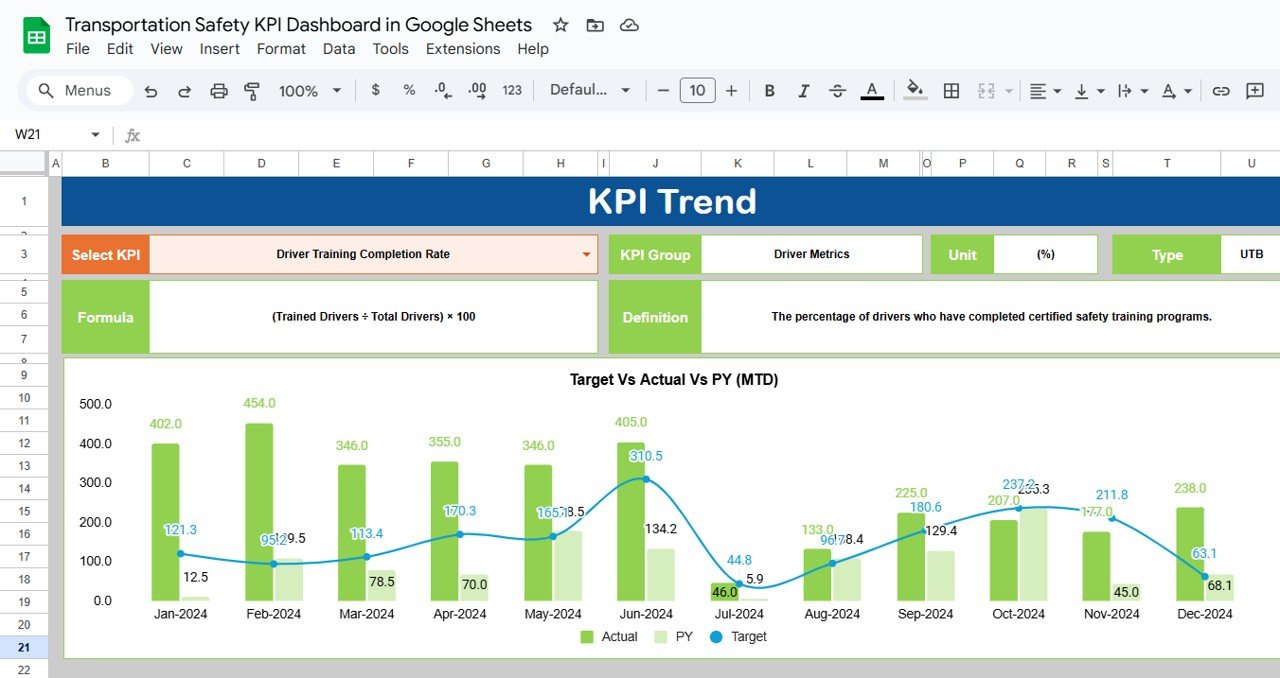
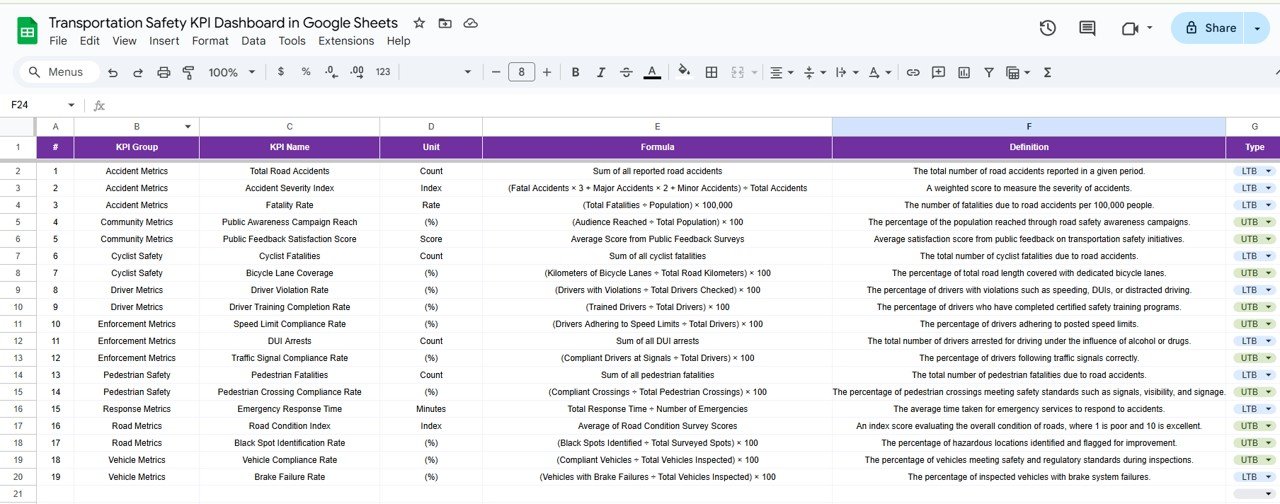
-
KPI Trend Sheet: Select any KPI to view detailed data, including its unit of measure, formula, and definition, giving you a clear understanding of each metric.
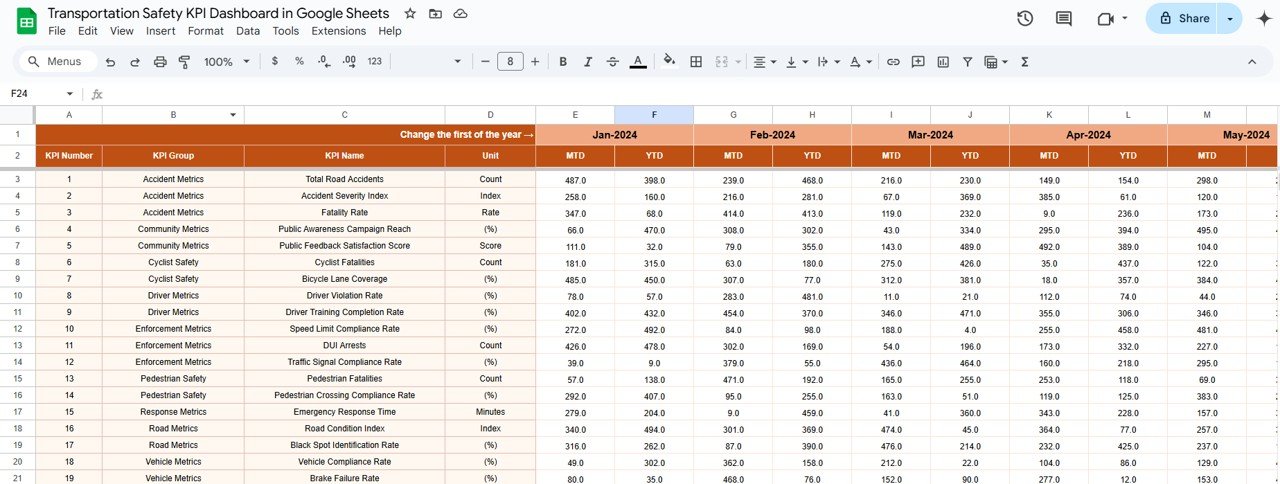
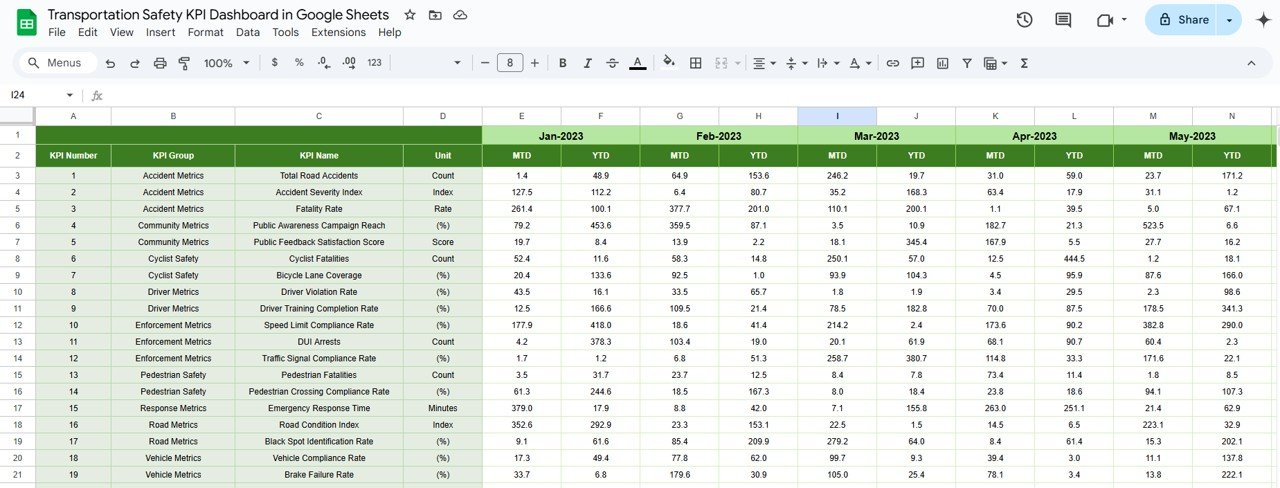
-
Actual Number Sheet: Enter MTD and YTD data to track your fleet’s performance over time. Simply change the month to update the data.
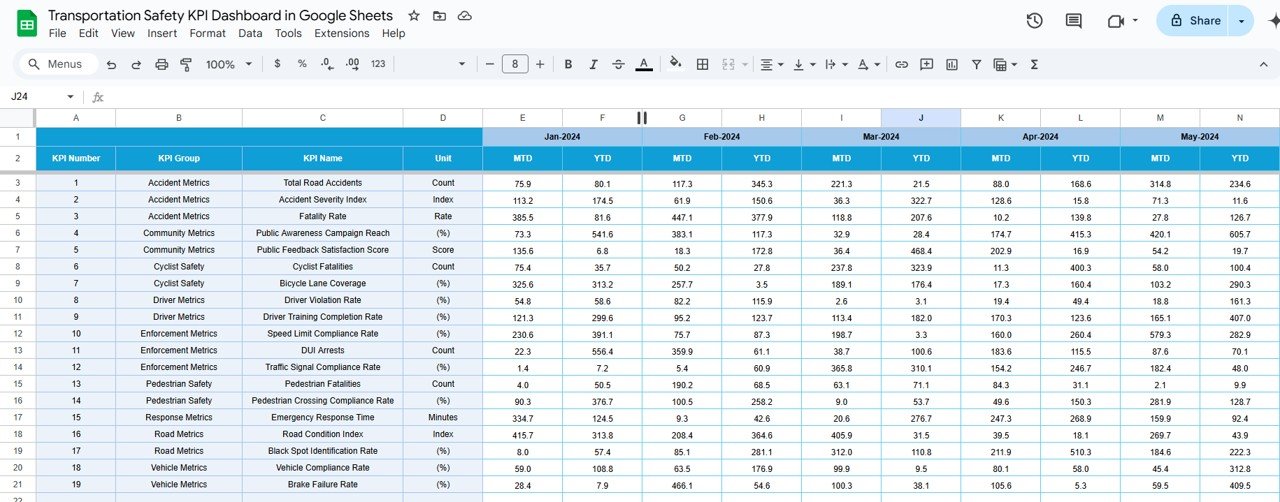
-
Target Sheet: Define your safety targets for each KPI, ensuring your fleet’s performance aligns with your safety goals.
-
Previous Year Numbers Sheet: Compare current performance with last year’s data for a detailed year-over-year (YoY) analysis.
-
KPI Definition Sheet: This sheet provides definitions and explanations for each KPI, ensuring consistency and understanding across your team.
How to Use the Transportation Safety KPI Dashboard 🧑💼📅
To get the most out of the Transportation Safety KPI Dashboard, follow these easy steps:
-
Download the Template: Open the dashboard in Google Sheets to start managing your safety data.
-
Update Data Regularly: Enter actual numbers for each KPI, keeping the dashboard up-to-date for accurate insights.
-
Set Targets: Define your MTD and YTD targets for each KPI to ensure your fleet is meeting safety goals.
-
Track Performance: Use the dashboard to compare actual performance against targets and previous years.
-
Analyze Trends: Continuously monitor your KPIs to identify trends and areas for improvement in fleet safety.
Who Can Benefit from This Transportation Safety KPI Dashboard? 🚗🛠️
This dashboard is ideal for anyone in the transportation industry looking to monitor and improve safety standards. Whether you’re managing a fleet of trucks or overseeing logistics operations, this tool is essential for ensuring the safety of both drivers and vehicles.
-
Fleet Managers: Track your fleet’s safety performance across various KPIs to improve decision-making and safety outcomes.
-
Safety Officers: Identify and act on safety issues promptly to reduce accidents, fines, and operational disruptions.
-
Transportation Analysts: Analyze trends and performance gaps to optimize safety programs and reduce risks.
-
Logistics Companies: Ensure compliance with safety standards while maintaining a high level of service.
Advantages of Using the Transportation Safety KPI Dashboard 📉🔧
-
Real-Time Insights: Quickly identify underperforming areas and take immediate corrective action.
-
Data-Driven Decision Making: Use KPI data to prioritize safety initiatives and allocate resources effectively.
-
Compliance Assurance: Track safety-related metrics to ensure your fleet is always compliant with industry regulations.
-
Improved Safety Culture: Foster a culture of safety within your organization by consistently monitoring and addressing safety KPIs.
-
Cost Reduction: Reduce accident-related costs and avoid expensive legal fines by tracking key safety metrics such as accident rates and speeding violations.
Click here to read the Detailed Blog Post 📖
Watch the step-by-step video Demo:


Reviews
There are no reviews yet.