

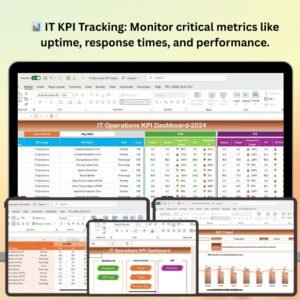
The Tech Support Efficiency KPI Dashboard in Excel is a comprehensive tool designed to help IT teams and support managers track and optimize their technical support operations. This Excel-based dashboard allows you to monitor key performance indicators (KPIs) such as response times, resolution times, customer satisfaction, ticket volumes, and support team performance, providing valuable insights to improve efficiency, reduce customer wait times, and enhance overall service quality.
By consolidating all relevant data into one user-friendly interface, the dashboard helps you identify bottlenecks, streamline processes, and ensure that support tickets are resolved in a timely manner. It’s perfect for businesses of all sizes that rely on efficient tech support systems to maintain customer satisfaction and operational success.
Key Features of the Tech Support Efficiency KPI Dashboard in Excel
📈 Ticket Volume Tracking
Track the number of incoming support tickets in real-time. This feature helps you monitor workload fluctuations and identify peak times when more resources may be needed.
⏱ Response Time & Resolution Time Monitoring
Monitor the average time taken for initial responses and the time it takes to resolve tickets. This KPI is critical for improving efficiency and reducing customer wait times.
💡 Customer Satisfaction (CSAT) Measurement
Track customer satisfaction scores based on ticket resolution feedback. By analyzing CSAT scores, you can gauge the effectiveness of your support team and identify areas for improvement.
📅 Team Performance Analysis
Monitor the performance of individual support agents and teams. Track ticket completion rates, average resolution times, and other essential metrics to assess team productivity and effectiveness.
⚙️ Escalation Rate Tracking
Track how many tickets are escalated to higher levels of support. This helps identify recurring issues, training opportunities, and areas for process improvement.
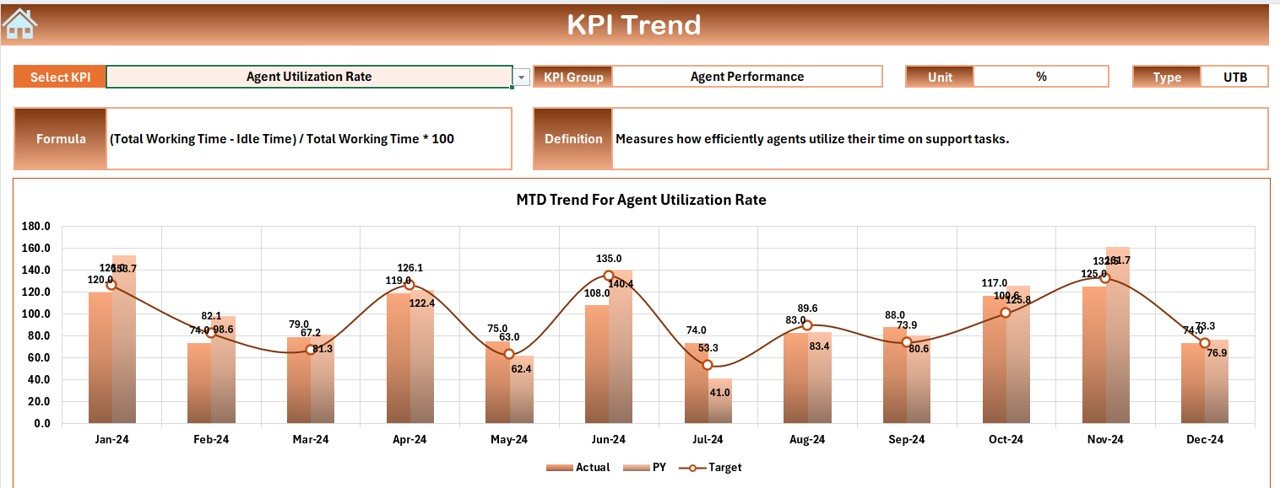
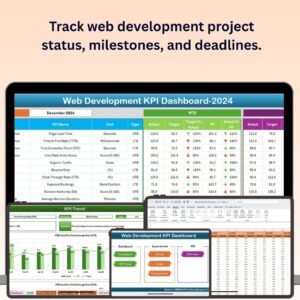
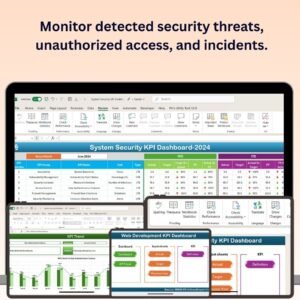
📊 Data Visualization & Reporting
Visualize your support data with charts and graphs. This feature makes it easy to analyze performance trends, monitor KPIs, and generate insightful reports to make data-driven decisions.
Why You’ll Love the Tech Support Efficiency KPI Dashboard in Excel
✅ Streamline Tech Support Operations
Track the most important KPIs to streamline your tech support operations, ensuring that tickets are resolved efficiently, and customers are satisfied.
✅ Enhance Team Productivity
Monitor individual and team performance to ensure that your support team is working efficiently. Identify areas where additional training or resources are needed to optimize performance.
✅ Improve Customer Satisfaction
By measuring customer satisfaction, you can identify opportunities for improving the quality of your service, enhancing customer relationships, and increasing loyalty.
✅ Data-Driven Decisions for Improvement
Leverage data-driven insights to make decisions that improve your support team’s performance and reduce response times, leading to better service.
✅ Customizable & Scalable
The dashboard is fully customizable to suit your specific support team’s needs. As your business grows, the dashboard can scale to handle a larger volume of support tickets and more complex metrics.
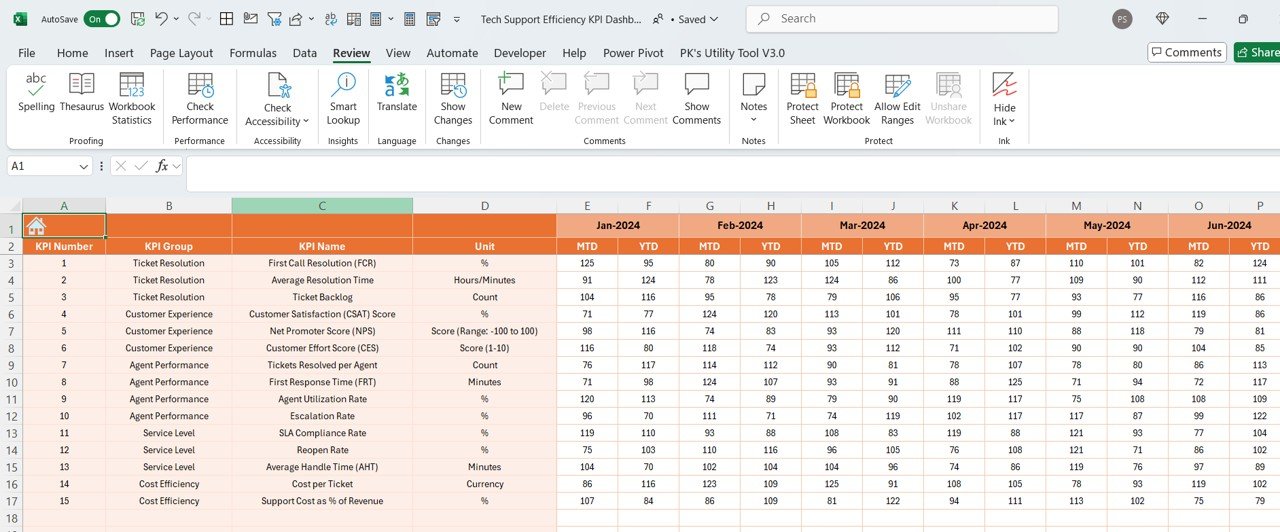
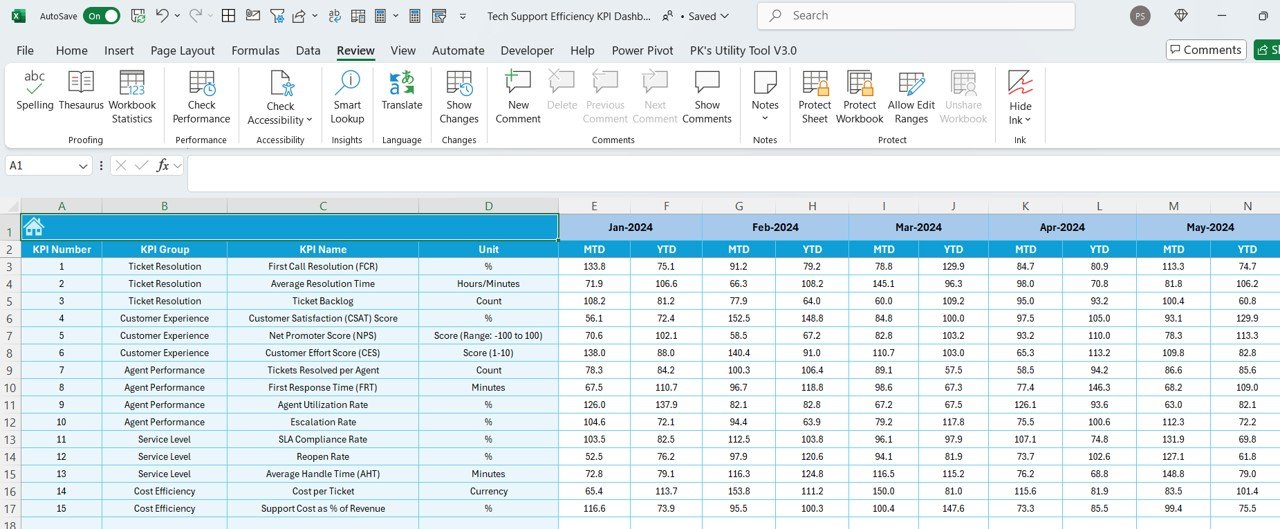
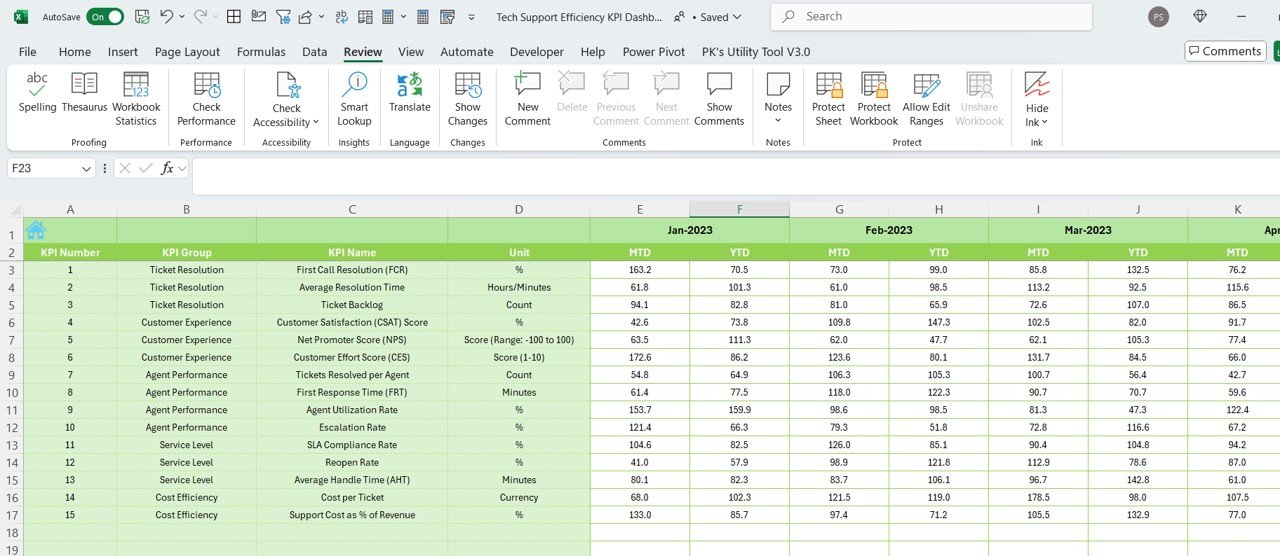
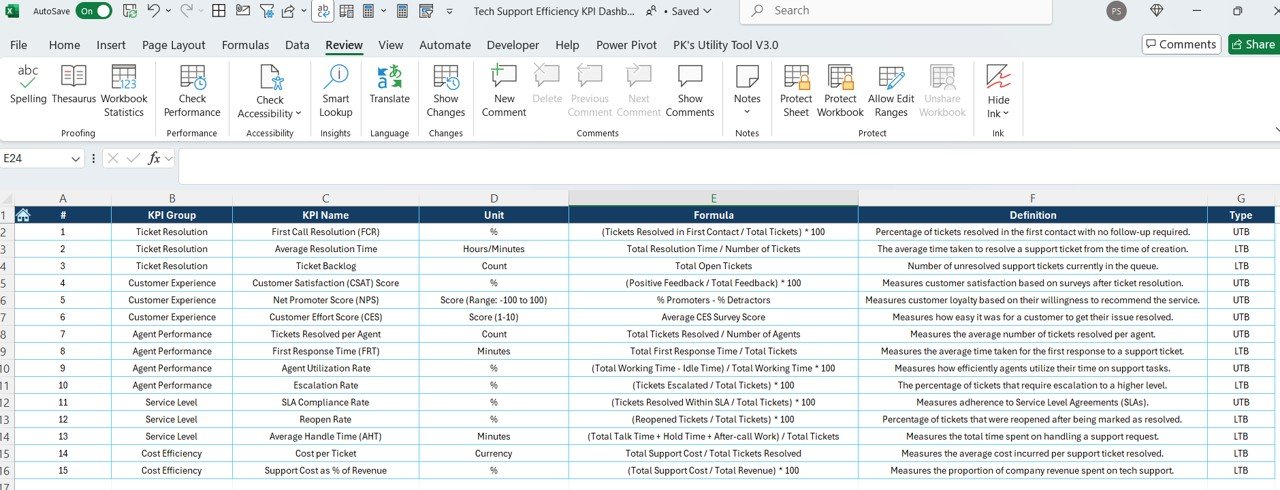
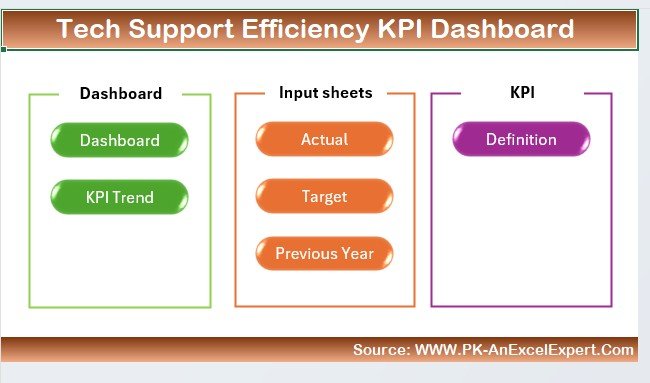
What’s Inside the Tech Support Efficiency KPI Dashboard in Excel?
-
Ticket Volume Tracking: Monitor incoming support tickets in real-time.
-
Response & Resolution Time Monitoring: Track average response and resolution times for tickets.
-
Customer Satisfaction (CSAT): Measure CSAT scores to assess service quality.
-
Team Performance Analysis: Track individual and team performance.
-
Escalation Rate Monitoring: Monitor tickets that are escalated to higher support levels.
-
Data Visualization: Visualize key support data with graphs and charts for easy analysis.
How to Use the Tech Support Efficiency KPI Dashboard in Excel
1️⃣ Download the Template: Get access to the Tech Support Efficiency KPI Dashboard in Excel.
2️⃣ Integrate Your Data: Input support ticket data, including ticket volumes, response times, resolution times, and customer satisfaction scores.
3️⃣ Track Performance Metrics: Monitor key KPIs such as response times, resolution times, and escalation rates.
4️⃣ Analyze Trends & Data: Use the visualization tools to identify performance trends and areas for improvement.
5️⃣ Optimize Support Operations: Use insights from the dashboard to improve your support team’s efficiency and customer satisfaction.
Who Can Benefit from the Tech Support Efficiency KPI Dashboard in Excel?
🔹 IT Support Teams
🔹 Customer Service Managers
🔹 Technical Support Managers
🔹 Help Desk Teams
🔹 Support Team Leaders
🔹 Operations Managers
🔹 Small & Medium Enterprises (SMBs)
🔹 Large Enterprises with Dedicated Tech Support Teams
Ensure smooth and efficient tech support operations with the Tech Support Efficiency KPI Dashboard in Excel. Track key metrics, improve response times, and enhance customer satisfaction with ease.
Click here to read the Detailed blog post
Visit our YouTube channel to learn step-by-step video tutorials
Youtube.com/@PKAnExcelExpert


Reviews
There are no reviews yet.