
In today’s competitive logistics landscape, real-time performance monitoring is key to achieving operational excellence. The Supply Chain – Logistics KPI Scorecard in Google Sheets is a ready-to-use, data-driven template designed to help logistics professionals, supply chain managers, and operations teams evaluate and improve performance efficiency across key functions — from order fulfillment to delivery accuracy.Supply Chain – Logistics KPI Scorecard in Google Sheets
This scorecard consolidates your logistics data into a single, interactive Google Sheets file. With automated calculations, visual indicators, and monthly trend tracking, it eliminates manual reporting errors and empowers teams to make data-backed decisions quickly and effectively.Supply Chain – Logistics KPI Scorecard in Google Sheets
🔑 Key Features of the Supply Chain – Logistics KPI Scorecard in Google Sheets
📊 Dashboard Sheet Tab
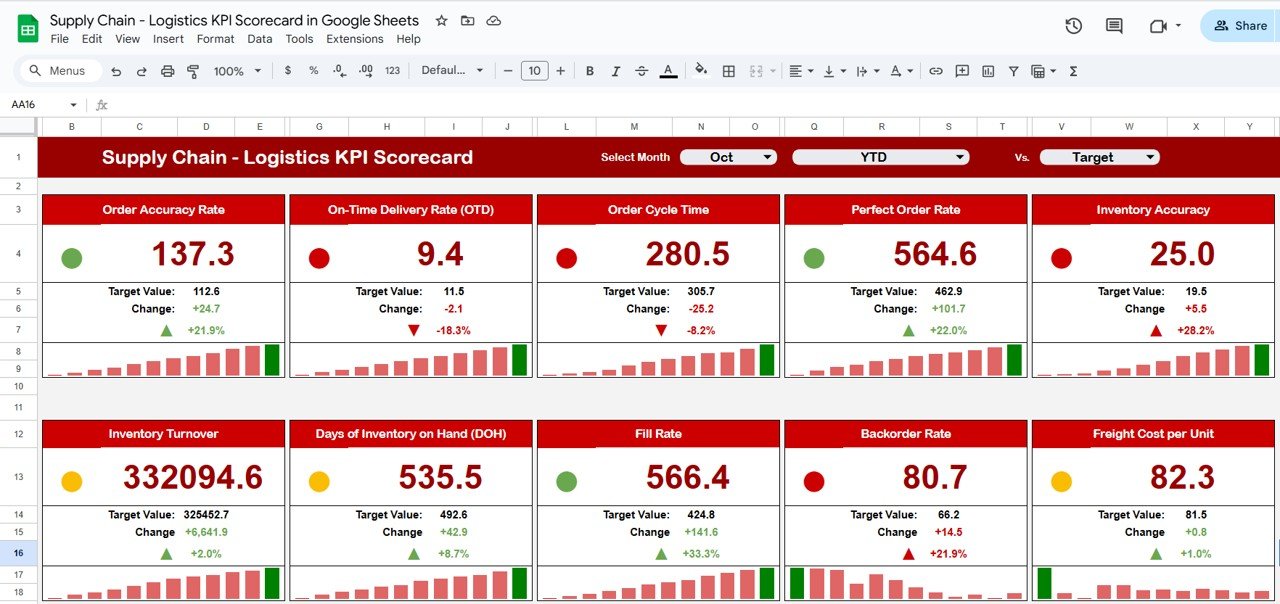
Your central performance hub — get all key logistics KPIs in one glance.
-
Month Dropdown (Cell D3): Select a month to update all metrics dynamically.
-
Automatic Calculations: No manual refresh needed; charts and KPIs update instantly.
-
Traffic Light Indicators: Green = Good, Yellow = Average, Red = Needs Attention.
-
Trend Arrows: Visual percentage change indicators for quick performance evaluation.
-
MTD and YTD Comparison: Evaluate both short-term (Month-to-Date) and long-term (Year-to-Date) results.
This visual layout enables managers to spot issues and take corrective actions immediately.
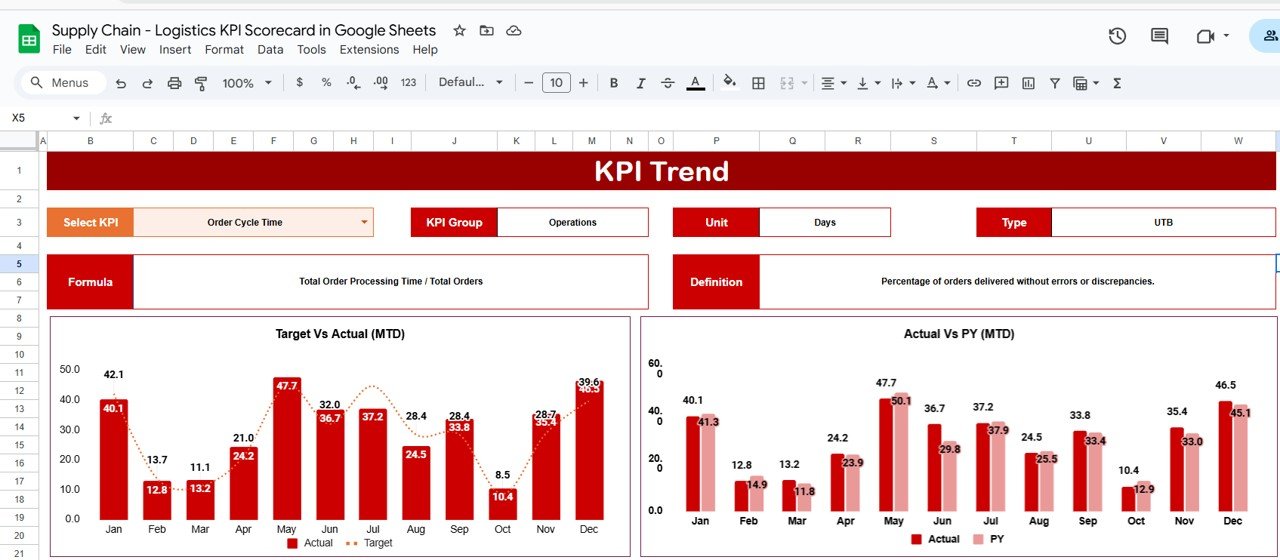
📈 KPI Trend Sheet Tab
Dive deep into performance analysis for any KPI.
-
Dropdown Selection (Cell C3): Choose any KPI to view its detailed trend.
-
Displays: KPI Group, Unit, Formula, Type (UTB/LTB), and Definition.
-
Trend Chart: See how performance changes month-by-month.
Perfect for identifying bottlenecks, seasonal variations, or improvement opportunities.
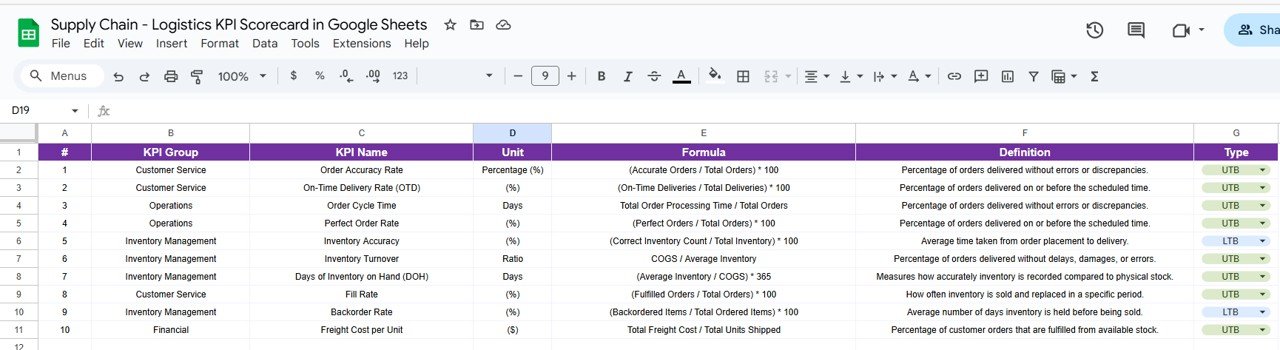
📘 KPI Definition Sheet Tab
Standardize how metrics are measured across your team.
-
Includes KPI Name, Group, Unit, Formula, Definition, and Performance Type (UTB/LTB).
-
Ensures consistency and clarity for every metric tracked.
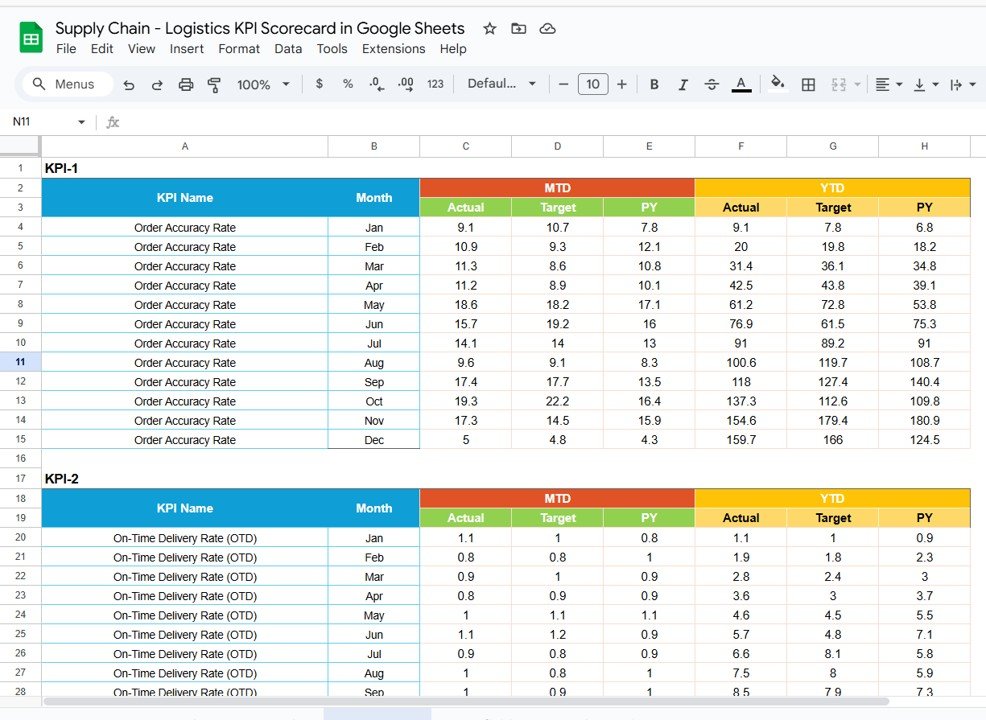
📋 Data Input Sheet Tab
A structured space to record all your logistics performance data.
-
Input both MTD and YTD figures for each KPI monthly.
-
Automatically feeds data to the dashboard and charts.
-
Reduces time spent on data entry and prevents formula errors.
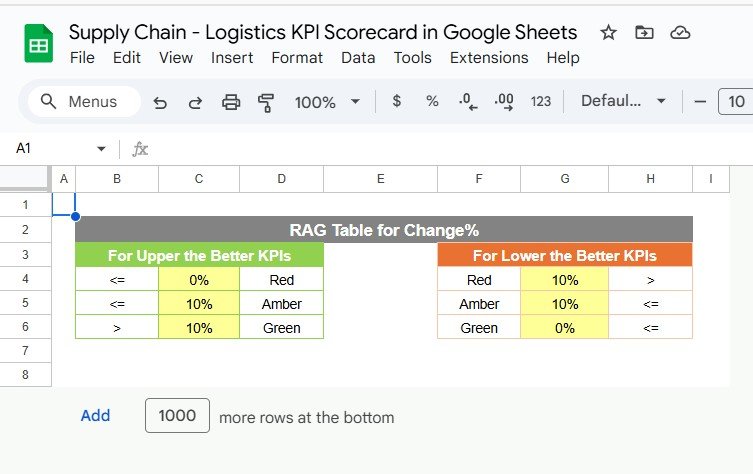
🎨 Color Settings Sheet Tab
Customize visual thresholds for clarity.
-
Define your own Green, Yellow, and Red zones.
-
Tailor conditional formatting to align with company performance standards.
📦 What’s Inside the Template
✅ Dashboard Tab – Visual scorecard with MTD/YTD comparison
✅ KPI Trend Tab – Historical performance chart for each KPI
✅ KPI Definition Tab – Full reference of KPI names, formulas, and types
✅ Data Input Tab – Centralized sheet for monthly metrics
✅ Color Settings Tab – Adjustable traffic light and threshold settings
This all-in-one scorecard transforms raw logistics data into actionable insights, enabling smarter decisions and faster response times.
👩💼 Who Can Use This Scorecard
🏭 Logistics Managers: Track order accuracy, shipment delays, and delivery timelines.
🚚 Supply Chain Directors: Monitor warehouse and transportation KPIs.
📦 Operations Teams: Improve efficiency, reduce costs, and optimize routes.
📈 Business Analysts: Perform KPI trend analysis and variance reporting.
🌍 Global Supply Chain Organizations: Share data collaboratively in real time via Google Sheets.
🧠 How to Use the Logistics KPI Scorecard
-
Enter KPI Data: Add monthly values for each metric in the Data Input Sheet.
-
Set Targets: Define thresholds and expected performance in the Color Settings Tab.
-
View Dashboard: Select a month from the dropdown (Cell D3) to see live updates.
-
Analyze Trends: Use the KPI Trend Tab for long-term performance evaluation.
-
Take Action: Use the visual cues to identify underperforming areas and implement improvements.
Everything updates automatically — no macros or scripts needed.
🌟 Advantages of Using the Scorecard
-
📊 Centralized Logistics KPIs: Combine all performance areas into one file.
-
⚙️ Automated Calculations: Reduces manual effort and human error.
-
💡 Visual Indicators: Quickly identify successes and problem areas.
-
📈 MTD/YTD Analytics: Compare current month and cumulative yearly performance.
-
💬 Collaboration Ready: Share access with teams across departments.
-
🧩 Customizable: Add or modify KPIs, formulas, or visual thresholds.
The scorecard streamlines how logistics teams analyze efficiency, cost control, and service delivery — making data-driven management effortless.
✅ Best Practices
-
Update the Data Input Sheet monthly for accurate tracking.
-
Keep KPI definitions standardized for all team members.
-
Use traffic light visuals to focus discussions on key metrics.
-
Align targets with your organization’s logistics goals.
-
Review the KPI Trend sheet quarterly for deeper insights.Supply Chain – Logistics KPI Scorecard in Google Sheets
🚀 How This Scorecard Helps Supply Chain – Logistics KPI Scorecard in Google Sheets Teams
-
Improves Delivery Performance: Monitor on-time delivery rates and order fulfillment.
-
Optimizes Operational Costs: Identify inefficiencies in transportation and warehousing.
-
Enhances Collaboration: Cloud-based access ensures all departments stay aligned.
-
Supports Data Transparency: Enables real-time visibility across teams.
-
Drives Continuous Improvement: Encourages proactive management and accountability.
🔗 Click here to read the Detailed blog post Supply Chain – Logistics KPI Scorecard in Google Sheets
Watch the step-by-step video Demo:


Reviews
There are no reviews yet.