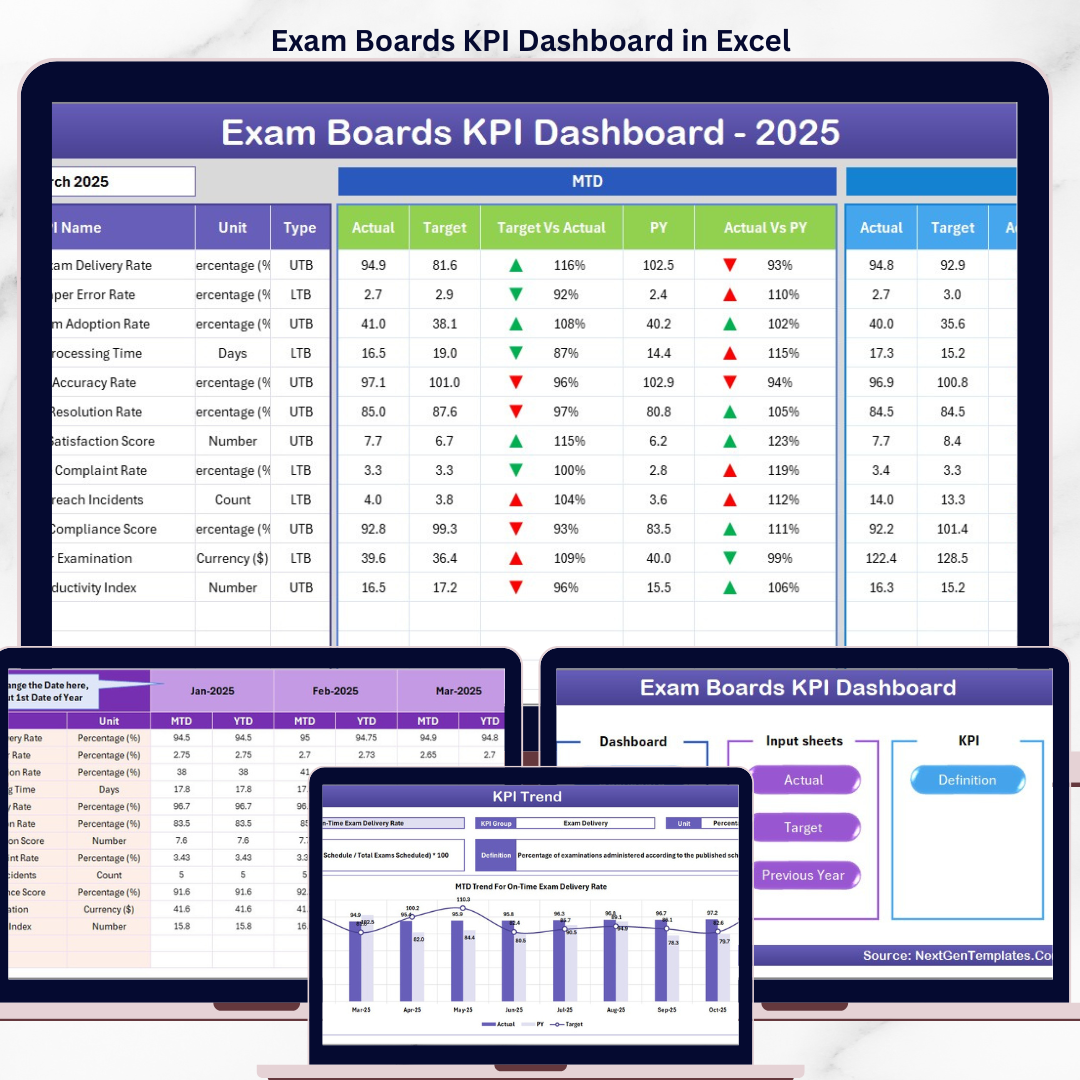

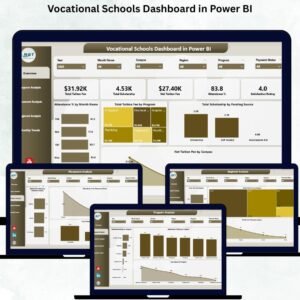
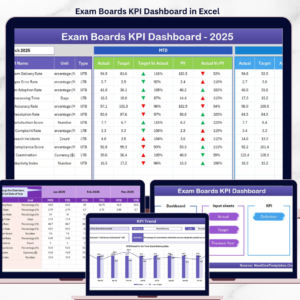
The Exam Boards KPI Dashboard in Excel tracks exam board performance across 7 structured worksheet tabs, with MTD and YTD analysis, conditional formatting arrows, and trend charts for every KPI. Setup takes under 10 minutes — just replace the sample data with your own and each dashboard view updates automatically.
🌍 Join 8,400+ teams in 40+ countries using NextGenTemplates to replace paid SaaS tools with one-time-purchase Excel, Google Sheets, Power BI, and HTML templates.
✅ Instant download · One-time payment · No subscription · No per-user fees · Lifetime access
🔑 Key Features of Exam Boards KPI Dashboard in Excel
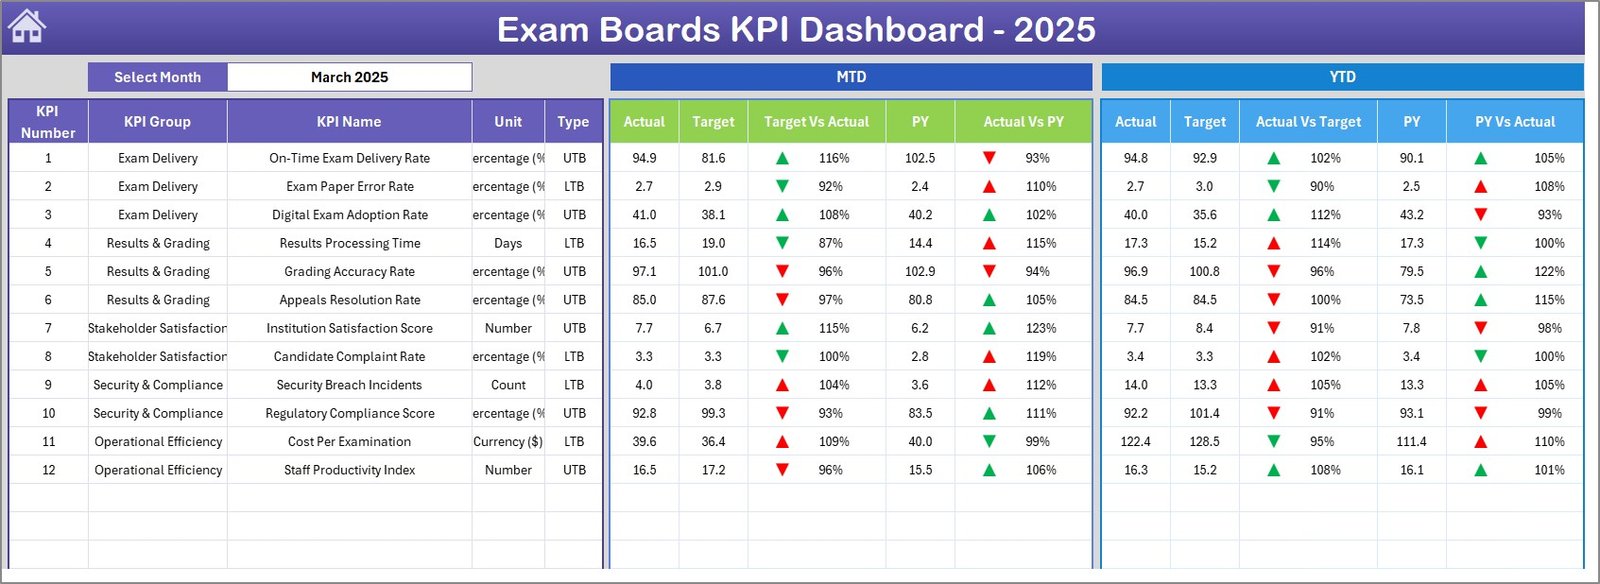
The Exam Boards KPI Dashboard in Excel displays MTD Actual, Target, and Previous Year data alongside YTD comparisons for every KPI, with conditional formatting arrows showing whether each metric is trending up or down. A month selector dropdown on cell D3 instantly updates the entire dashboard for any selected period. The KPI Trend sheet provides individual KPI deep-dives with group classification, unit type, LTB/UTB indicators, formula definitions, and dual MTD/YTD trend charts comparing Actual, Target, and Previous Year performance.
📌 The Home sheet serves as a navigation hub with 6 quick-access buttons linking to every worksheet. The Dashboard sheet presents all KPIs in a single consolidated view with Target vs Actual and PY vs Actual comparisons. Explore more Education Templates for additional academic analytics solutions.
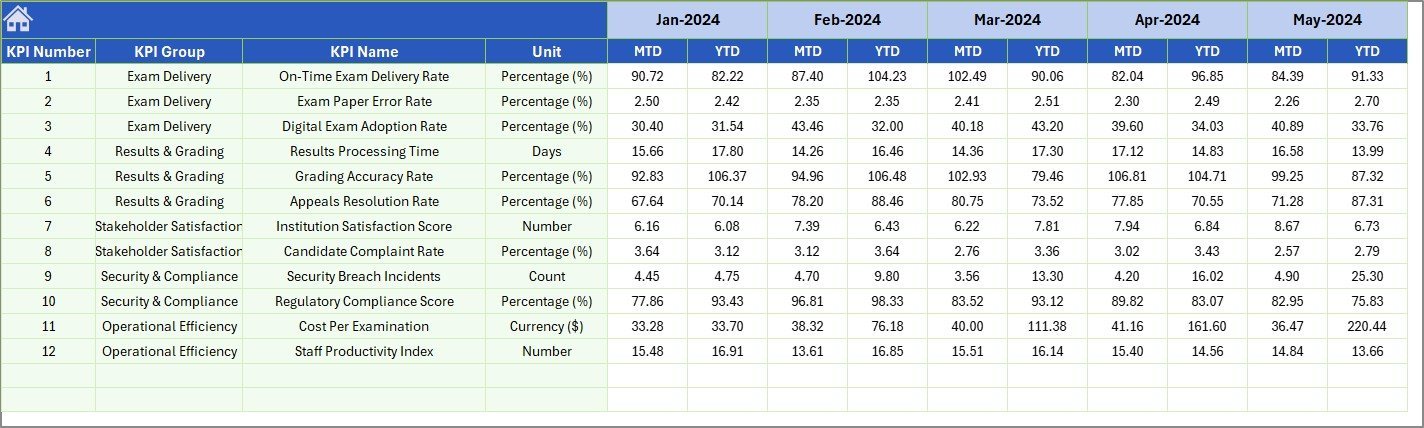
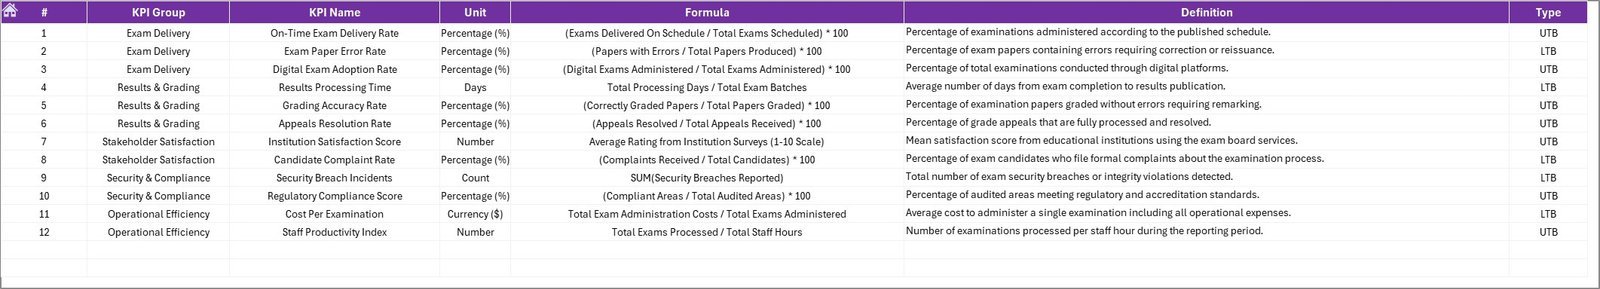
📊 Three dedicated input sheets — Actual Numbers, Target Numbers, and Previous Year Numbers — keep data entry organized and separate from analysis. The KPI Definition sheet lets you customize KPI names, groups, units, formulas, definitions, and type (LTB or UTB) to match your exam board’s specific requirements. Pair this with the Secondary Schools Dashboard in Excel for a full education analytics suite.
📦 What’s Inside the Exam Boards KPI Dashboard in Excel
📋 7 Worksheet Tabs — Home (navigation index), Dashboard (consolidated KPI view), KPI Trend (individual KPI analysis with charts), Actual Numbers Input, Target Number Input, Previous Year Numbers, and KPI Definition.
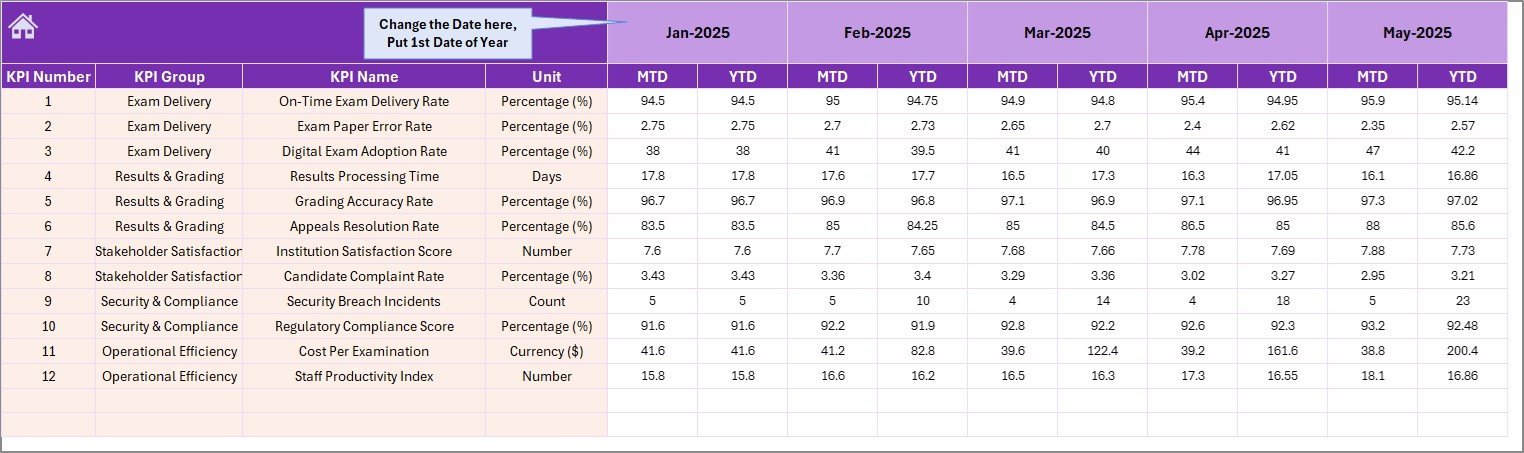
📈 MTD and YTD Tracking — Every KPI shows Month-to-Date and Year-to-Date figures for Actual, Target, and Previous Year with variance calculations.
🔄 Conditional Formatting Arrows — Visual up/down indicators for Target vs Actual and PY vs Actual comparisons across all KPIs.
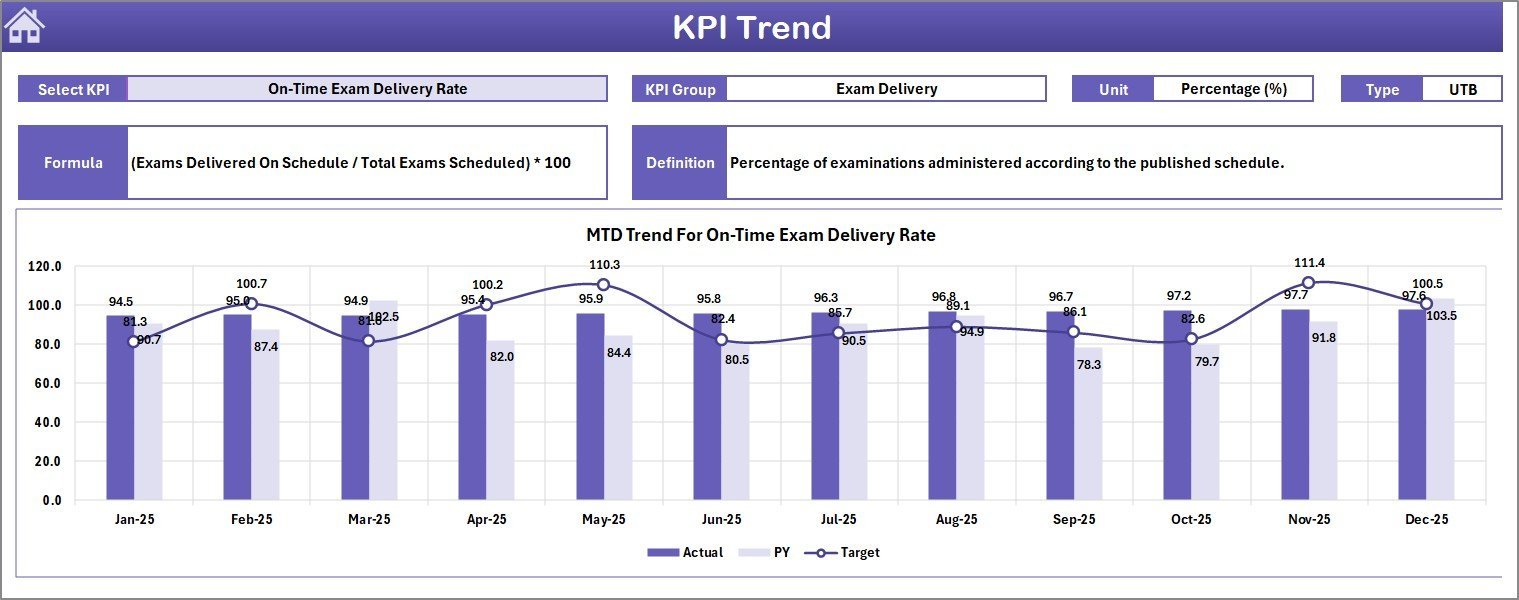
📉 Trend Charts — MTD and YTD trend charts on the KPI Trend page showing Actual, Target, and Previous Year lines for any selected KPI.
🎯 KPI Classification — Each KPI includes Group, Unit, Formula, Definition, and Type (Lower the Better or Upper the Better) for clear metric governance.
📅 Month Selector Dropdown — Select any month from cell D3 on the Dashboard sheet to instantly refresh all numbers.
Exam Boards KPI Dashboard
📊 Exam Boards KPI Dashboard in Excel vs. Google Sheets KPI Dashboard vs. Blackboard Analytics — Where This Fits
| Feature | Exam Boards KPI Dashboard in Excel | Google Sheets KPI Dashboard | Blackboard Analytics / Paid SaaS |
|---|---|---|---|
| Cost | $14.99 one-time | Free (limited features) | $6–$25 / user / month |
| Platform | Microsoft Excel (desktop + web) | Google Sheets (web only) | Cloud SaaS |
| Setup Time | Under 10 minutes | 30–60 minutes | 2–4 weeks |
| Real-Time Team Collaboration | Via Excel Online / SharePoint | Yes (native) | Yes |
| Mobile Access | Excel Mobile App | Google Sheets App | Yes |
| Customizable KPI Definitions | Yes — LTB/UTB, formulas, groups | Manual setup required | Limited to preset metrics |
| MTD + YTD + PY Comparison | Yes — built-in | Requires custom formulas | Yes |
| Year-1 Cost at 5 Users | $14.99 total | $0 (DIY effort) | $360–$1,500 |
| Trend Charts per KPI | Yes — dual MTD + YTD | Manual chart setup | Yes |
For exam boards and education institutions that want detailed KPI tracking without paying monthly SaaS fees, the Exam Boards KPI Dashboard in Excel sits in the sweet spot.
👥 Who This Template Is For — and Who It’s Not For
✅ This template is built for:
- Exam board administrators tracking pass rates, enrollment, and operational KPIs
- Education quality assurance teams monitoring assessment standards across regions
- School district coordinators comparing exam performance across multiple institutions
- Academic consultants delivering KPI reports to education clients
❌ This template is NOT for:
- Enterprise education platforms needing real-time API integrations with student information systems
- Individual teachers tracking classroom-level grades (use a gradebook template instead)
- Organizations requiring automated data feeds from LMS platforms like Blackboard or Canvas
⚙️ How to Use the Exam Boards KPI Dashboard in Excel
1️⃣ Download and open the Excel file. Navigate to the Home sheet to see the 6 navigation buttons.
2️⃣ Define your KPIs on the KPI Definition sheet — enter KPI Name, Group, Unit, Formula, Definition, and Type (LTB or UTB).
3️⃣ Enter Actual numbers on the Actual Numbers Input sheet for each month’s MTD and YTD values. Set the first month of your year on cell E1.
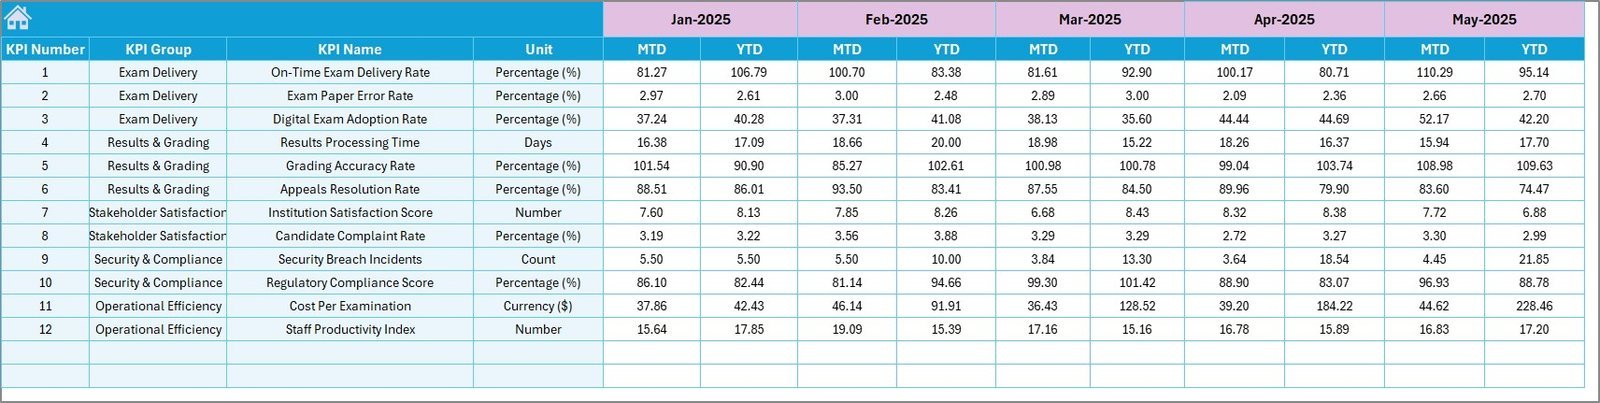
4️⃣ Enter Target numbers on the Target Number Input sheet with MTD and YTD targets for each KPI.
5️⃣ Enter Previous Year data on the Previous Year Numbers sheet using the same format.
6️⃣ View the Dashboard — select any month from the dropdown on cell D3 to see consolidated KPI performance with conditional formatting arrows.
7️⃣ Analyze individual KPIs on the KPI Trend sheet — select any KPI from the dropdown on cell C3 to see its definition, classification, and trend charts.
💼 Real-World Use Cases
Rajesh manages exam operations for a state education board in India. He uses the Exam Boards KPI Dashboard in Excel to track 15 KPIs including pass rates, exam center utilization, and result processing time across 200+ centers. Each quarter, he presents YTD performance to the board of directors — without paying per-user fees for a SaaS analytics platform.
Maria coordinates assessments for a UK-based exam body covering 3 qualification levels. She enters monthly actual and target numbers for metrics like candidate registration growth, marking turnaround time, and appeals resolution rate. The KPI Trend charts help her spot declining metrics before they become audit issues.
David runs quality assurance for a regional exam board in Nigeria. He tracks MTD and YTD performance for center accreditation compliance, question bank utilization, and examiner training completion. The Previous Year comparison helps him demonstrate year-over-year improvement to education ministry stakeholders.
❓ Frequently Asked Questions
What KPIs does the Exam Boards KPI Dashboard track?
The Exam Boards KPI Dashboard in Excel tracks any KPIs you define — common examples include pass rate, candidate enrollment, exam center utilization, marking turnaround time, appeals resolution rate, and examiner training completion. You customize all KPIs on the KPI Definition sheet.
How long does setup take for the Exam Boards KPI Dashboard?
Setup takes under 10 minutes. Define your KPIs on the KPI Definition sheet, enter your actual and target numbers on the respective input sheets, and the Dashboard and KPI Trend pages update automatically with conditional formatting and charts.
Can I track both MTD and YTD performance in this dashboard?
Yes. The Exam Boards KPI Dashboard in Excel shows MTD Actual, Target, and Previous Year alongside YTD Actual, Target, and Previous Year for every KPI. Variance arrows indicate whether each metric is above or below target.
What does LTB and UTB mean in the KPI Definition sheet?
LTB stands for Lower the Better (e.g., appeals rate, error count) and UTB stands for Upper the Better (e.g., pass rate, enrollment growth). This classification controls how the conditional formatting arrows interpret performance — green for favorable, red for unfavorable.
How does this compare to using Blackboard Analytics or a paid SaaS tool?
The Exam Boards KPI Dashboard costs $14.99 one-time versus $6–$25 per user per month for SaaS platforms. It offers the same KPI tracking and trend analysis in Excel without requiring IT integration, vendor contracts, or recurring fees.
Can I add more KPIs to this dashboard?
Yes. Add new KPI rows on the KPI Definition sheet and enter corresponding data on the Actual, Target, and Previous Year input sheets. The Dashboard and KPI Trend pages will include the new metrics automatically.
Does this template work with Excel Online and SharePoint?
Yes. The Exam Boards KPI Dashboard in Excel is compatible with Excel Desktop, Excel Online, and SharePoint. Teams can collaborate on the same file through OneDrive or SharePoint with real-time co-authoring.
👤 About the Author
Built by PK — Microsoft Certified Professional with 15+ years of Excel, Google Sheets, and Power BI experience. Founder of NextGenTemplates, reaching 300K+ subscribers across YouTube channels (@PK-AnExcelExpert, @NextGenTemplates, @NeoTechNavigators). Every template is hand-built and tested before release.
🔗 Explore Related Templates
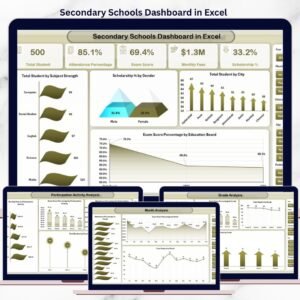
📌 Secondary Schools Dashboard in Excel — Track student enrollment, attendance, and academic performance across secondary school departments.
📌 Primary Schools Dashboard in Excel — Monitor primary school KPIs including teacher-student ratios, test scores, and budget allocation.
📌 Tutoring Business Dashboard in Excel — Analyze tutoring session metrics, revenue, student progress, and tutor performance.
📌 Student Academic Performance Dashboard in Google Sheets — Also available in Google Sheets for teams preferring cloud-native analytics.
📖 Click here to read the Detailed Blog Post
🎥 Visit our YouTube channel for step-by-step video tutorials
👉 YouTube.com/@NextGenTemplates


Reviews
There are no reviews yet.