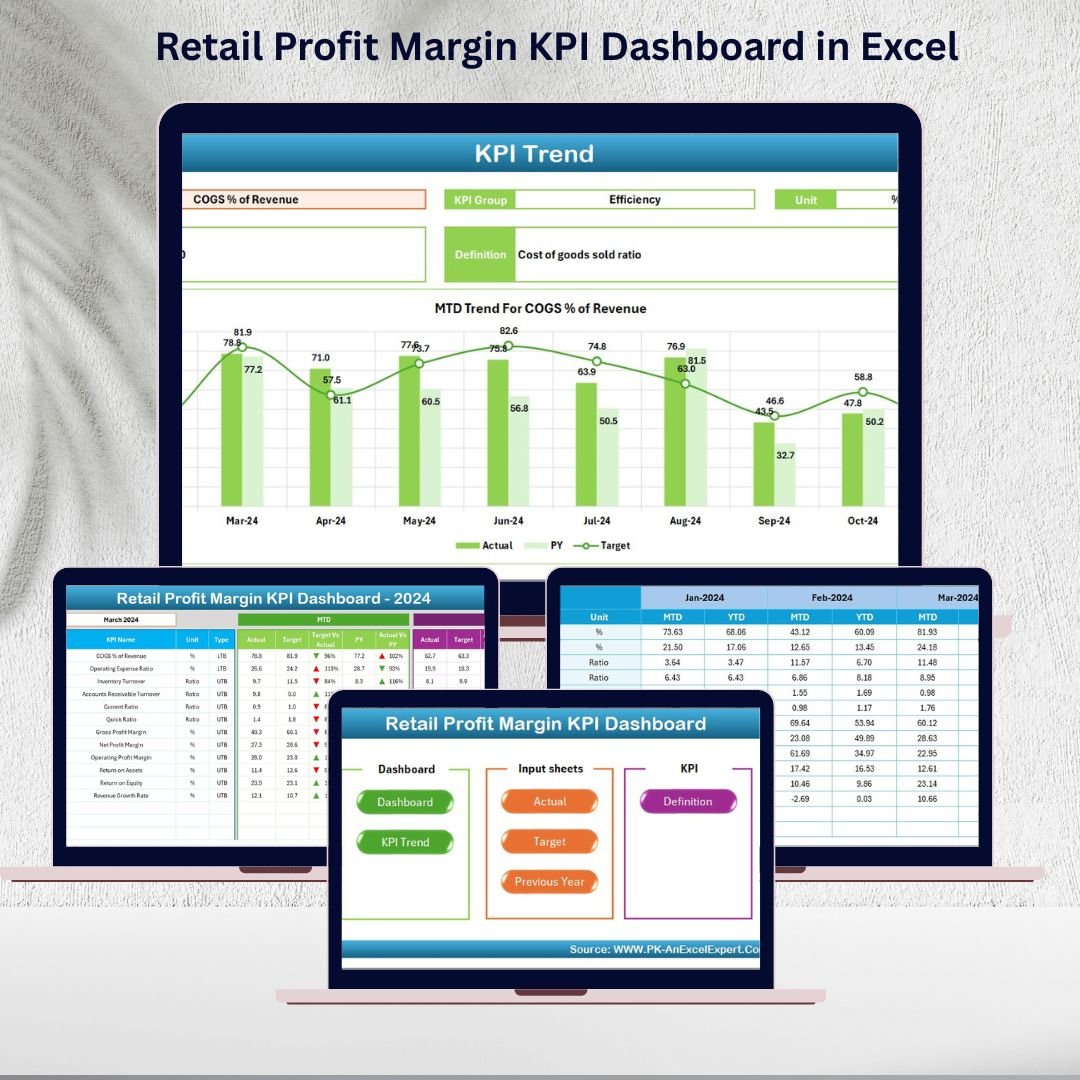
Managing profitability is at the heart of every retail business. If you’re struggling to keep track of margins, costs, or revenue trends, our Retail Profit Margin KPI Dashboard in Excel is exactly what you need. This ready-to-use tool is designed to simplify profit tracking, visualize key metrics, and empower decision-making — all within the comfort of Microsoft Excel.
With this dashboard, you don’t need complex or expensive BI tools. You get a cost-effective, flexible, and professional solution to monitor the health of your retail operations, identify growth opportunities, and ensure every decision supports long-term profitability.
✨ Key Features of Retail Profit Margin KPI Dashboard in Excel
-
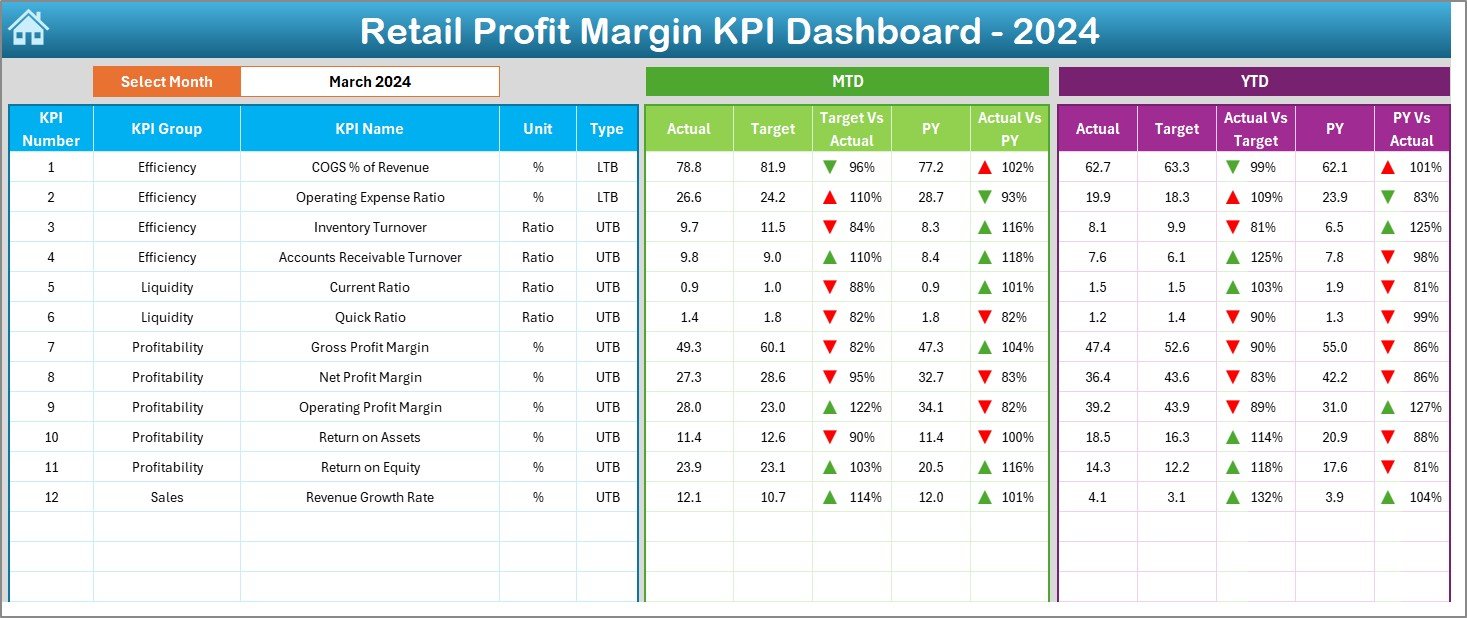
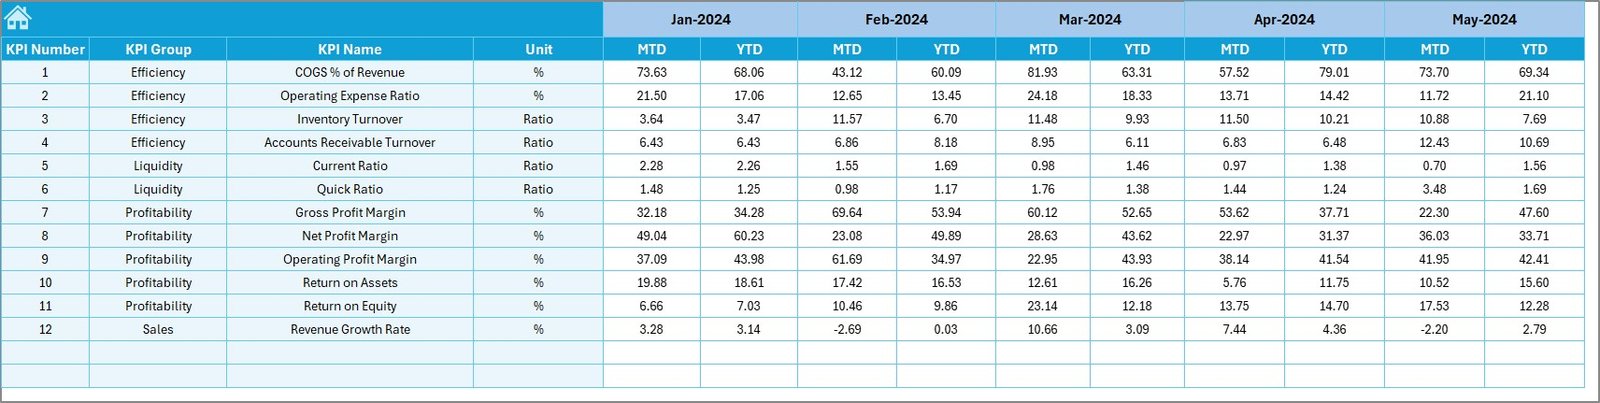
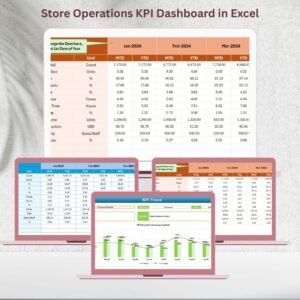
📊 Comprehensive Performance Tracking – Monitor both MTD (Month-to-Date) and YTD (Year-to-Date) actuals vs targets vs previous year performance.
-
🎯 Target Achievement Insights – Instantly spot gaps between actual results and set targets with conditional formatting and clear indicators.
-
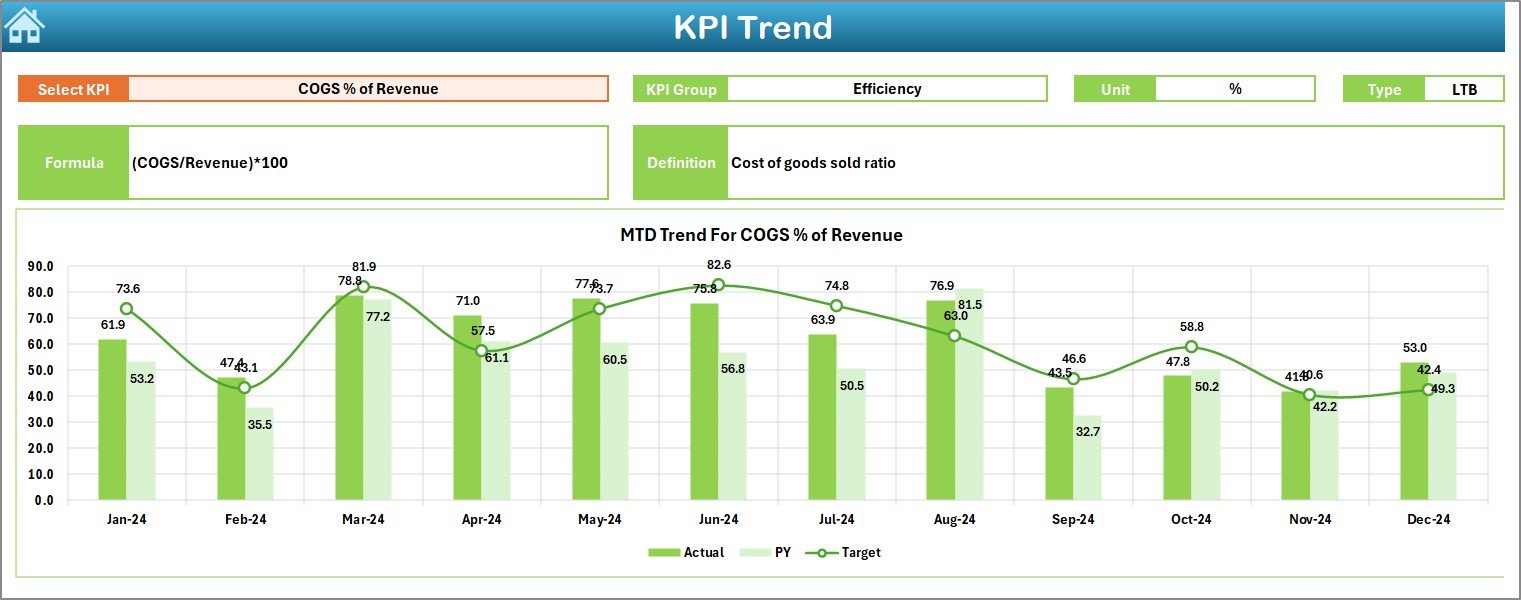
📈 Trend Analysis – Explore historical KPI trends with easy-to-read charts that highlight growth or decline.
-
⏱️ Time-Saving Automation – Forget manual calculations; everything updates automatically once you input data.
-
✅ Error Reduction – Built-in formulas minimize risks of human error in reporting.
-
🖥️ Professional Layout – Clean structure with navigational buttons, slicers, and visuals for smooth user experience.
-
🔄 Flexibility & Customization – Add your own KPIs, adjust targets, or expand for multiple store analysis.
📂 What’s Inside the Retail Profit Margin KPI Dashboard
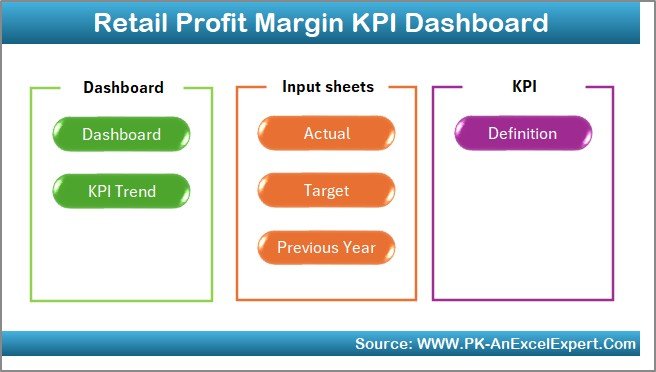
This Excel template comes with seven structured worksheets, each built to serve a unique purpose:
-
Home Sheet – A professional index with buttons to navigate across sheets.
-
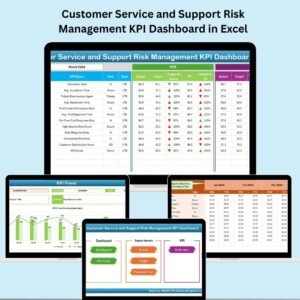
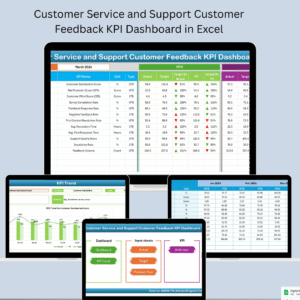
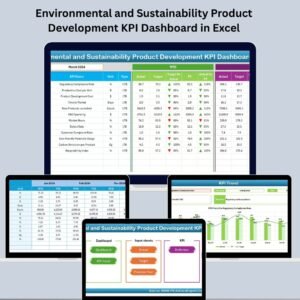
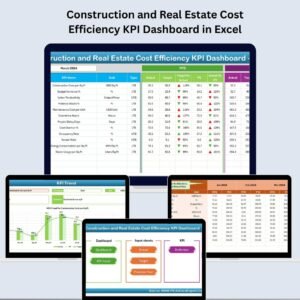
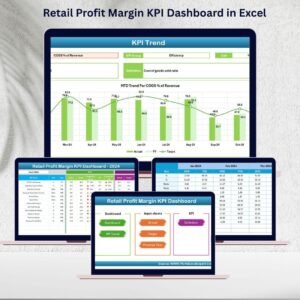
Dashboard Sheet – The main hub showing MTD vs Target vs Previous Year KPIs with visual arrows and charts.
-
KPI Trend Sheet – Select a KPI from a drop-down and view detailed monthly & yearly trends.
-
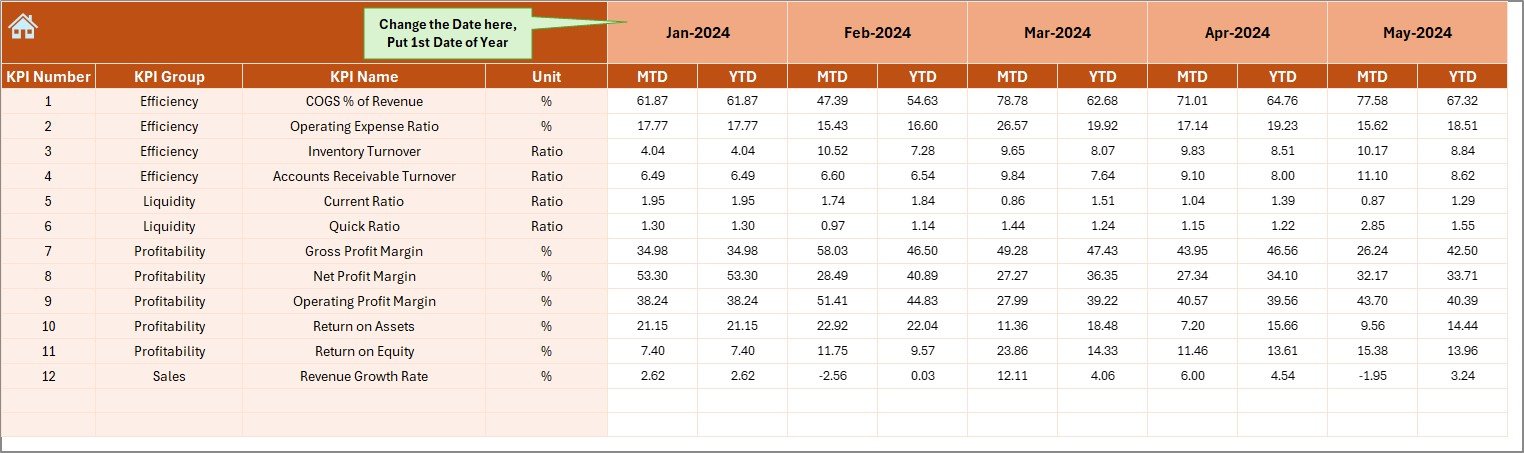
Actual Numbers Input Sheet – Input MTD and YTD data with a refresh option to start the year anytime.
-
Target Sheet – Enter monthly and yearly targets for accurate performance comparisons.
-
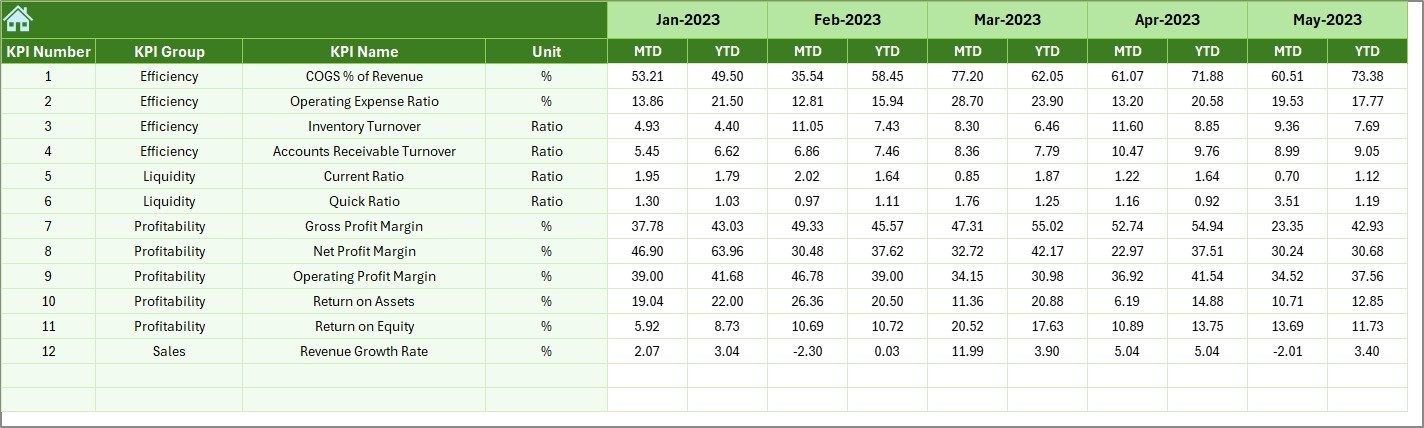
Previous Year Sheet – Store past performance data for YOY (year-over-year) analysis.
-
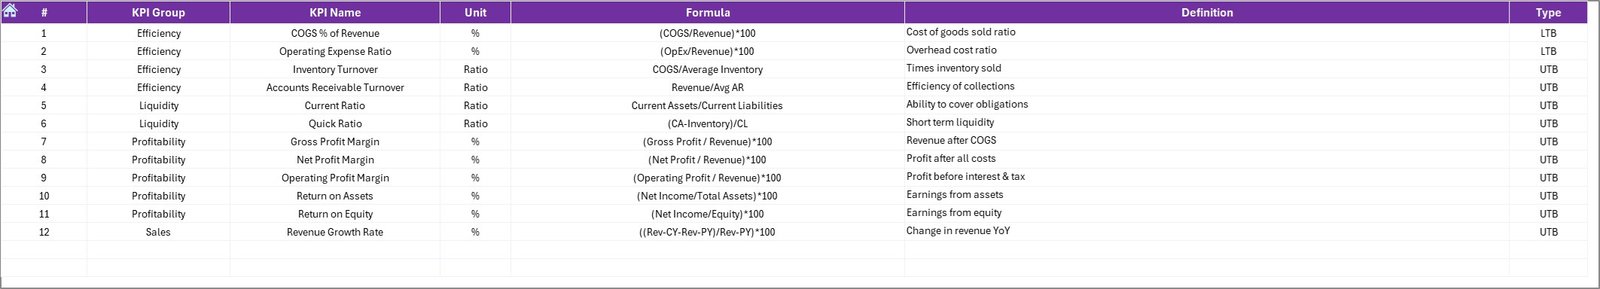
KPI Definition Sheet – Document KPI details like name, formula, unit, and type (UTB/LTB) for clarity.
🛠️ How to Use the Retail Profit Margin KPI Dashboard
-
Enter Your Data – Input monthly actuals in the data sheet.
-
Set Targets – Define realistic goals in the Target sheet.
-
Add Previous Year Numbers – Store past data for accurate comparisons.
-
Navigate Easily – Use the Home sheet to jump to key areas.
-
Analyze Trends – Check KPI Trend sheet for visual insights.
-
Make Decisions – Use insights from the Dashboard sheet to adjust pricing, promotions, and operations.
No advanced Excel skills are required — everything is designed for simplicity and efficiency.
👥 Who Can Benefit from This Dashboard?
-
🛒 Retail Store Owners – Stay on top of margins and monitor store performance with ease.
-
📦 Inventory Managers – Track turnover, markdowns, and returns to reduce losses.
-
💼 Business Analysts – Use detailed KPIs for reporting and forecasting.
-
📊 Finance Teams – Ensure financial health and profitability are aligned with company goals.
-
🚀 Startups & SMEs – Get a cost-effective alternative to complex BI software.
-
🏬 Multi-Store Retailers – Customize the template to track multiple locations simultaneously.
With this Retail Profit Margin KPI Dashboard in Excel, you’ll never second-guess your profitability again. It’s a professional, easy-to-use, and affordable solution for any retailer serious about growth.
Click here to read the Detailed blog post
Watch the step-by-step video tutorial:
Visit our YouTube channel to learn step-by-step video tutorials


Reviews
There are no reviews yet.