

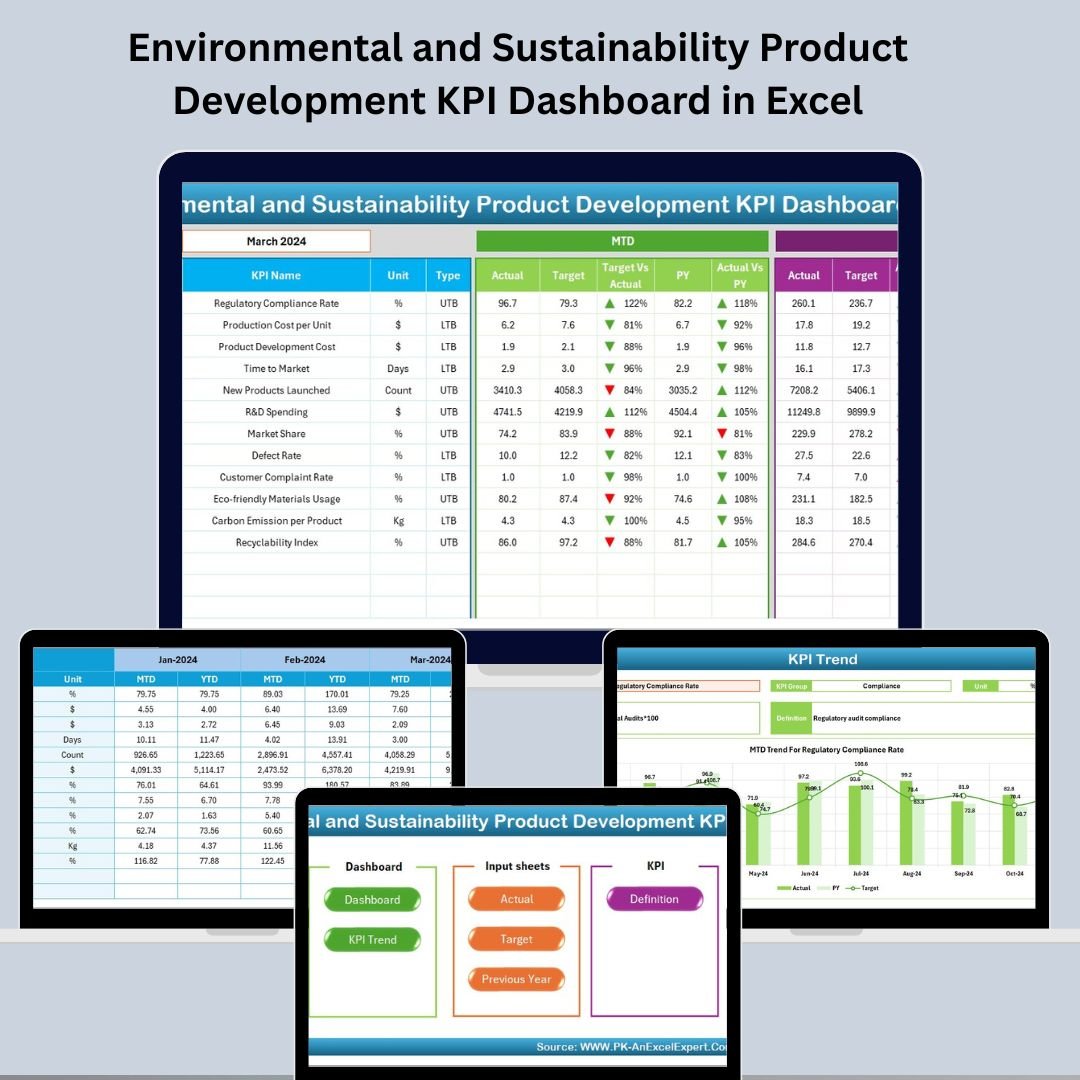
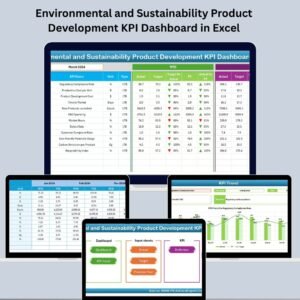
Sustainability is no longer optional—it’s a business imperative. In a world where eco-conscious consumers and regulators demand transparency, companies must integrate environmental practices into product development. But how do you track what matters? Enter the Environmental and Sustainability Product Development KPI Dashboard in Excel—your all-in-one solution to measure, manage, and improve sustainability KPIs across product design and development cycles. 📊🌍
This ready-to-use Excel template helps you visualize progress, identify gaps, and make data-driven decisions that align with your environmental goals. Whether you’re reducing emissions or innovating with recycled materials, this dashboard gives you the power to lead with purpose.
💡 Key Features of Environmental and Sustainability Product Development KPI Dashboard in Excel
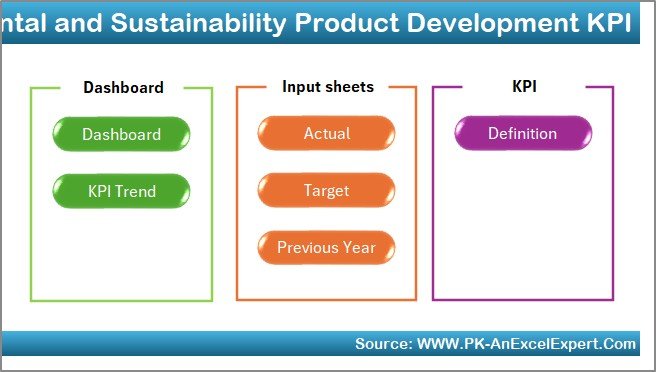
🏠 Home Sheet – Your Navigation Hub
Jump to any section of the dashboard with one click:
Dashboard
KPI Trend
Actual Numbers Input
Target Values
Previous Year Data
KPI Definitions
The Home sheet ensures fast and intuitive access to every part of your workflow.
📈 Dashboard Sheet – Instant Visual Reporting
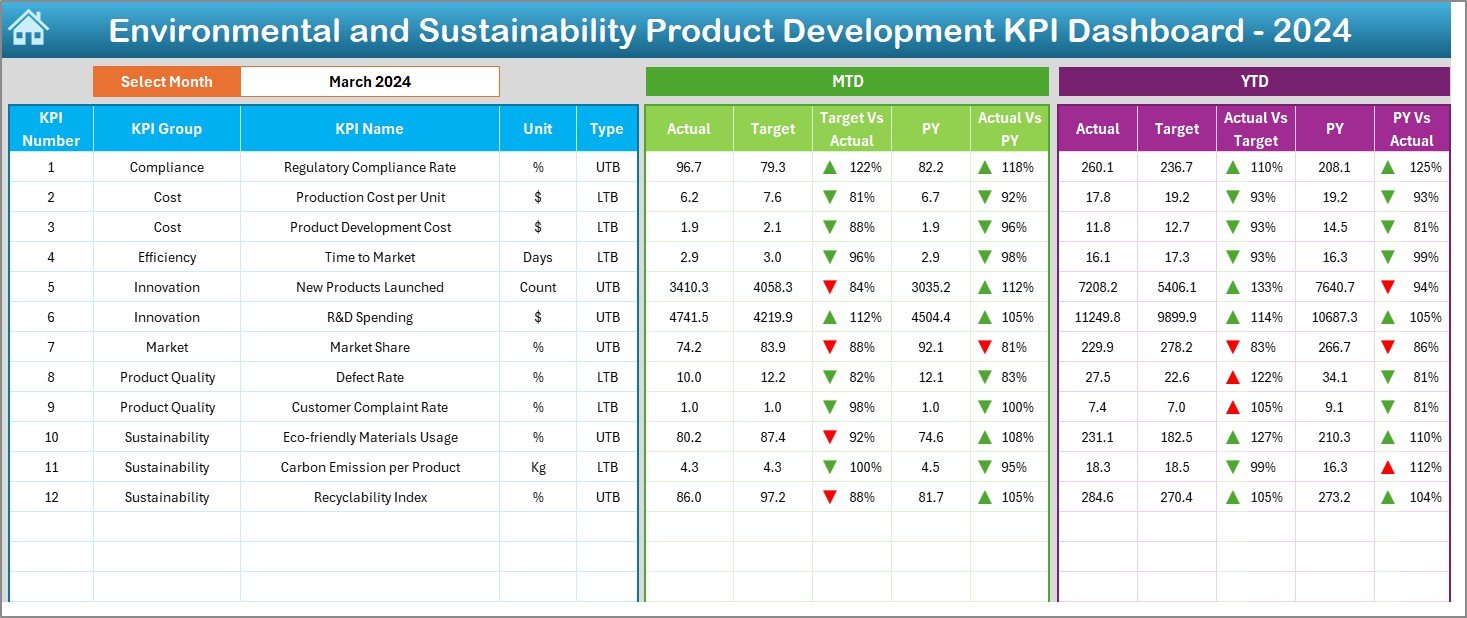
Choose a month (cell D3) to dynamically update:
📊 MTD & YTD performance (Actual, Target, Previous Year)
🎯 Target vs. Actual and Previous Year vs. Actual comparisons
📉 Visual arrows (▲ ▼) for quick performance feedback
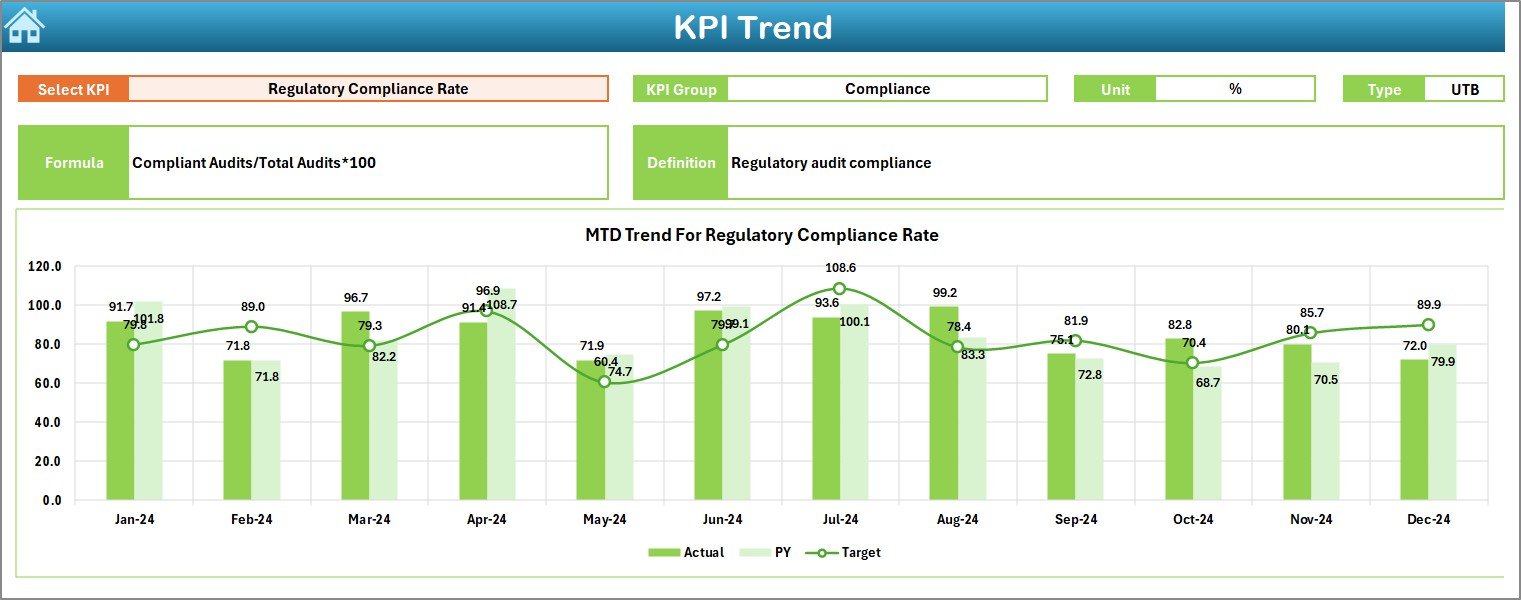
🔍 KPI Trend Sheet – In-Depth KPI Analysis
Select a KPI from a dropdown
View its Group, Unit, Formula, Type (UTB or LTB), and Definition
Line charts show MTD and YTD performance across the year
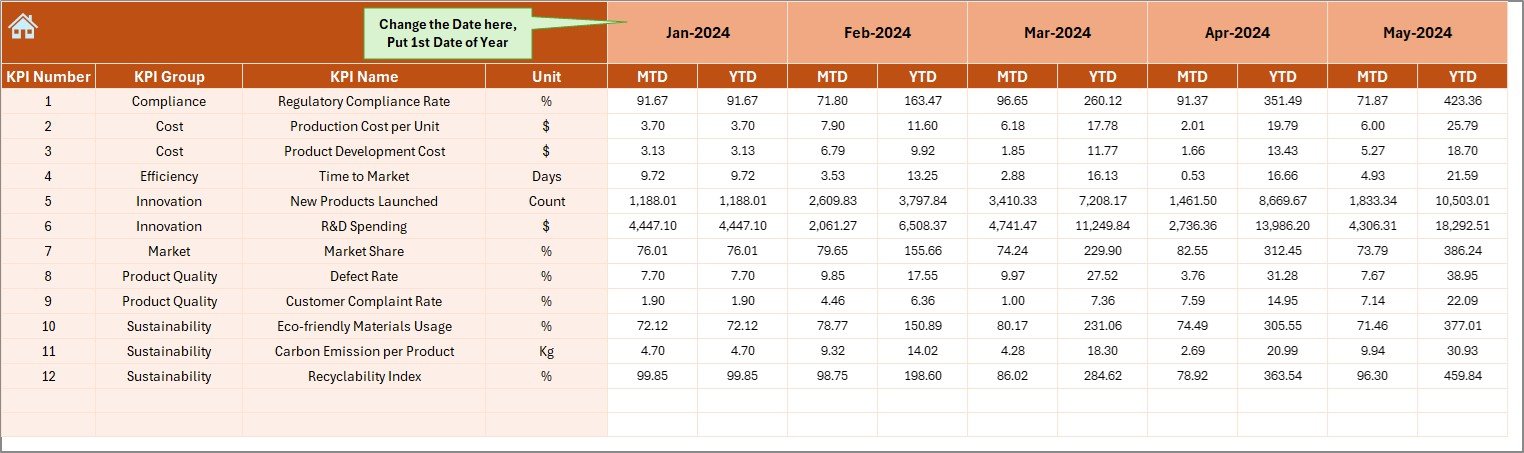
📋 Actual Numbers Input Sheet – Easy Data Entry
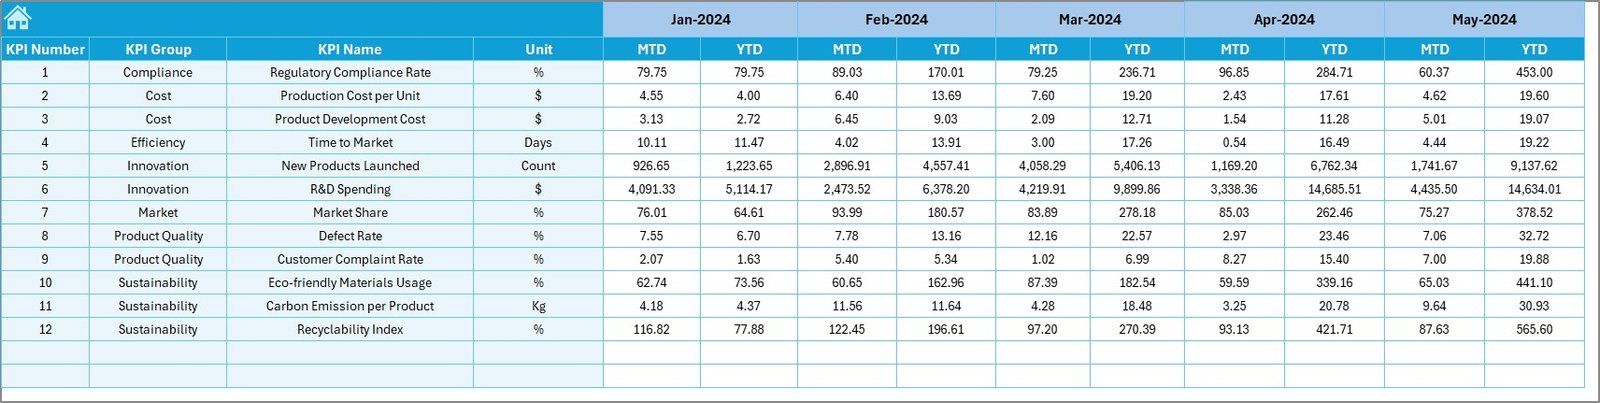
Record monthly MTD and YTD numbers
Set your fiscal year’s starting month in cell E1
Automatically drives dashboard updates
🎯 Target Sheet – Benchmark Your Goals
Enter MTD and YTD targets for each KPI
Enables real-time performance evaluation
📆 Previous Year Sheet – Year-over-Year Comparison
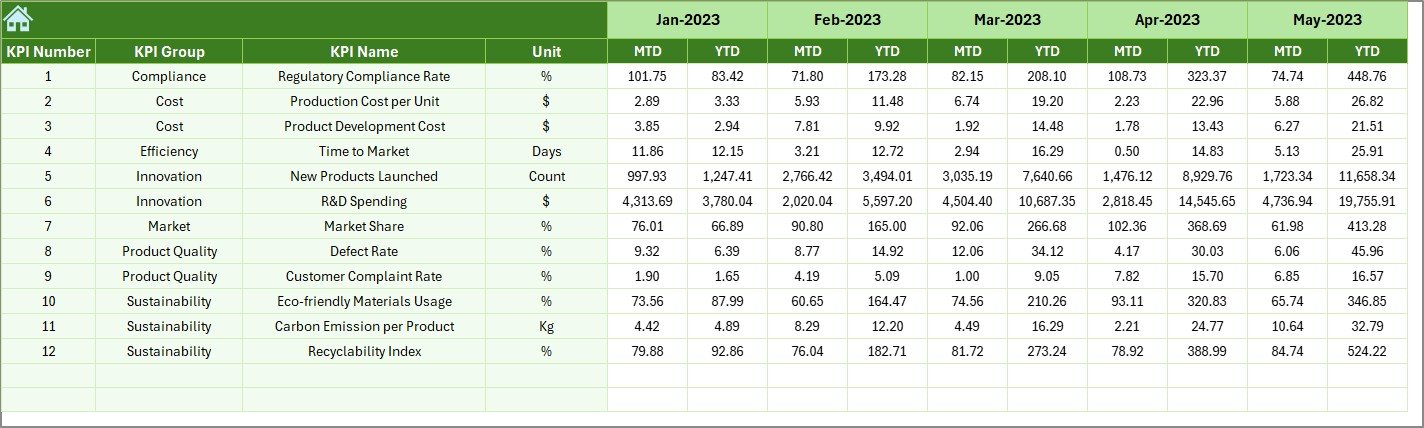
Enter historical performance to benchmark improvement
Supports data-driven goal setting
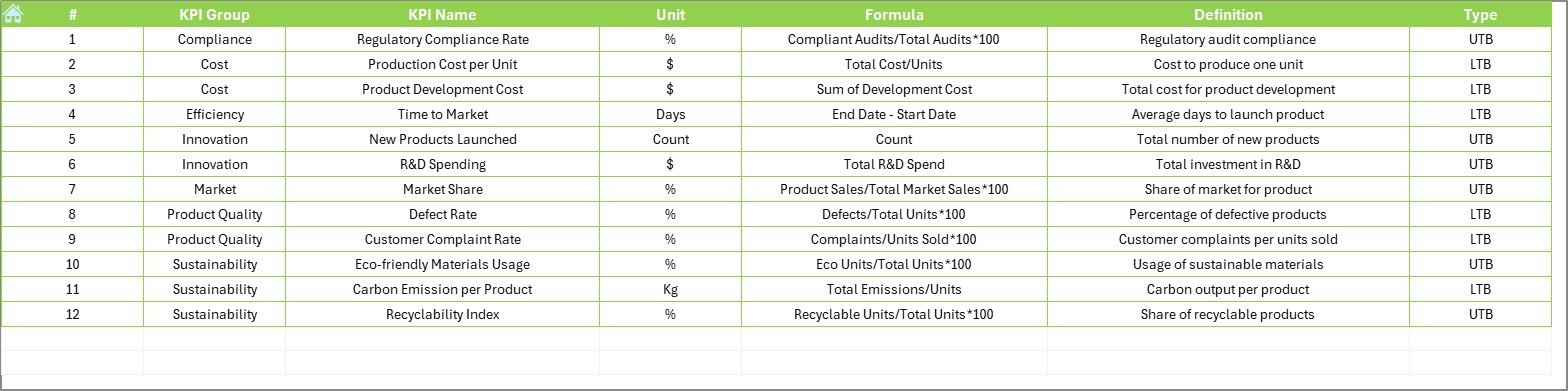
📘 KPI Definition Sheet – Centralized KPI Reference
Define KPI Group, Name, Unit, Formula, Type, and Description
Ensures consistent understanding across departments
📦 What’s Inside the Dashboard?
✅ 7 Structured Sheets – Organized for ease of use and clarity
📈 Auto-Updating Dashboard – One dropdown refreshes all metrics
📊 Dynamic Visuals – Charts and icons provide instant insights
📝 Fully Editable Fields – Tailor to your organization’s goals
📆 MTD & YTD Tracking – Month-by-month and cumulative performance
🎯 LTB/UTB KPI Support – Flexible scoring for all metrics
🛠️ How to Use the KPI Dashboard
Define KPIs – Use the KPI Definition tab to establish what matters most
Input Data Monthly – Enter actuals in the Actual Numbers tab
Set Your Targets – Use the Target tab for monthly/yearly goals
Compare to Previous Year – Add PY numbers for meaningful insights
View Trends & Charts – Analyze each KPI’s progress visually
Customize & Scale – Add more KPIs or tweak layouts to match your industry
No advanced Excel knowledge required. If you can use dropdowns and enter values, you’re good to go!
👥 Who Can Benefit from This Dashboard?
🌍 Sustainability Teams – Track and report on environmental initiatives
🧪 R&D Departments – Monitor innovation performance and sustainable inputs
📊 Product Managers – Align product goals with ESG objectives
🏭 Operations Leaders – Improve production efficiency and reduce environmental impact
📈 Compliance & ESG Reporting Professionals – Generate real-time, audit-ready insights
💼 Executives & Boards – Make informed, eco-aligned strategic decisions
This dashboard empowers everyone in the product development chain—from concept to launch.
🔗 Click here to read the Detailed blog post
📺 Visit our YouTube channel to learn step-by-step video tutorials













Reviews
There are no reviews yet.