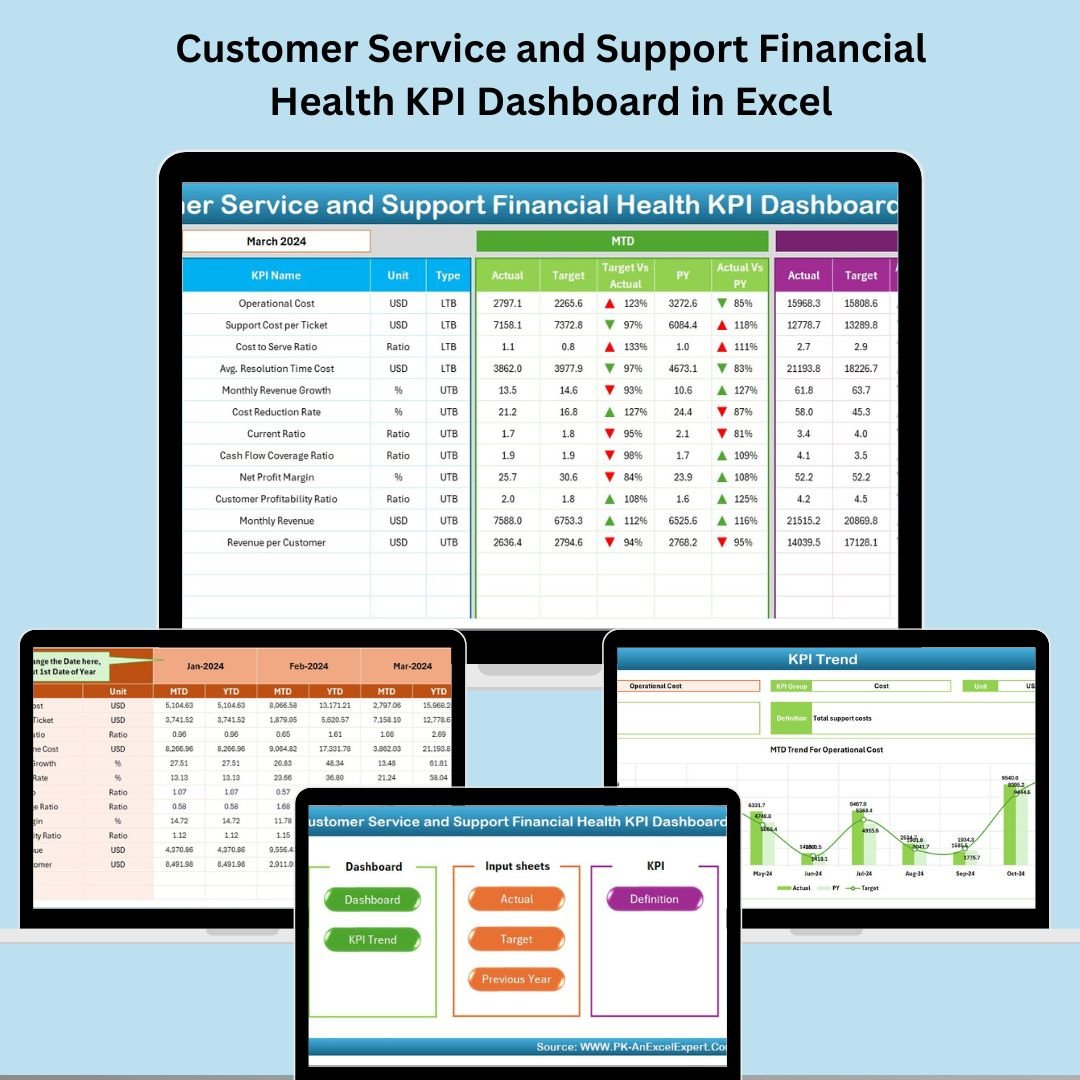
Track, analyze, and improve your customer service financial performance like a pro 📊 with the Customer Service and Support Financial Health KPI Dashboard in Excel! This ready-to-use Excel template turns complex financial tracking into a smooth, visual, and actionable experience.
Perfect for service managers, finance analysts, and small business owners, this dashboard helps you gain real-time financial clarity on your customer support operations.
✅ Key Features of Customer Service and Support Financial Health KPI Dashboard in Excel
📌 📊 Real-Time Dashboard for Instant Insights
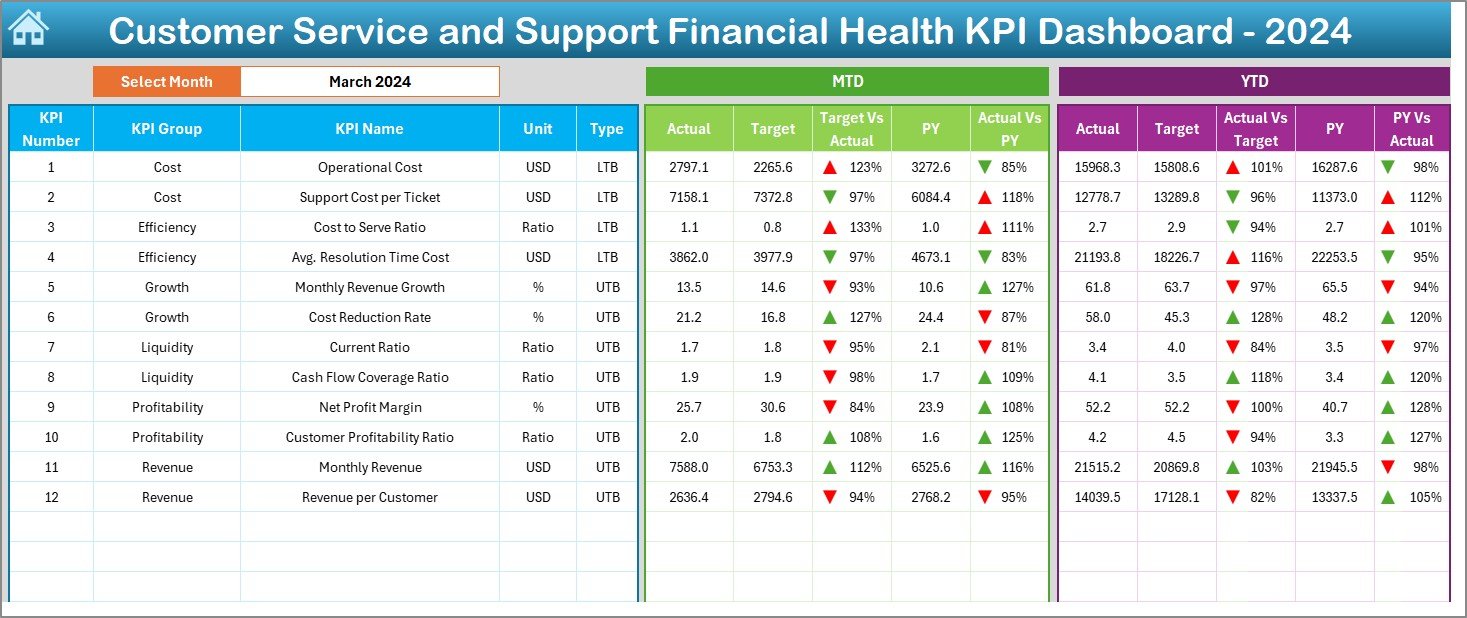
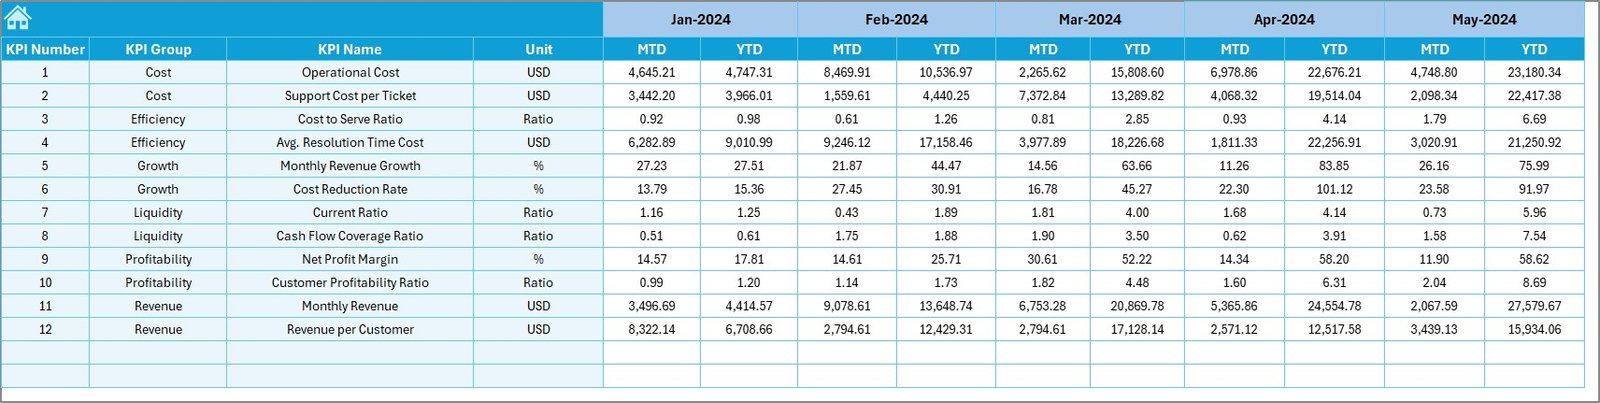
Easily select any month and view your Month-to-Date (MTD) and Year-to-Date (YTD) actuals. Instantly compare against targets and previous year values with built-in visual alerts (✔ or ❌ arrows).
📌 🎯 Track What Matters
Monitor cost effectiveness, ROI, budget adherence, monthly trends, and year-over-year comparisons—all in one place!
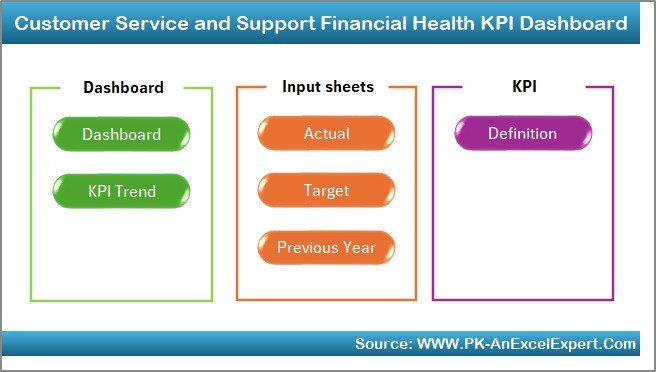
📌 📁 Seven Smartly Structured Sheets
From the command center Home Sheet to KPI Trend visualizations, this dashboard brings clarity across all financial layers of support.
📌 🔄 Dynamic and Interactive
Dropdown filters, automated charts, and formula-driven visuals eliminate guesswork and manual errors.
🗂️ What’s Inside the Customer Service and Support Financial Health KPI Dashboard in Excel
You get a powerful Excel workbook with 7 fully linked worksheet tabs:
-
🏠 Home Sheet: Acts as a quick navigation panel with smart buttons
-
📈 Dashboard Sheet: Visual performance metrics with arrows and color indicators
-
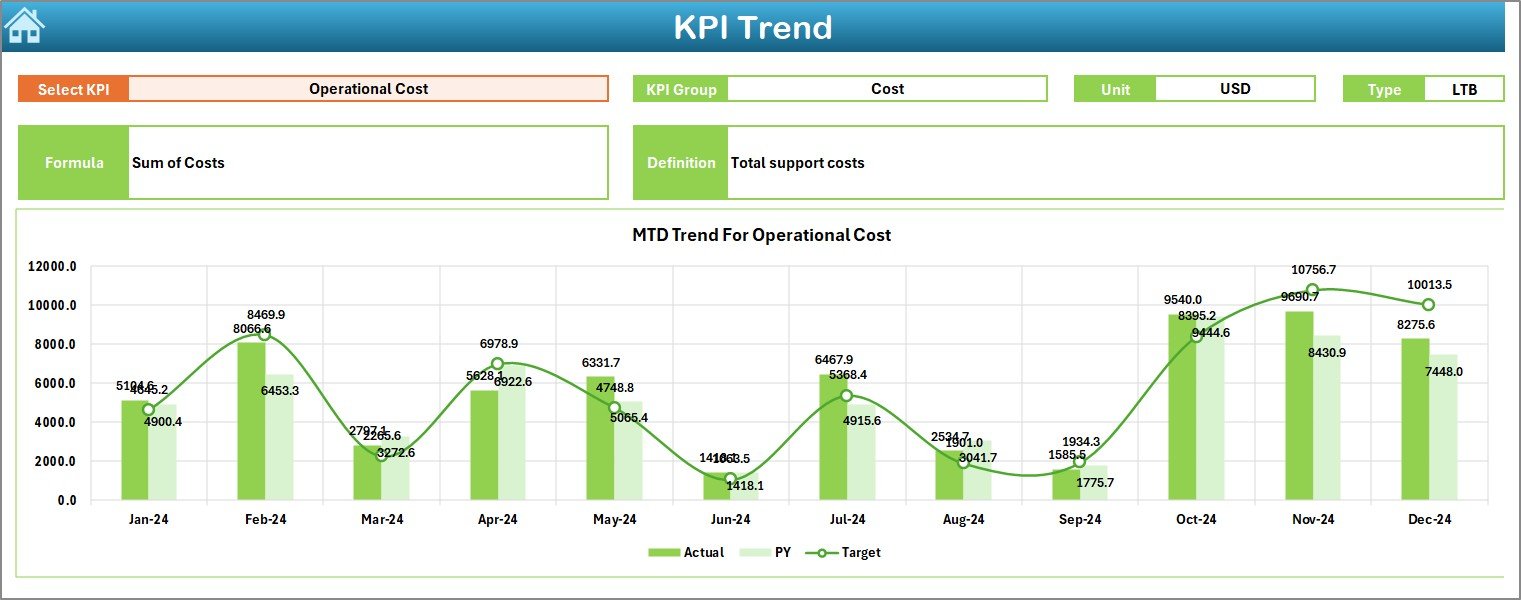
📉 KPI Trend Sheet: Trend analysis across months with dropdown selection
-
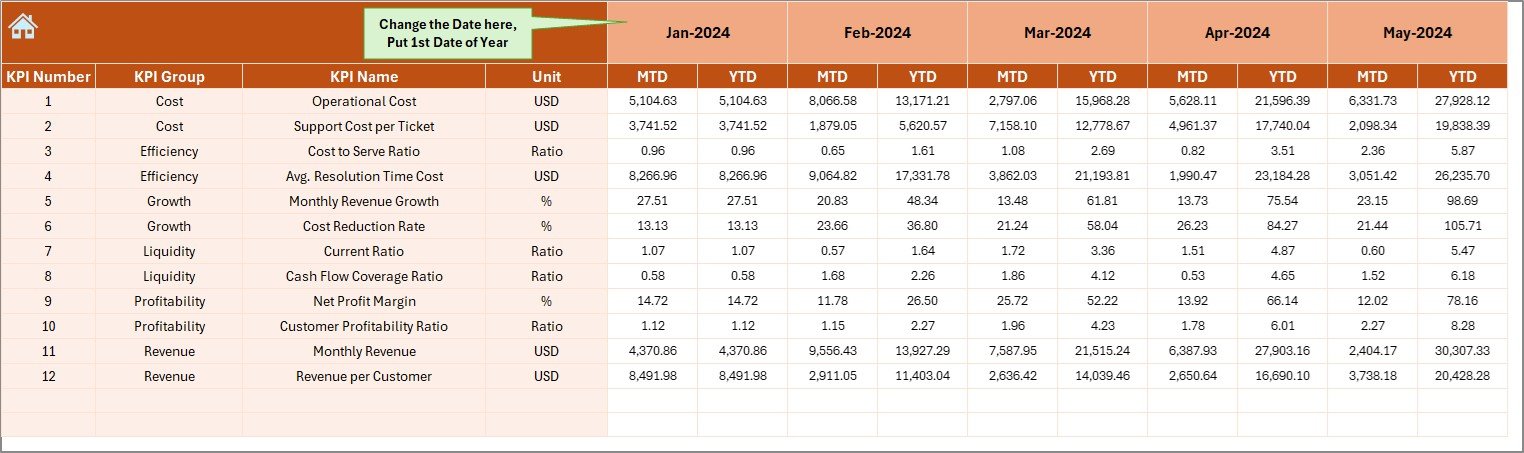
📊 Actual Numbers Input Sheet: User-friendly data entry layout
-
🎯 Target Sheet: Monthly MTD and YTD goal setting
-
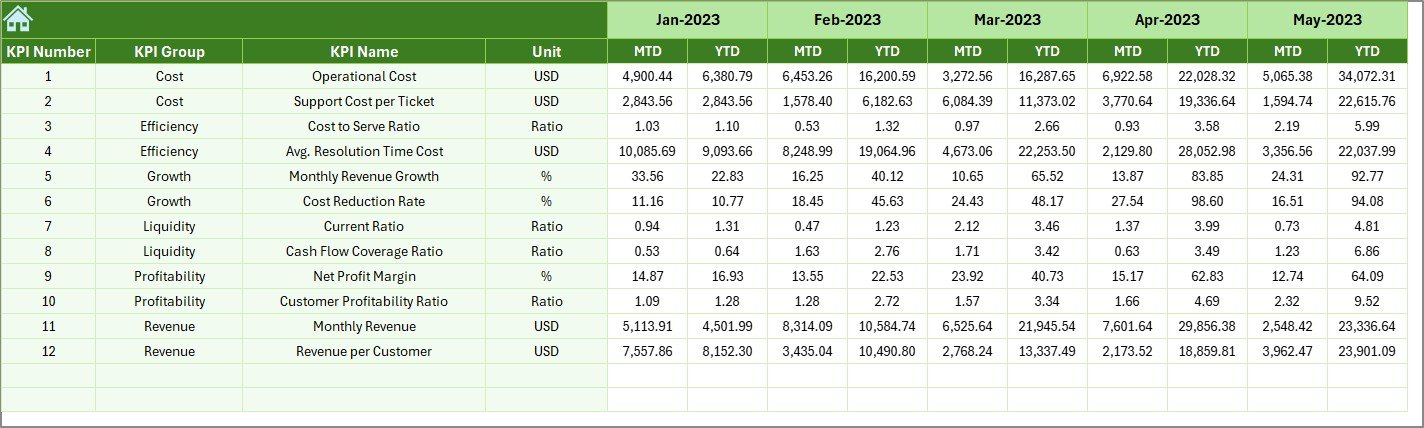
🔙 Previous Year Numbers Sheet: Historical data input for powerful YOY comparison
-
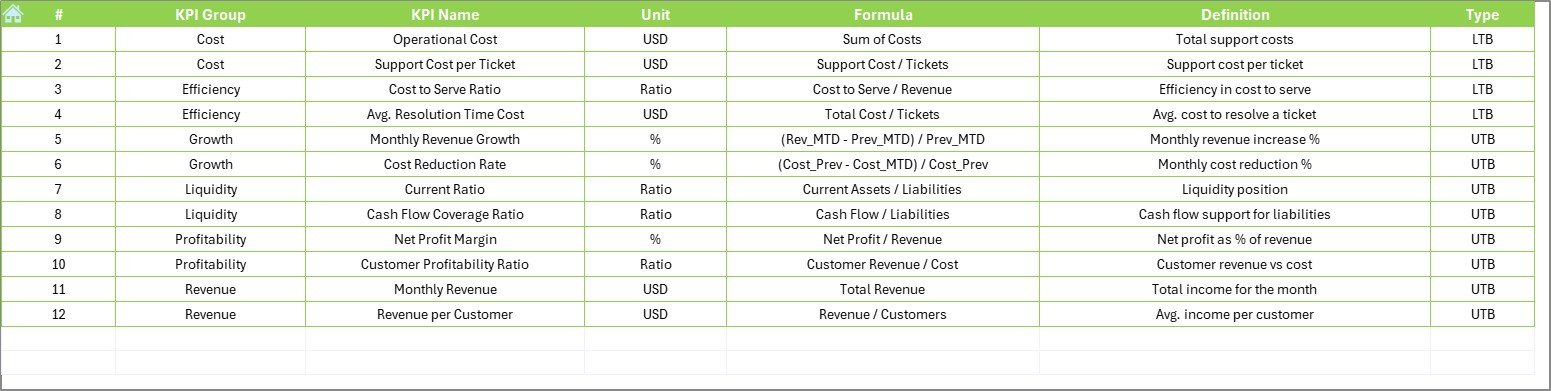
📘 KPI Definition Sheet: A clear dictionary of each KPI, formula, and benchmark type
🛠️ How to Use the Customer Service and Support Financial Health KPI Dashboard in Excel
Using this dashboard is a breeze—no advanced Excel skills needed!
-
✅ Download and Open the File
-
📘 Define your KPIs in the KPI Definition Sheet
-
🎯 Input Monthly Targets in the Target Sheet
-
📊 Enter Actual Data monthly in the Actuals Sheet
-
🔍 Use the Dashboard and Trend Sheet to visualize performance
Your MTD and YTD metrics update instantly, helping you make informed decisions on the fly!
👥 Who Can Benefit from This Financial Health KPI Dashboard
🎯 Customer Service Managers: Optimize resource allocation and track financial goals.
📊 Finance Analysts: Measure ROI and cost effectiveness of support teams.
🧑💼 Operations Leads: Align service delivery with budget constraints.
🏢 Small Business Owners: Make data-backed decisions without needing complex BI software.
📉 Customer Support Teams: Gain visibility into their performance impact on finances.
💼 Consultants & Freelancers: Offer this as a tool to help clients with financial control.
🔗 Click here to read the Detailed blog post
📺 Visit our YouTube channel to learn step-by-step video tutorials


Reviews
There are no reviews yet.