
The Retail KPI Dashboard in Power BI is an essential tool for retail managers, business owners, and marketing professionals who want to optimize their retail operations and make data-driven decisions. This Power BI dashboard provides real-time insights into key performance indicators (KPIs) such as sales performance, inventory levels, customer satisfaction, and store efficiency, enabling you to monitor and improve the overall performance of your retail business.
Whether you’re managing a chain of stores, a single retail outlet, or an e-commerce platform, the Retail KPI Dashboard in Power BI gives you a centralized view of your business performance. It helps you track sales trends, identify operational inefficiencies, optimize inventory, and enhance the customer experience, all while reducing costs and increasing profitability.
Key Features of the Retail KPI Dashboard in Power BI
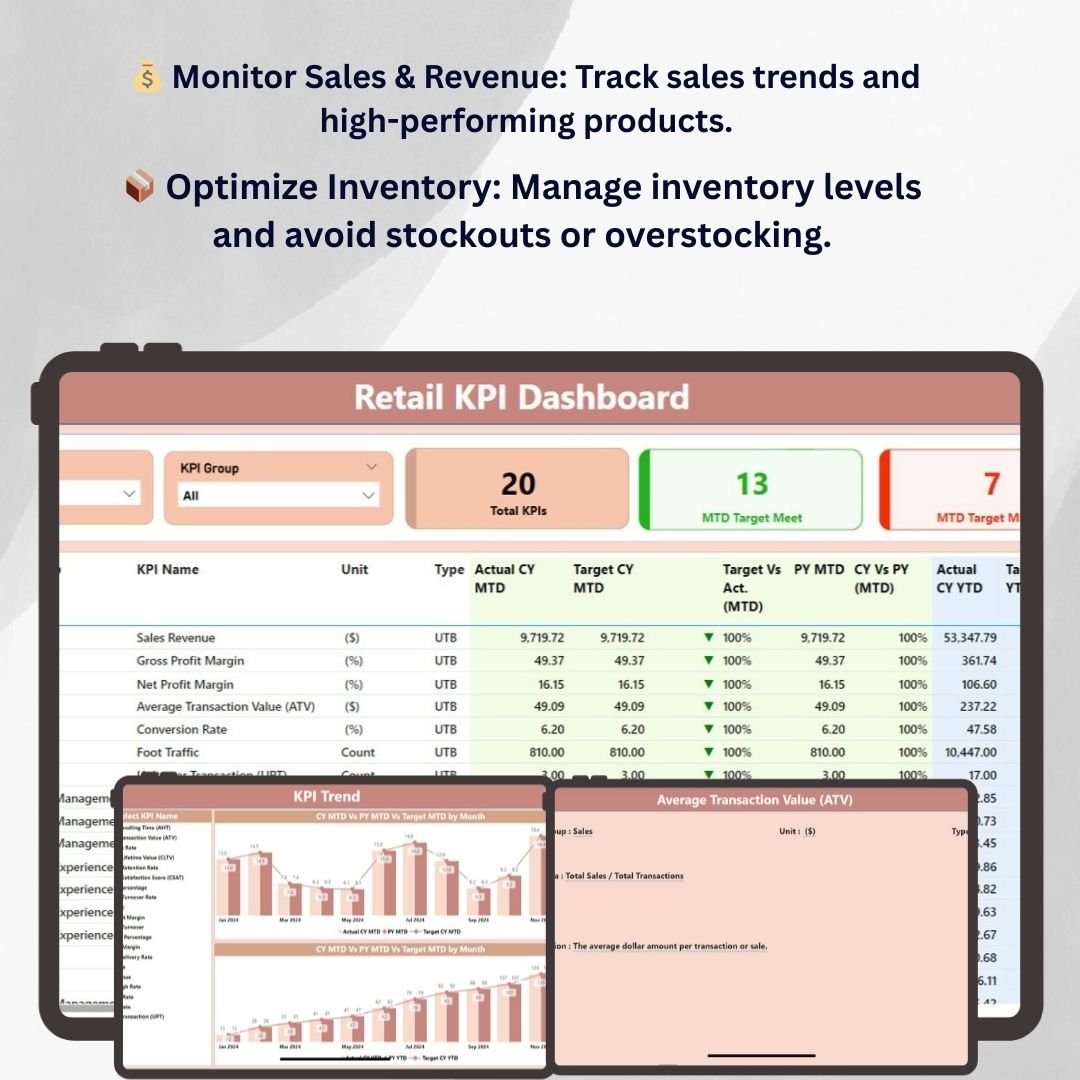
💰 Track Sales Performance & Revenue
Monitor sales trends and track revenue across multiple stores, regions, or sales channels. Identify high-performing products and categories, and use this data to optimize inventory and marketing efforts.
📦 Inventory Management & Optimization
Track inventory levels, stock turnover rates, and product availability. The dashboard helps you optimize stock levels to avoid overstocking or stockouts, ensuring smooth operations and satisfied customers.
📈 Customer Satisfaction Metrics
Monitor customer satisfaction levels by tracking reviews, ratings, and customer feedback. Analyze trends in customer satisfaction and identify areas for improvement in the shopping experience.
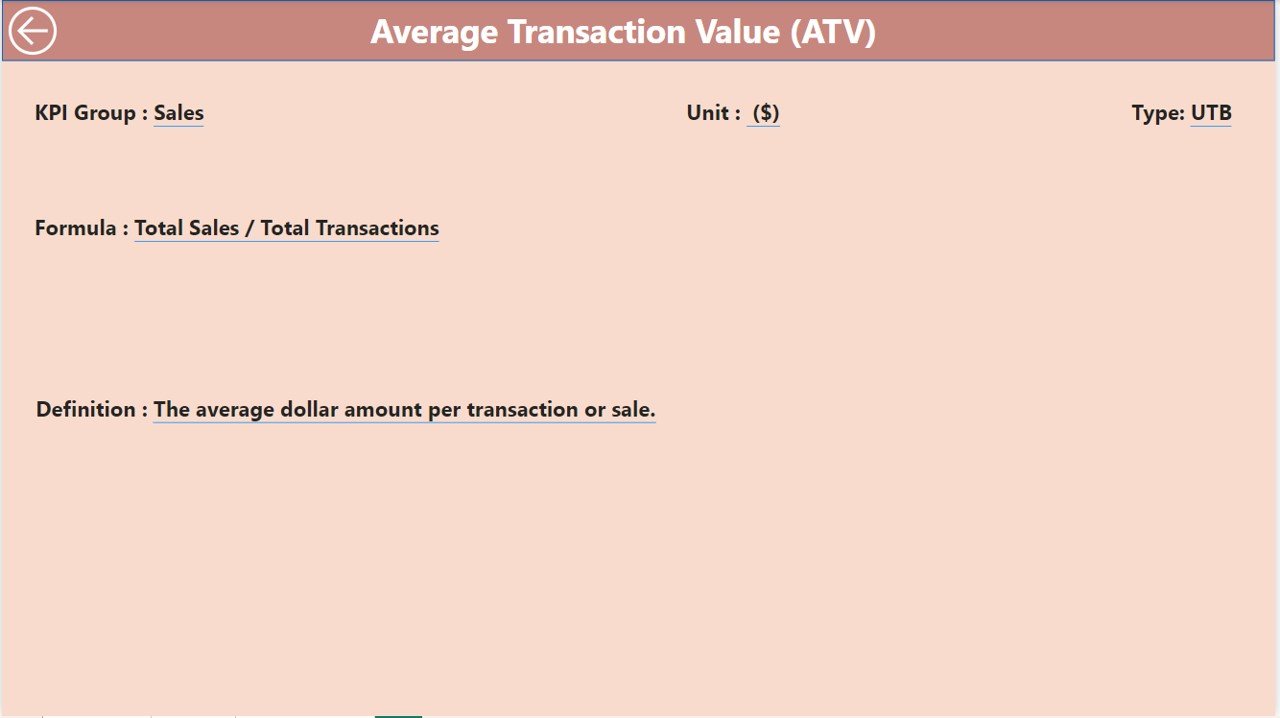
⚡ Store Efficiency & Productivity
Track store performance metrics such as foot traffic, average transaction value, and conversion rates. Use insights to optimize store layout, staffing, and product placement for maximum efficiency.
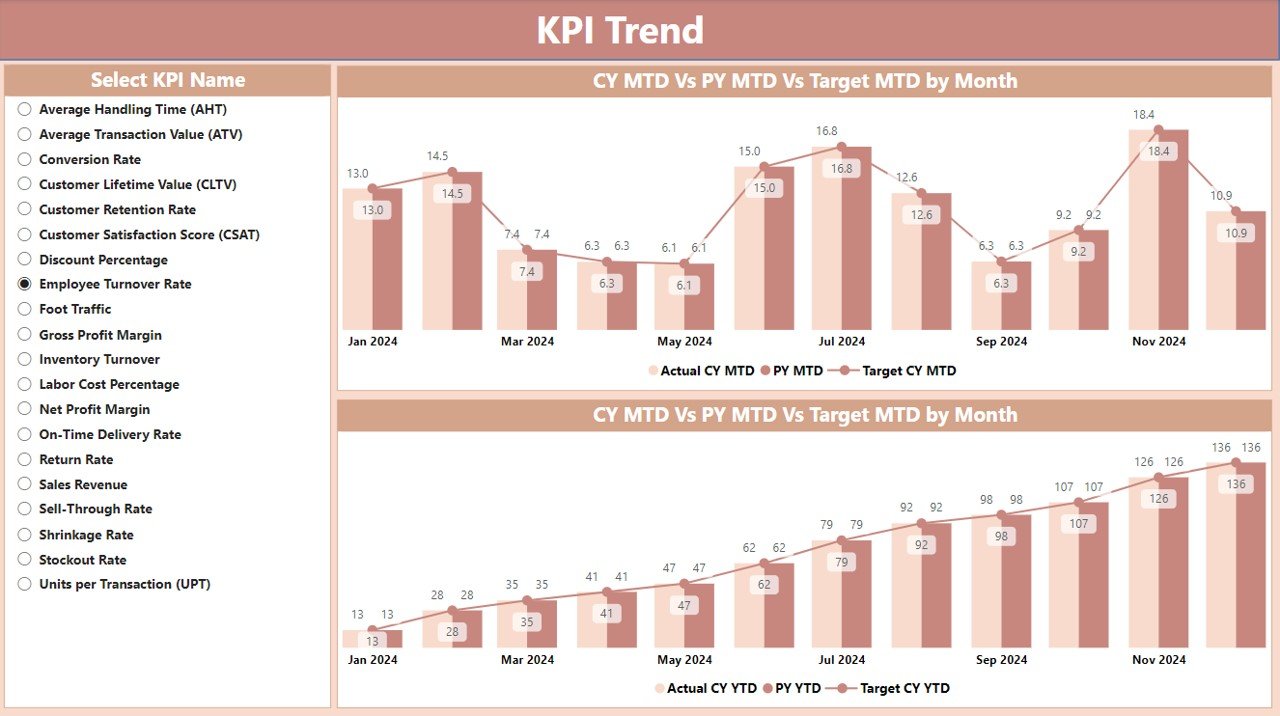
🖥️ Interactive & Real-Time Insights
The Power BI dashboard offers dynamic visualizations, slicers, and filters to explore your data in real-time. Stay updated on key retail metrics, and make informed decisions to enhance operational efficiency and profitability.
Why You’ll Love the Retail KPI Dashboard in Power BI

✅ Monitor Sales Performance & Revenue
Track sales trends, identify top-selling products, and assess revenue performance across different locations or channels. Use data insights to boost sales and profitability.
✅ Optimize Inventory Management
Ensure that inventory levels are optimized by monitoring stock turnover, product availability, and restocking needs. Improve inventory management to reduce costs and improve customer satisfaction.
✅ Enhance Customer Satisfaction
Track customer satisfaction and feedback to ensure that your retail business is meeting customer expectations. Use insights to improve service, product offerings, and the shopping experience.
✅ Boost Store Efficiency & Productivity
Track key store performance metrics to improve operational efficiency. Optimize staffing, store layout, and product placement to boost foot traffic, sales, and customer satisfaction.
✅ Make Data-Driven Decisions
Leverage real-time data to make informed decisions about sales, inventory, and customer experience. Optimize your retail strategies for better profitability and operational performance.
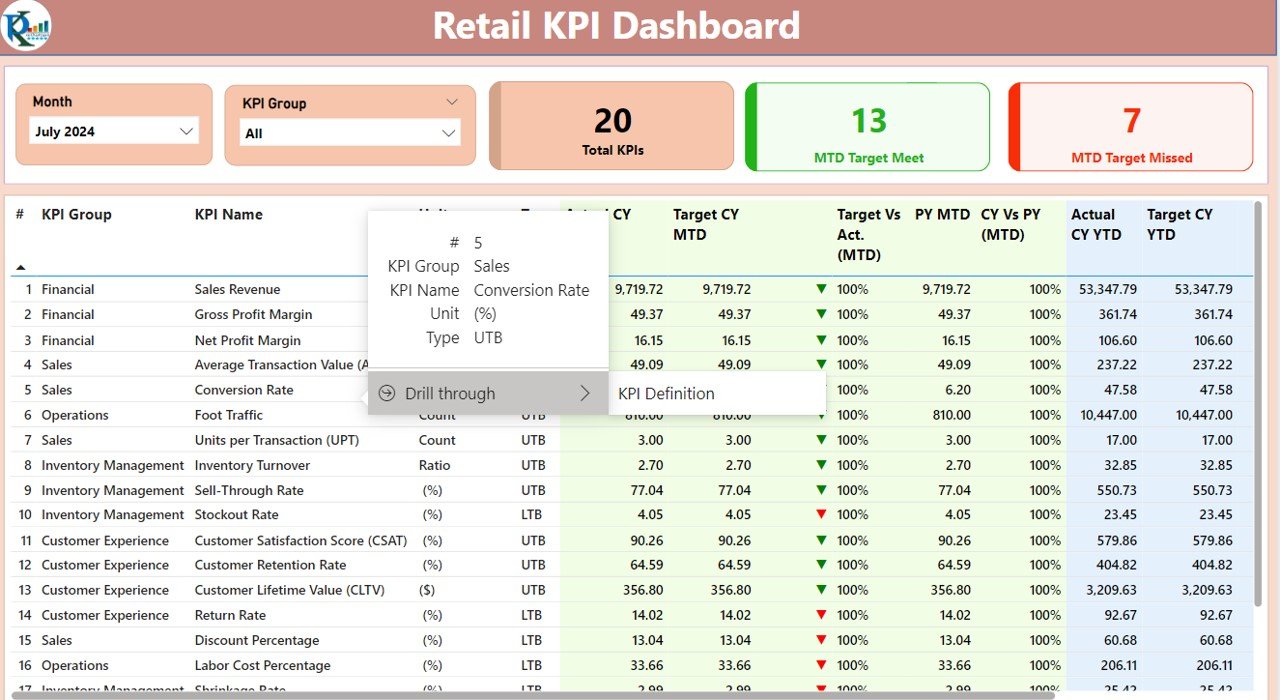
What’s Inside the Retail KPI Dashboard Template?
- Sales Performance Tracking: Monitor sales trends, revenue, and high-performing products.
- Inventory Management: Track inventory levels, stock turnover, and product availability.
- Customer Satisfaction Tracking: Measure customer satisfaction, reviews, and feedback.
- Store Efficiency Metrics: Monitor foot traffic, transaction value, and conversion rates.
- Real-Time Insights: Get live updates on key performance metrics to enhance decision-making.
- Customizable KPIs: Tailor the dashboard to track KPIs that are specific to your retail operations.
How to Use the Retail KPI Dashboard in Power BI
1️⃣ Download the Template: Get instant access to your Retail KPI Dashboard in Power BI.
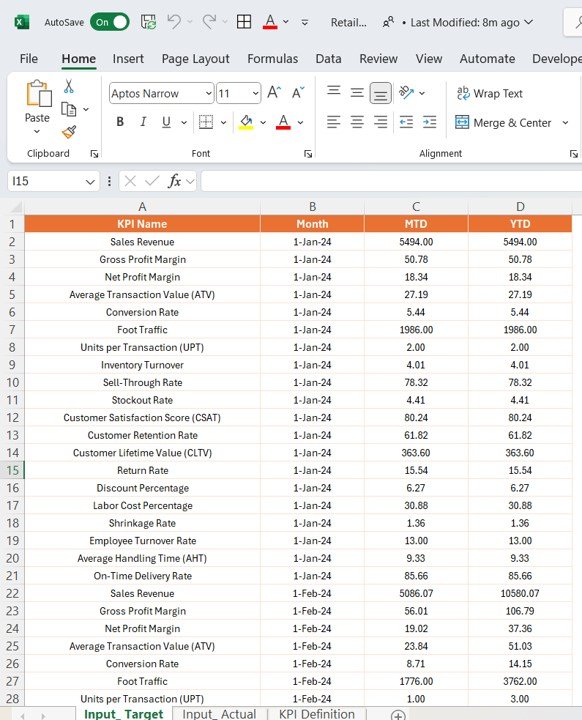
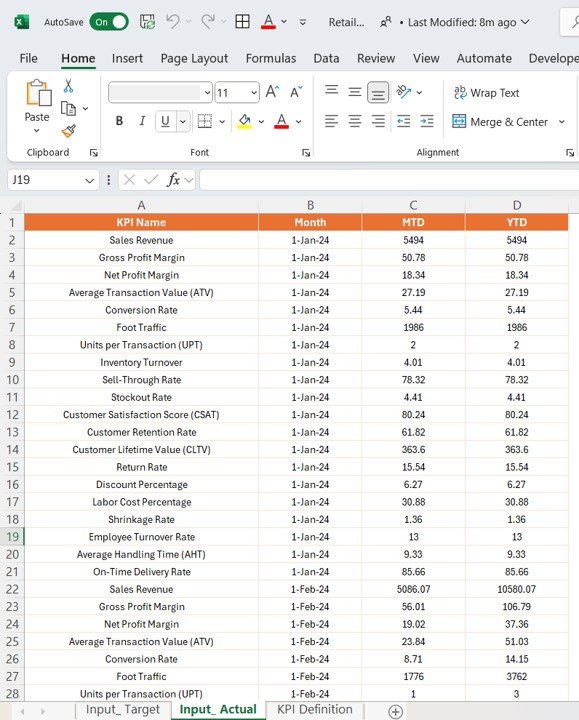
2️⃣ Input Your Data: Enter sales, inventory, customer satisfaction, and store performance data into the dashboard.
3️⃣ Track & Monitor KPIs: Use the dashboard to track sales performance, inventory, customer satisfaction, and operational metrics in real-time.
4️⃣ Analyze & Optimize: Use insights from the dashboard to optimize inventory management, improve store operations, and enhance the customer experience.
Who Can Benefit from the Retail KPI Dashboard in Power BI?
🔹 Retail Managers & Store Owners
🔹 E-Commerce Business Owners
🔹 Inventory & Supply Chain Managers
🔹 Marketing & Customer Experience Teams
🔹 Business Analysts & Data Analysts in Retail
🔹 Anyone Looking to Optimize Retail Performance & Boost Sales
Streamline your retail operations with the Retail KPI Dashboard in Power BI. Track key sales, inventory, and customer satisfaction metrics to optimize operations, increase profitability, and improve the customer experience.
Click here to read the Detailed blog post
Visit our YouTube channel to learn step-by-step video tutorials
Youtube.com/@PKAnExcelExpert


Reviews
There are no reviews yet.