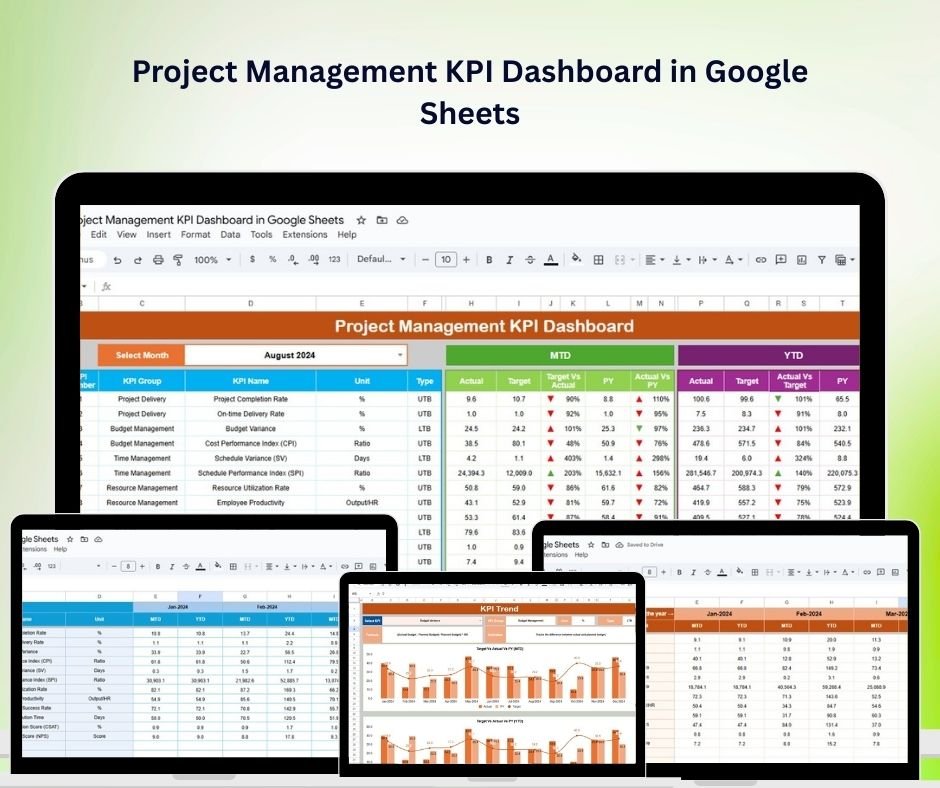


The Project Management KPI Dashboard in Google Sheets is a dynamic tool that helps you efficiently track and manage your projects. Whether you’re managing a small team or overseeing a large-scale initiative, this dashboard gives you the power to monitor key performance indicators (KPIs) in real-time, making project tracking more manageable than ever.
With its easy-to-use layout and highly customizable features, the Project Management KPI Dashboard ensures you have all the critical project metrics at your fingertips. From tracking project timelines to budget adherence, risk management, and resource allocation, this Google Sheets-based dashboard makes project management a breeze.

Key Features of the Project Management KPI Dashboard in Google Sheets
📊 Comprehensive KPI Tracking
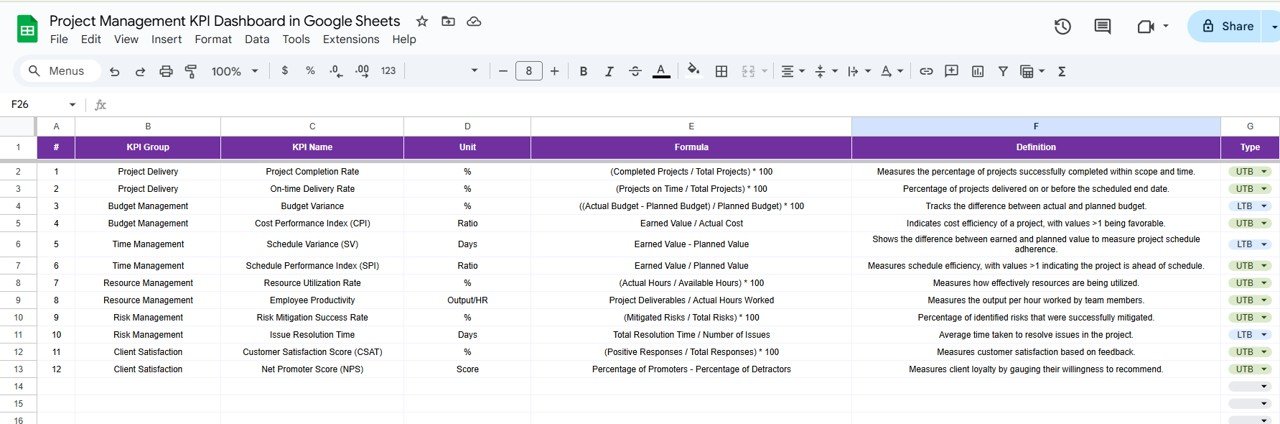
This dashboard tracks vital KPIs such as project completion percentage, budget variance, schedule adherence, and resource utilization, providing real-time insights into every aspect of your project’s progress.
⏳ Timeline & Schedule Management
Easily monitor project milestones and deadlines with an intuitive Gantt chart and progress bars that update automatically as you input data, ensuring that you’re always on track.
💸 Budget Monitoring & Variance Tracking
Keep an eye on the project budget and track expenditures against the planned budget, with automatic variance analysis to help you stay within financial limits.
🔄 Resource Allocation Tracker
Ensure that resources are efficiently distributed by tracking resource usage and availability throughout the project lifecycle.
⚖️ Risk Management & Issue Tracking
Identify potential risks and issues early, and track their resolution status. This ensures that you can proactively mitigate risks and keep your project on track.
Why You’ll Love This Project Management KPI Dashboard
✅ Real-Time Data – Get up-to-date information on project performance with automatic updates based on the data you input. ✅ Customizable Inputs – Tailor the dashboard to suit the unique needs of your project by adding or modifying KPIs, budget categories, or resource fields. ✅ Streamlined Project Tracking – Track multiple projects simultaneously with a clean, organized interface that consolidates all the data in one place. ✅ User-Friendly Design – The dashboard is designed with ease of use in mind, making it suitable for users of all skill levels. No advanced technical knowledge is required! ✅ Instant Access & Simple Setup – Download the template instantly after purchase and start tracking your project KPIs right away.
What’s Inside the Project Management KPI Dashboard?
📅 Timeline Sheet – A sheet dedicated to tracking project milestones and deadlines, along with the status of each. 📊 KPI Dashboard – A visual representation of your project’s overall health, including project completion percentage, budget status, and resource usage. 📋 Budget & Cost Tracker – A sheet for monitoring the project’s budget and tracking expenses in real-time. 🧑💻 Resource Allocation – Manage and track the distribution of resources, ensuring maximum productivity. ⚠️ Risk Management Sheet – Identify and track risks and issues to keep your project on course.
How to Use the Project Management KPI Dashboard
1️⃣ Download the Template – Instantly access the Google Sheets template after purchase. 2️⃣ Customize Inputs – Enter your project-specific data, such as project name, milestones, budget, and resources. 3️⃣ Monitor & Track KPIs – Use the intuitive interface to track your project’s progress, identify issues, and ensure you stay on schedule and within budget. 4️⃣ Stay Proactive – With risk tracking and resource management, you can anticipate issues and take action before they impact your project.
Who Can Benefit from This Dashboard?
🔹 Project Managers
🔹 Team Leaders
🔹 Freelancers & Consultants
🔹 Small Business Owners
🔹 Large Corporations Managing Multiple Projects
Click here to read the Detailed blog post
Project Management KPI Dashboard in Google Sheets
Visit our YouTube channel to learn step-by-step video tutorials
Youtube.com/@PKAnExcelExpert


Reviews
There are no reviews yet.