Performance tracking in the pharmaceutical industry demands accuracy, compliance, and speed. From production quality to regulatory compliance and supply chain efficiency, every KPI matters. However, when performance data is scattered across multiple reports and spreadsheets, management reviews become slow and decision-making turns reactive.
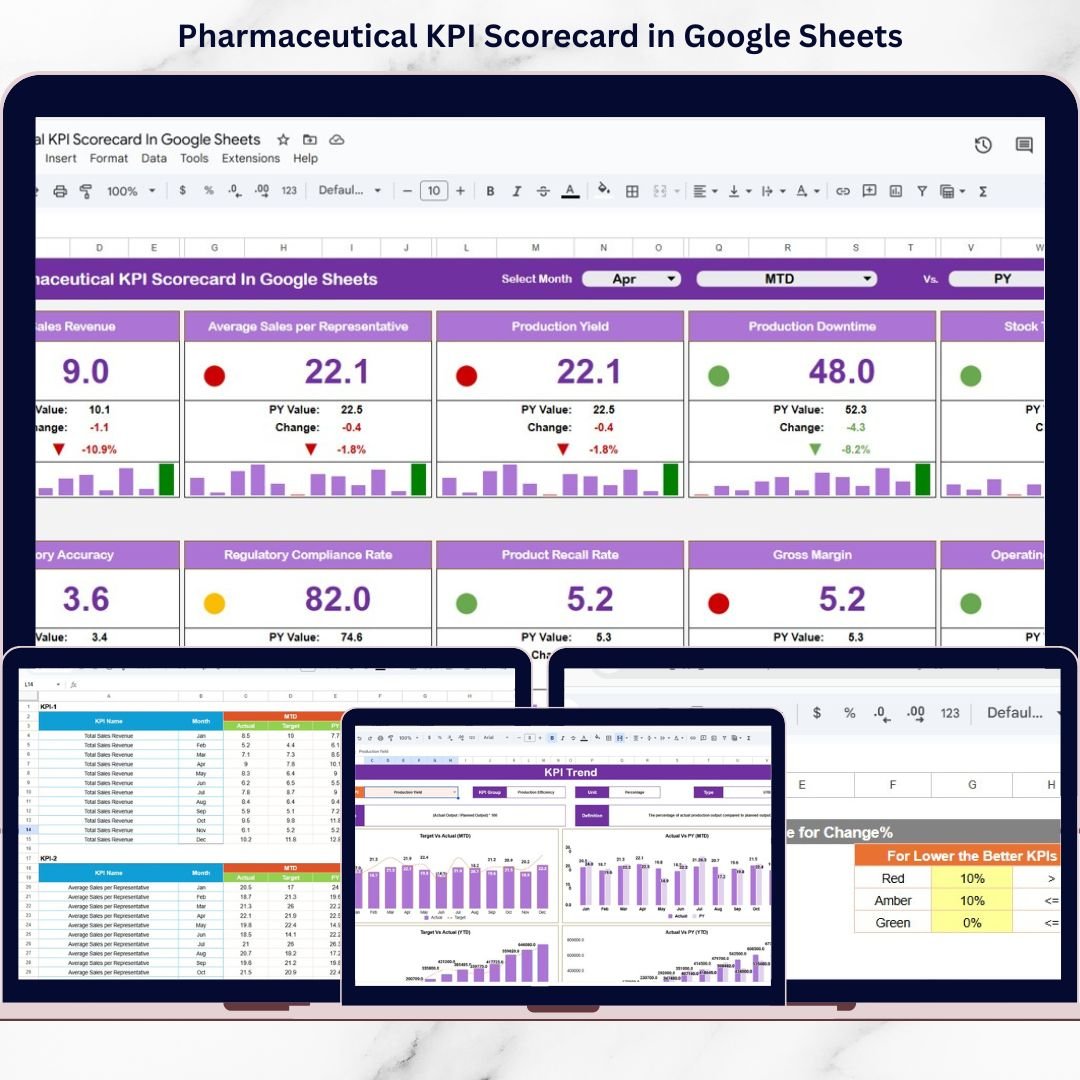
The Pharmaceutical KPI Scorecard in Google Sheets is a ready-to-use, visually powerful performance scorecard designed to help pharmaceutical teams track monthly and yearly KPIs using traffic lights, trend arrows, and percentage change indicators. Instead of manually comparing numbers, leadership can instantly understand performance status, improvement areas, and risk signals — all in one structured scorecard.
Built in Google Sheets, this scorecard combines simplicity, clarity, and collaboration, making it ideal for pharmaceutical operations, quality, and management teams.
🚀 Key Features of Pharmaceutical KPI Scorecard in Google Sheets
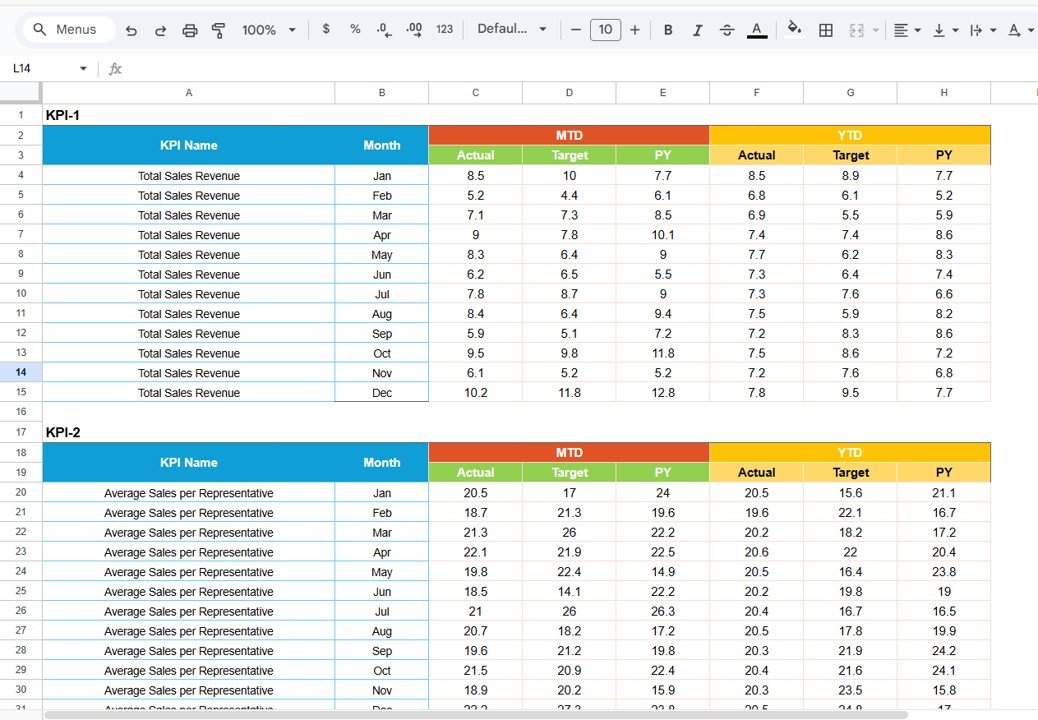
✅ Monthly & Yearly KPI Scorecard with MTD and YTD views
✅ Dynamic Month Selection Dropdown for instant updates
✅ Traffic Light Indicators (Green / Amber / Red) for quick decisions
✅ Up & Down Trend Arrows with percentage change
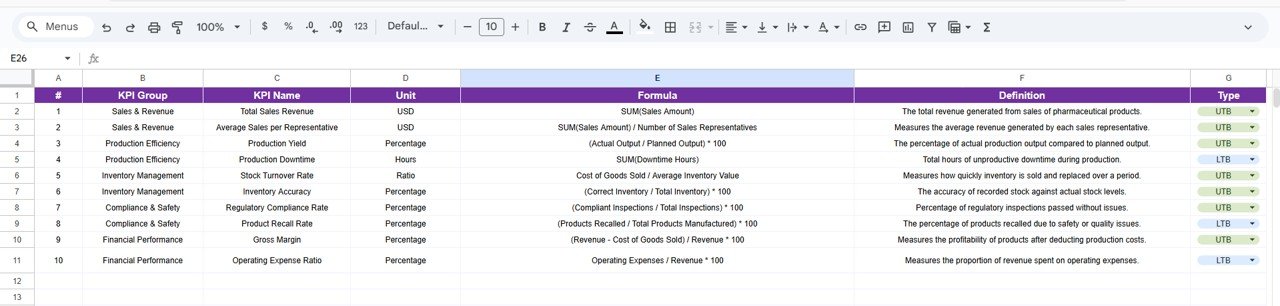
✅ 10 Critical Pharmaceutical KPIs (fully customizable)
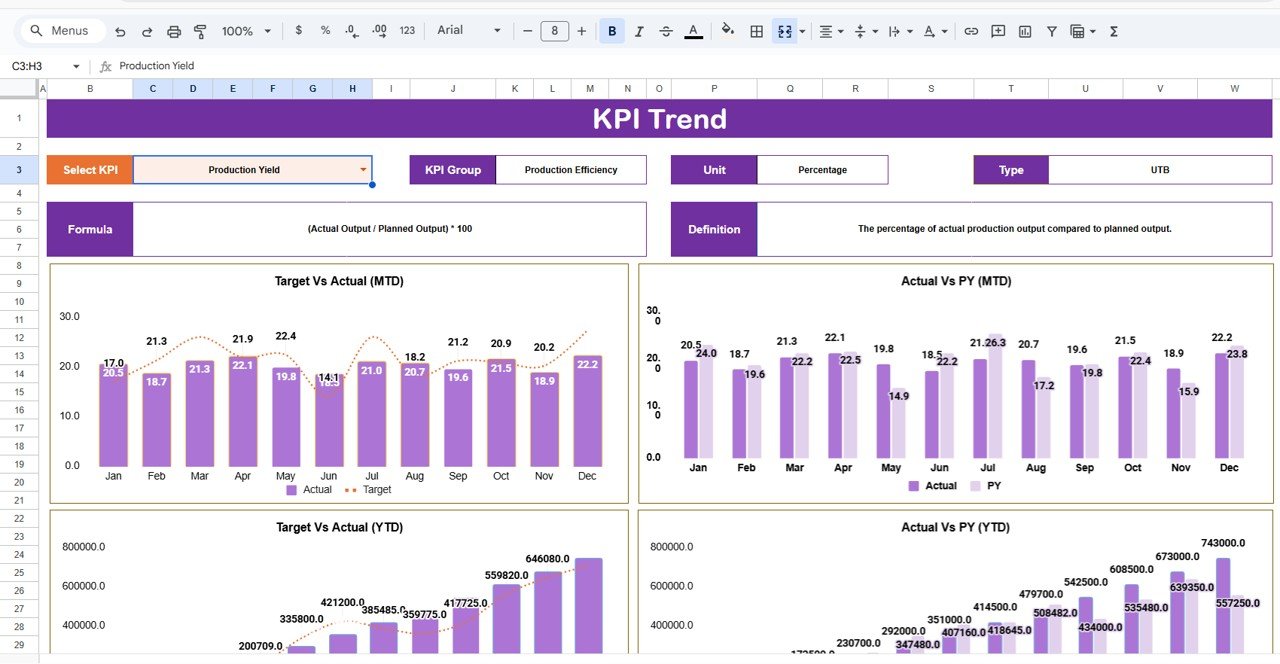
✅ KPI Trend Analysis Sheet for historical performance tracking
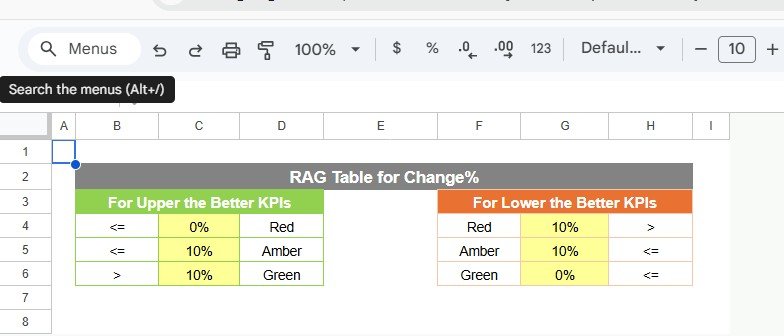
✅ LTB / UTB KPI Logic (Lower the Better / Upper the Better)
✅ Google Sheets–Based Design for cloud access and collaboration
📂 What’s Inside the Pharmaceutical KPI Scorecard
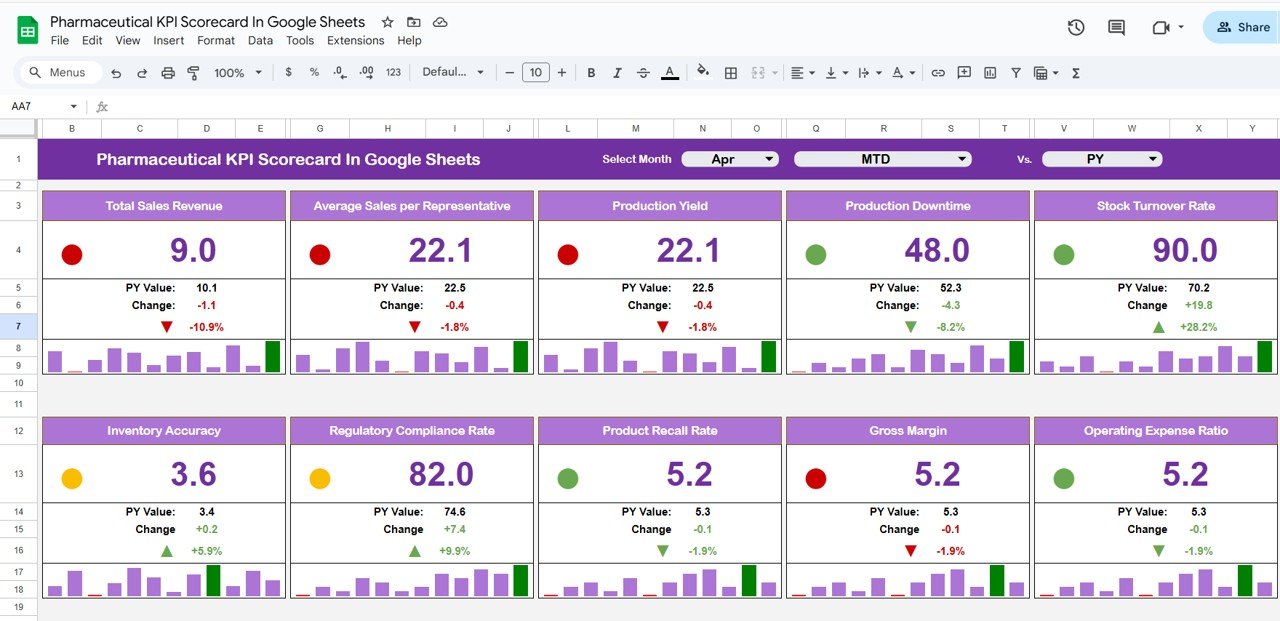
📌 Main KPI Scorecard Sheet
This is the core performance page where users view KPI status for the selected month or year. It displays actual values, targets, % change, arrows, and traffic lights in a clean scorecard format.
📌 MTD & YTD Toggle View
Switch easily between Monthly (MTD) and Year-to-Date (YTD) performance to review short-term execution and long-term trends.
📌 Trend Sheet
Analyze individual KPIs over time with structured trend analysis. This sheet displays KPI group, unit, KPI type (LTB/UTB), formula, definition, and trend patterns.
📌 KPI Definition Sheet
A master reference table that maintains KPI name, group, unit, formula, definition, and KPI type — ensuring clarity and consistency across teams.
📌 Data Input Sheet
A structured data entry sheet where monthly KPI values are entered. All scorecards and trend visuals update automatically without manual calculations.
Every sheet is designed to support accurate performance tracking and faster management reviews.
🛠️ How to Use the Pharmaceutical KPI Scorecard
1️⃣ Define KPIs clearly in the KPI Definition sheet
2️⃣ Enter monthly KPI values in the Data Input sheet
3️⃣ Select the desired month from the dropdown
4️⃣ Toggle between MTD and YTD views
5️⃣ Review traffic lights and trend arrows instantly
6️⃣ Use trend insights for corrective and preventive actions
No complex formulas. No BI tools. Just clear pharmaceutical performance insights.
🎯 Who Can Benefit from This Pharmaceutical KPI Scorecard
🏭 Pharmaceutical Operations Teams – Monitor production and efficiency KPIs
🧪 Quality & Compliance Teams – Track quality and regulatory metrics
🚚 Supply Chain Managers – Improve delivery and inventory performance
🏗️ Manufacturing Heads – Identify operational bottlenecks
📦 Sales & Distribution Teams – Review fulfillment and growth KPIs
👔 Senior Management – Make data-driven performance decisions
Whether managing a single plant or multiple operations, this scorecard scales easily.
🔗 Click here to read the Detailed blog post
Watch the step-by-step video tutorial:


