
Operational efficiency is the backbone of every successful organization. However, many operations teams still rely on static spreadsheets and disconnected reports to track performance. As a result, KPI monitoring becomes inconsistent, trends remain unclear, and decision-making is delayed.
That is exactly why the Operations KPI Scorecard in Google Sheets becomes a powerful and practical solution.
This ready-to-use scorecard provides a structured, visual, and data-driven framework to monitor key operational KPIs using traffic-light indicators, trend arrows, and automatic MTD (Month-to-Date) and YTD (Year-to-Date) calculations—all within Google Sheets.
Instead of manually reviewing raw numbers, operations teams can instantly see which KPIs are improving, declining, or missing targets, enabling faster corrective actions and better accountability.
Because the scorecard is built in Google Sheets, it is cloud-based, collaborative, cost-effective, and easy to customize, without requiring advanced BI tools or technical expertise.
⚙️ Key Features of the Operations KPI Scorecard
🔹 Structured KPI Monitoring
Track 10 predefined operational KPIs in a single, standardized scorecard view.
🔹 MTD & YTD Performance Tracking
Analyze both short-term execution and long-term operational performance.
🔹 Traffic-Light Indicators
Red, Amber, and Green status colors clearly highlight KPI health.
🔹 Percentage Change Arrows
Up and down arrows show whether performance is improving or declining.
🔹 Dynamic Month Selection
Select any month from the dropdown and refresh the entire scorecard instantly.
🔹 KPI Trend & Definition Transparency
Understand KPI behavior, formulas, and intent using dedicated trend and definition sheets.
📁 Sheet-Wise Structure of the Operations KPI Scorecard
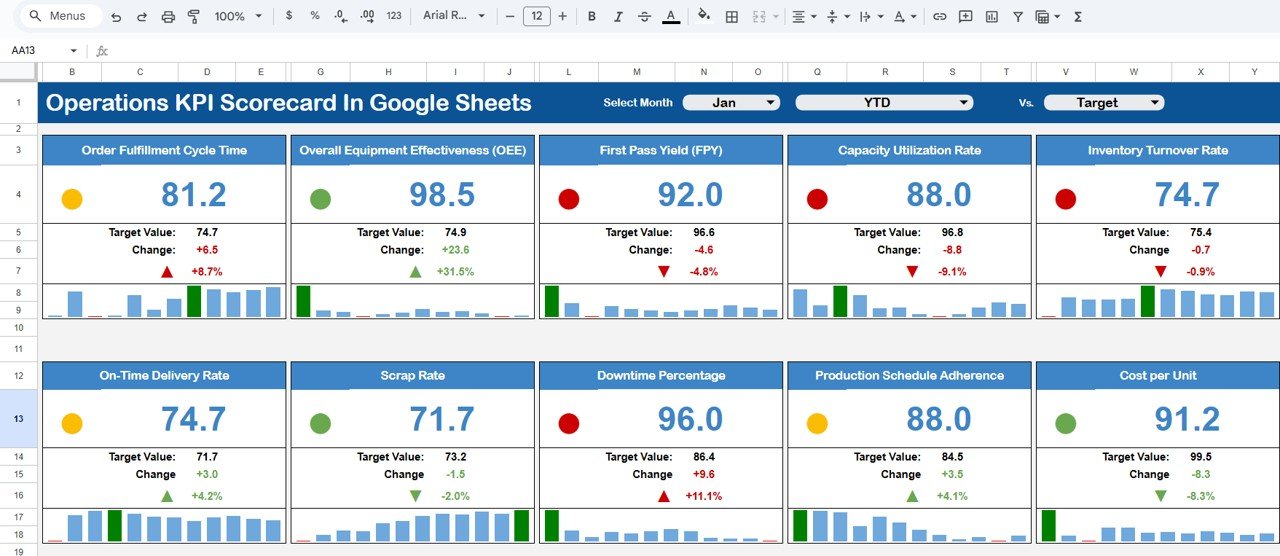
🧭 Dashboard Sheet – Main Scorecard View
This is the primary scorecard page used by managers and leadership.
What You See on the Dashboard:
-
Month selector at the top
-
10 operational KPIs displayed in a clean scorecard layout
For Each KPI, the Dashboard Shows:
-
MTD Actual vs Target
-
MTD Actual vs Previous Year
-
YTD Actual vs Target
-
YTD Actual vs Previous Year
Traffic-light colors and up/down arrows make performance interpretation instant and intuitive.
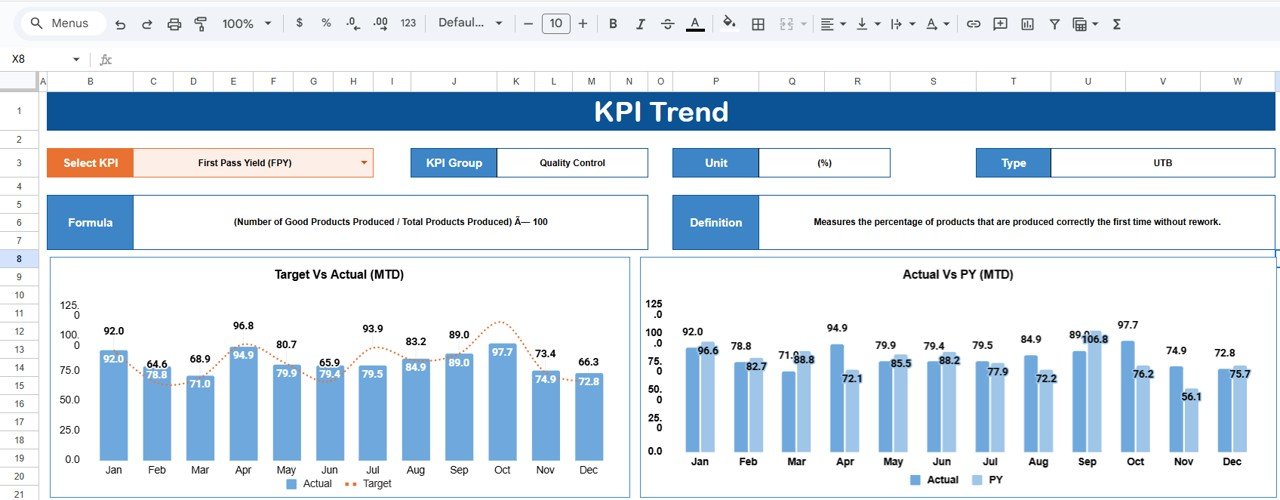
📈 KPI Trend Sheet – Deeper KPI Analysis
The KPI Trend sheet explains and contextualizes performance trends.
Features Include:
-
KPI selection dropdown (Cell C3)
-
KPI Group
-
Unit of Measurement
-
KPI Type:
-
UTB (Upper the Better)
-
LTB (Lower the Better)
-
-
KPI Formula
-
KPI Definition
This sheet helps teams understand why a KPI is performing the way it is, making it ideal for reviews and audits.
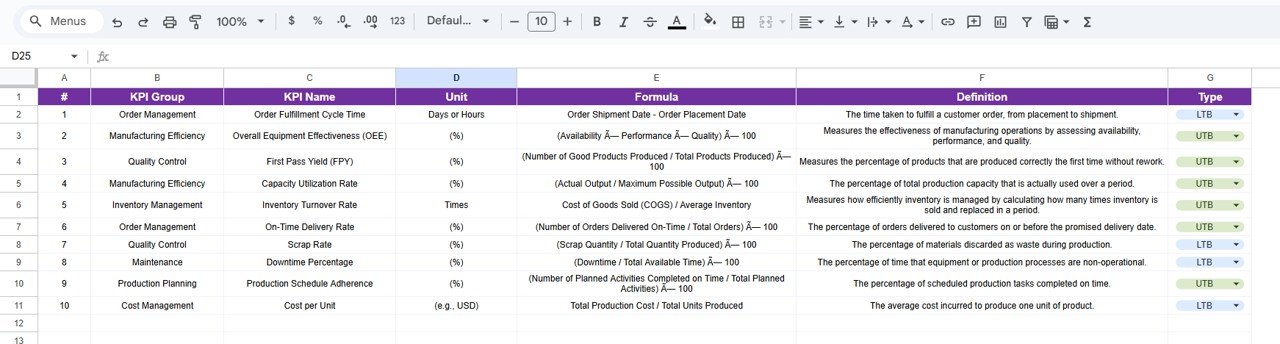
📘 KPI Definition Sheet – KPI Governance
The KPI Definition sheet acts as the master reference.
Columns Included:
-
KPI Name
-
KPI Group
-
Unit
-
Formula
-
KPI Definition
This ensures consistent KPI interpretation across departments and reporting cycles.
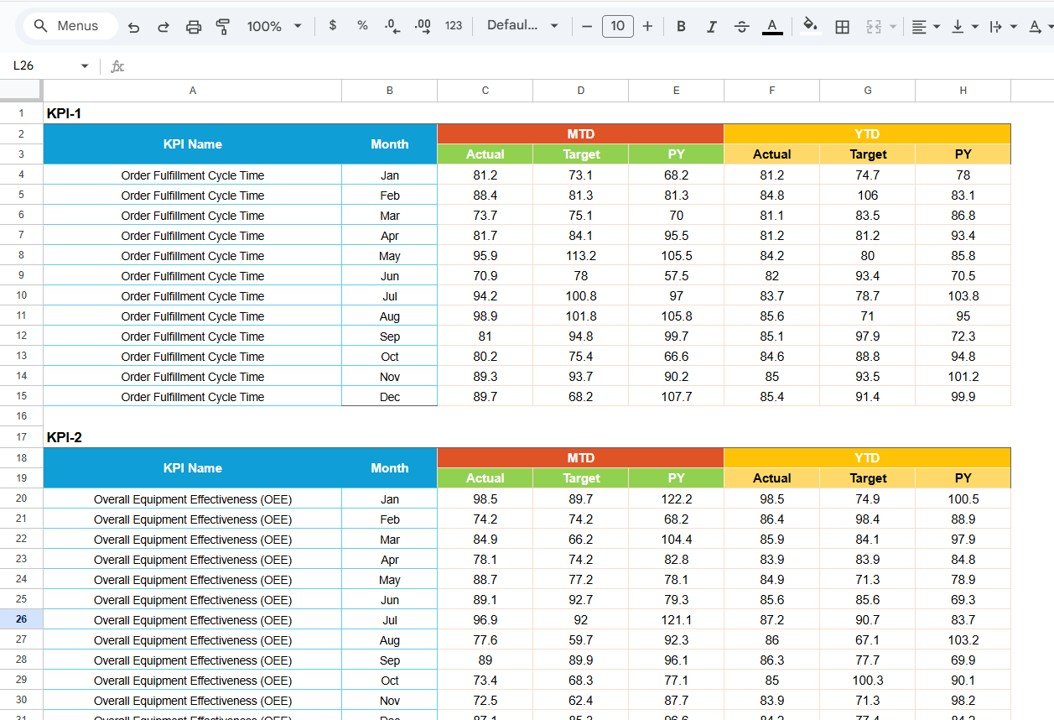
🧾 Data Input Sheet – Simple Data Entry
This sheet is used to enter operational performance data.
Key Benefits:
-
Structured and easy data entry
-
Monthly updates only
-
Automatic calculation of MTD, YTD, trends, and indicators
No manual formulas are required by end users.
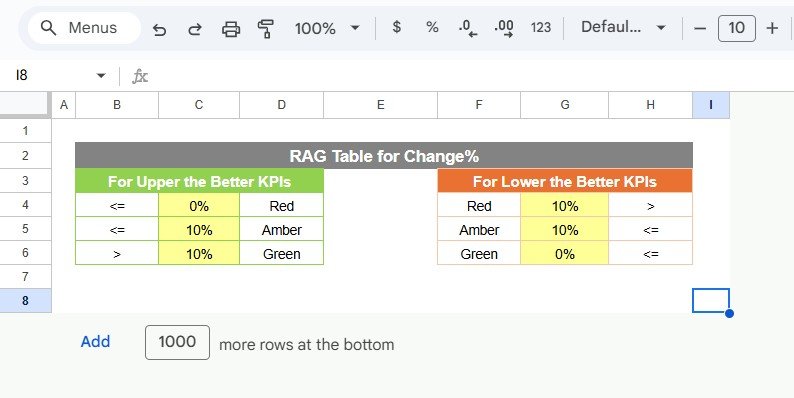
🎨 Colour Settings Sheet – Visual Customization
The Colour Settings sheet allows users to customize:
-
Traffic-light thresholds
-
Arrow logic
-
Performance color rules
This makes the scorecard adaptable to different operational standards and branding needs.
🎯 Advantages of the Operations KPI Scorecard
-
Centralized operational KPI tracking
-
Clear visibility into performance gaps
-
Faster, data-driven decision-making
-
Consistent KPI measurement month after month
-
Cloud-based collaboration in Google Sheets
-
No coding or BI tools required
🚀 Opportunities for Improvement
You can further enhance this scorecard by adding:
-
Department-wise or process-wise scorecards
-
Additional KPIs as operations scale
-
Automated data capture via Google Forms
-
Benchmark or rolling-average comparisons
👥 Who Should Use This Scorecard
-
Operations Managers
-
Plant & Facility Managers
-
Process Improvement Teams
-
Business Analysts
-
Senior Leadership
-
SMEs and growing organizations
### Click here to read the Detailed blog post
Watch the step-by-step video tutorial:


Reviews
There are no reviews yet.