


In today’s data-driven poultry industry, success depends on how well you track, analyze, and act on performance insights. Whether you manage a small flock or a large-scale farm, understanding your key operational and financial metrics is essential for growth.
The Poultry Farming KPI Dashboard in Excel provides a powerful yet simple way to measure and improve your farm’s efficiency. Built in Microsoft Excel, this ready-to-use dashboard consolidates production, cost, and flock health data into one easy-to-understand interface — enabling farm owners and managers to make smarter, faster, and more profitable decisions.
With just a few clicks, you can monitor feed conversion, mortality rates, egg production, and profitability trends — all without needing expensive farm management software.
⚙️ Key Features of the Poultry Farming KPI Dashboard in Excel
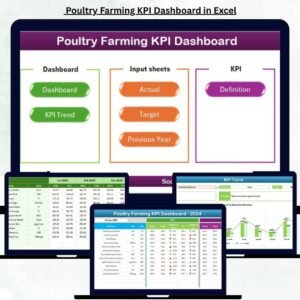
📊 7 Structured Sheets: Home, Dashboard, KPI Trend, Actual Numbers Input, Target, Previous Year, and KPI Definition.
🧭 Navigation Buttons: Instantly move across sheets without scrolling.
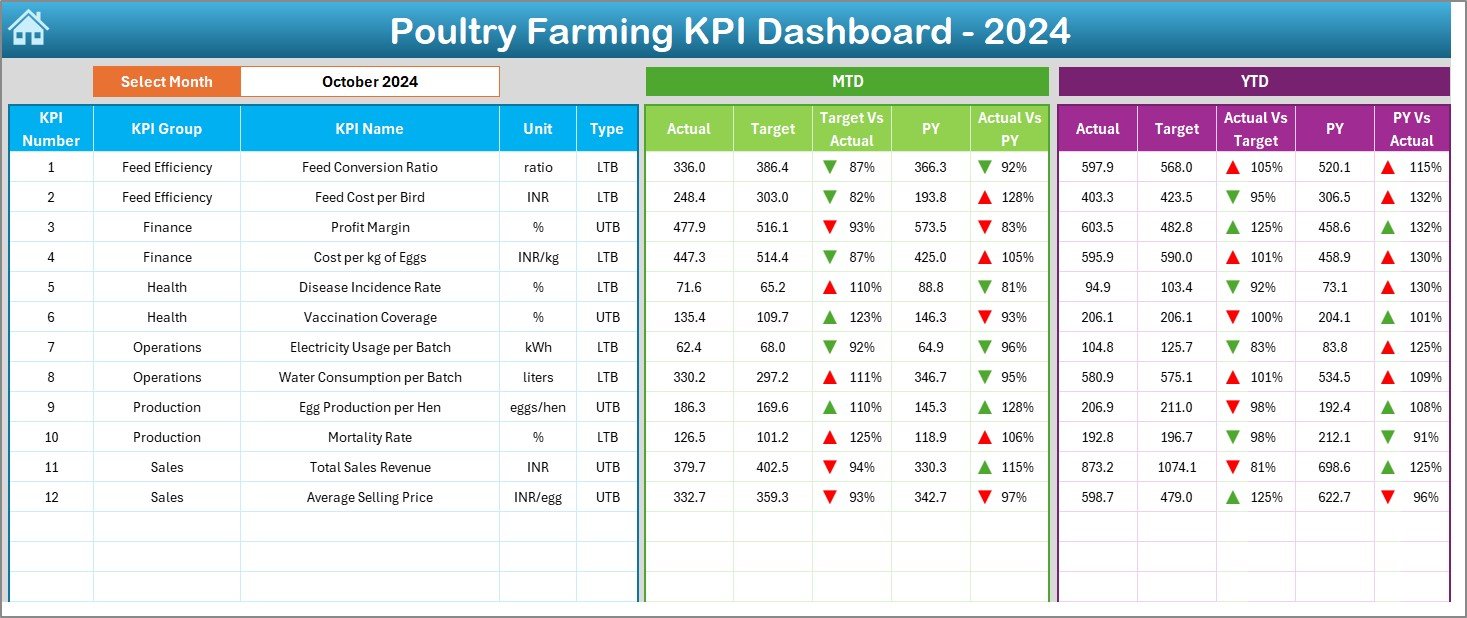
📈 Dynamic Dashboard: View MTD (Month-to-Date) and YTD (Year-to-Date) results in real time.
🎯 Target vs Actual Comparison: Color-coded arrows (▲▼) highlight performance gaps.
📅 Month Selector (Cell D3): Choose any month to auto-refresh visuals.
📘 KPI Trend Charts: Analyze MTD, YTD, and Previous Year performance with clear line and column visuals.
🔢 KPI Library: Includes KPI Name, Group, Unit, Formula, and Definition for standardized reporting.
💡 Customizable Layout: Add new KPIs or modify visuals to suit your farm’s structure.
🧭 Dashboard Structure Overview
🏠 1️⃣ Home Sheet – Quick Navigation
The Home sheet works as the main index with six buttons linking directly to all major pages, ensuring seamless navigation.
📊 2️⃣ Dashboard Sheet – The Core Visualization Page
This is where performance meets clarity.
-
Select Month: Choose from a dropdown in cell D3.
-
See MTD & YTD Metrics: Instantly compare Actual vs Target and Previous Year.
-
Color-Coded Arrows: Green ▲ for achievement; Red ▼ for attention.
-
Auto-Refresh Charts: Data updates automatically as new entries are added.
🎯 Purpose: Get a snapshot of your entire poultry operation — production, costs, and profitability — in one glance.
📈 3️⃣ KPI Trend Sheet – Visualize Performance Over Time
Select a KPI from the dropdown (cell C3) and view detailed performance trends for:
-
MTD Actual vs Target vs PY
-
YTD Actual vs Target vs PY
📊 Purpose: Identify improvement patterns and seasonal variations, such as changes in feed efficiency or egg output.
🧮 4️⃣ Actual Numbers Input Sheet – Data Entry Simplified
Enter real data for each month and KPI.
-
Cell E1 sets the first month of the fiscal year.
-
Auto-calculated comparisons flow into all charts and tables.
🎯 5️⃣ Target Sheet – Define Monthly & Yearly Goals
Set measurable targets for every KPI (MTD & YTD) to track success systematically.
📘 6️⃣ Previous Year Sheet – Benchmark Historical Data
Store last year’s performance figures for meaningful year-over-year comparisons.
📚 7️⃣ KPI Definition Sheet – Your Metric Dictionary
Keep formulas, definitions, and units standardized to ensure team-wide consistency.
🐣 Essential KPIs for Poultry Farming
Production Metrics:
-
Egg Production Rate (%)
-
Feed Conversion Ratio (FCR)
-
Mortality Rate (%)
-
Average Daily Gain (g/day)
Financial Metrics:
-
Cost per Bird (₹/$)
-
Revenue per Batch (₹/$)
-
Gross Profit Margin (%)
Operational Metrics:
-
Feed & Water Consumption per Bird
-
Electricity Cost per Batch
-
Manpower Efficiency (%)
Customer Metrics:
-
Customer Complaint Rate (%)
-
On-Time Delivery (%)
-
Order Fulfillment Accuracy (%)
🌟 Advantages of Using the Poultry Farming KPI Dashboard in Excel
✅ Centralized Control: Monitor production, costs, and profitability in one file.
✅ Real-Time Insights: Charts and KPIs update instantly with new data.
✅ Better Decisions: Compare Actual vs Target vs PY values for accurate planning.
✅ Easy Customization: Add KPIs or modify visuals for specific farm types.
✅ No Special Software Needed: 100% Excel-based, beginner-friendly design.
✅ Improved Accountability: Transparent reporting for staff and management.
✅ Historical Comparison: Track long-term improvement across flocks.
🧠 Best Practices for Using the Dashboard
📌 Update actuals and targets monthly.
📌 Keep data clean — no blanks or duplicates.
📌 Set realistic goals based on past results.
📌 Focus on 15–20 meaningful KPIs.
📌 Compare results monthly and quarterly.
📌 Use the dashboard in team reviews for alignment.
📌 Backup data regularly to avoid loss.
🐓 Example Analysis
If your Feed Conversion Ratio (FCR) target is 1.8 but the actual is 2.1, the dashboard shows a red ▼ indicator.
The variance column highlights the deviation, and the KPI Trend chart shows the rising FCR pattern — prompting immediate corrective action such as feed adjustment or environment optimization.
💡 How It Transforms Poultry Management
The Poultry Farming KPI Dashboard helps you:
-
Detect feed inefficiencies early.
-
Reduce mortality and production losses.
-
Improve profitability per batch.
-
Present accurate data to investors or lenders.
It’s more than a spreadsheet — it’s a decision-support system for modern poultry farms.


Reviews
There are no reviews yet.