



Event Production KPI Dashboard in Excel Managing events efficiently requires more than just coordination — it demands data-driven performance tracking. From budget control to audience satisfaction, Event Production KPI Dashboard in Excel every aspect of event management must be measured precisely to ensure success.
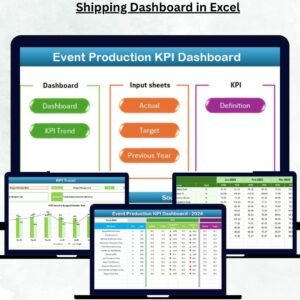
The Event Production KPI Dashboard in Excel is a professional, ready-to-use analytical tool designed to help event planners, production teams, and managers track performance across multiple dimensions — all in one place. Built entirely in Microsoft Excel, it converts raw event data into meaningful insights through charts, KPIs, and automatic calculations.
Whether you organize corporate conferences, entertainment shows, exhibitions, or marketing events, this dashboard provides complete visibility into your event operations — helping you make smarter, faster decisions.
⚙️ Key Features of the Event Production KPI Dashboard in Excel
📊 Seven Interactive Sheets – Home, Dashboard, KPI Trend, Actual, Target, Previous Year, and KPI Definition.
📅 Dynamic Month Selection – Choose any month from a dropdown (cell D3) to update visuals instantly.
🎯 MTD & YTD Comparison – Track Month-to-Date and Year-to-Date performance vs. targets and previous year.
📈 KPI Cards & Arrows – Instantly visualize progress with green (▲) and red (▼) icons.
📘 KPI Trend Charts – View Actual, Target, and Previous Year data to analyze trends.
💾 Data Input Sheets – Update Actual, Target, and Historical data easily — no coding required.
📖 KPI Definition Sheet – Standardize metric definitions for teamwide clarity.
💡 Automatic Calculations – Built-in formulas minimize manual effort and errors.
📤 Export-Ready Layout – Create printable or presentation-ready reports instantly.
🧭 User-Friendly Navigation – Home sheet with clickable buttons ensures seamless movement.
📂 What’s Inside the Event Production KPI Dashboard
🏠 1️⃣ Home Sheet – Easy Navigation Hub

A professional control center with buttons that link directly to other sheets.
✅ Simplifies movement across sections.
✅ Perfect for non-technical users.
✅ Enhances the workbook’s presentation and usability.
📊 2️⃣ Dashboard Sheet – Real-Time Performance View
The main analysis area of the workbook.
Month selector (cell D3) to update data dynamically.
MTD & YTD comparisons for Actual, Target, and Previous Year.
Conditional arrows (green/red) to highlight achievement status.
Automatic calculation of performance percentages like:
Target vs. Actual (MTD/YTD)
PY vs. CY (MTD/YTD)
💡 Example: If event attendance hits 9,800 vs. a target of 10,000, it shows 98% with a red ▼ arrow — instantly showing a shortfall.
📈 3️⃣ KPI Trend Sheet – Deep Performance Tracking
Select any KPI (cell C3) to explore its trend over time.
Displays KPI Group, Unit, Formula, and Type (UTB/LTB).
Includes two combo charts:
MTD Trend Chart
YTD Trend Chart
Ideal for spotting recurring performance patterns and identifying improvement opportunities.
📋 4️⃣ Actual Numbers Input Sheet
Input MTD and YTD values for every KPI and month.
The dashboard automatically syncs this data to charts and tables.
Maintaining consistency here ensures accuracy everywhere.
🎯 5️⃣ Target Sheet
Enter MTD and YTD target values for all KPIs.
Comparisons are auto-generated on the Dashboard and Trend sheets.
✅ Helps management set realistic event goals.
✅ Enables accurate tracking of performance gaps.
🗓️ 6️⃣ Previous Year Numbers Sheet
Record last year’s event data for all KPIs.
This sheet powers year-over-year comparisons, showing improvement or decline.
Perfect for long-term performance benchmarking.
📘 7️⃣ KPI Definition Sheet
A centralized reference library containing:
KPI Name
KPI Group
Unit
Formula
KPI Definition
Type (UTB/LTB)
Ensures consistent understanding of metrics across departments and projects.
🌟 Advantages of Using the Event Production KPI Dashboard
✅ All-in-One Event Analysis – Centralizes all metrics in one Excel file.
✅ Time Savings – Automated formulas reduce manual calculations.
✅ Accurate Insights – Data validation and formatting minimize errors.
✅ Visual Storytelling – Conditional formatting makes data intuitive.
✅ Professional Reporting – Impress clients or management with clean visuals.
✅ Customizable Design – Add new KPIs or sheets easily.
✅ Real-Time Comparisons – Monitor ongoing performance effortlessly.
📊 Examples of KPIs Tracked
🎫 Event Budget Utilization (%)
👥 Event Attendance Rate (%)
💰 Sponsorship Revenue (USD)
🚚 Logistics Timeliness (%)
🏗️ Vendor Compliance (%)
⭐ Customer Satisfaction Score
📣 Marketing ROI (%)
🔁 Lead Conversion Rate (%)
💵 Operational Cost per Event (USD)
⏱️ Average Setup Time (Hours)
These metrics provide a 360° performance view — covering financial, operational, and audience engagement indicators.
🧠 Best Practices for Accurate Reporting
📌 Use the first day of each month as the date value.
📌 Refresh formulas after data entry for updated visuals.
📌 Keep KPI names consistent across all sheets.
📌 Archive old files for year-on-year analysis.
📌 Protect formulas to avoid accidental edits.
📌 Review data trends regularly for continuous improvement.
👥 Who Can Benefit
🎪 Event Planners & Managers – Monitor operations & profitability.
🏢 Corporate Event Teams – Track logistics & ROI.
💼 Agencies & Production Houses – Deliver transparent client reports.
📈 Marketing Teams – Measure engagement & conversion from events.
📊 Consultants & Analysts – Benchmark multiple event portfolios.






























Reviews
There are no reviews yet.