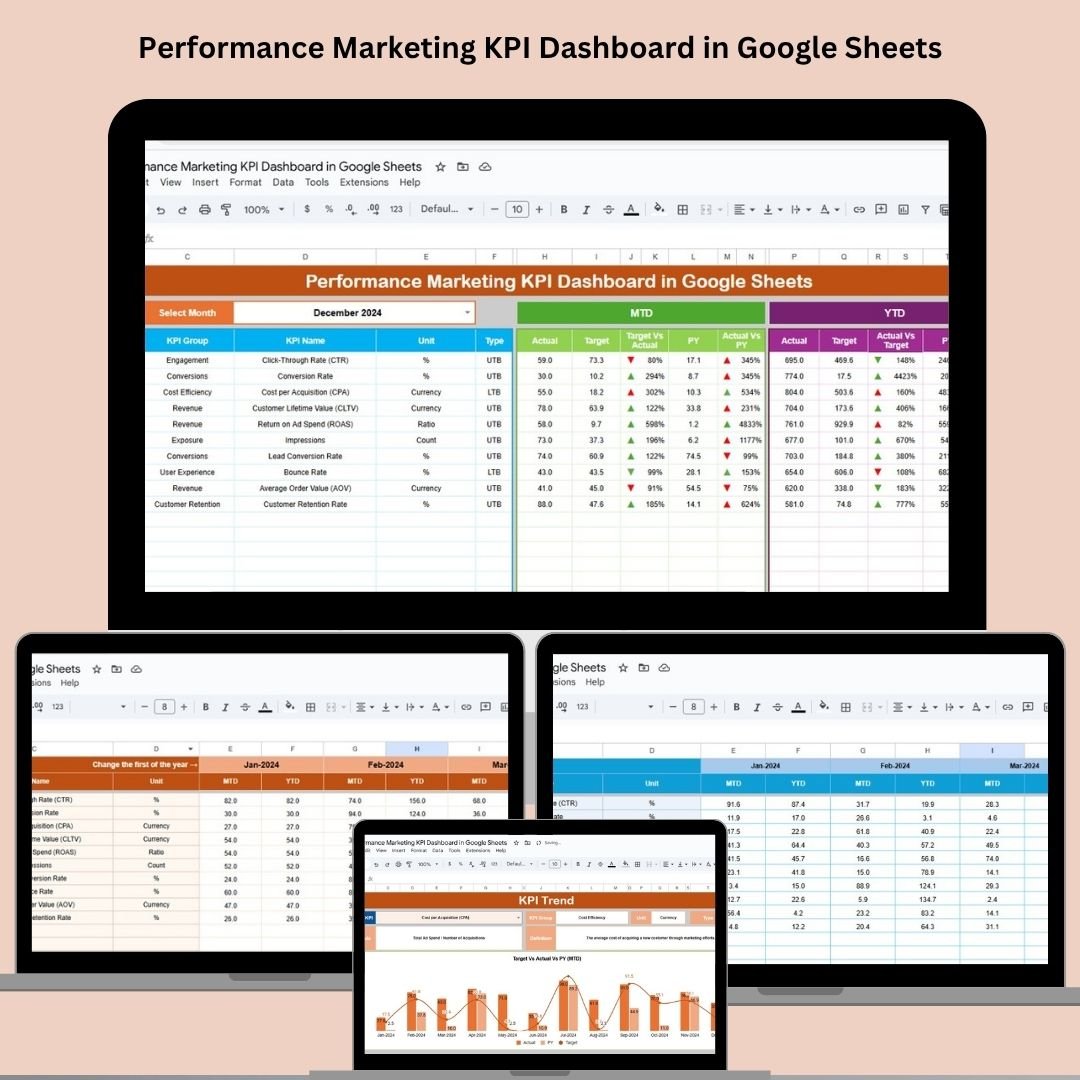
Get laser-focused on results with the Performance Marketing KPI Dashboard in Google Sheets—a ready-to-use, data-driven tool to track what truly matters in your campaigns. Whether you’re running ads, optimizing landing pages, or managing paid funnels, this dashboard is your marketing command center!
⚙️ Key Features of the Performance Marketing KPI Dashboard
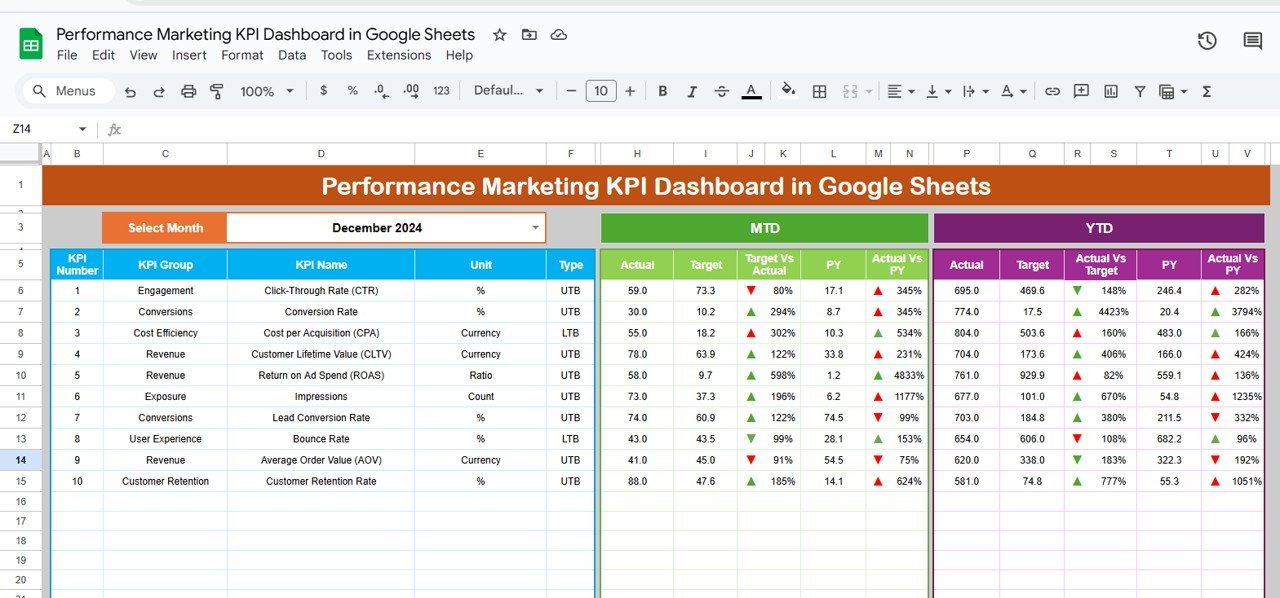
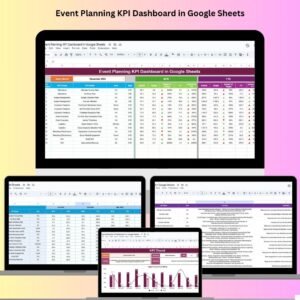
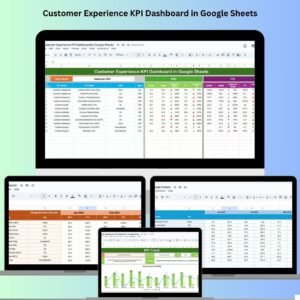
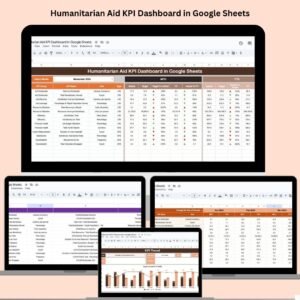
📊 Centralized Dashboard Sheet
Get an instant snapshot of your performance. View MTD (Month-to-Date) and YTD (Year-to-Date) Actuals, Targets, and Previous Year data—all updated in real-time based on your inputs.
📆 Month Selector Dropdown
Quickly switch between months using the smart dropdown. One click updates all KPI visuals instantly.
🔴🟢 Conditional Formatting
Up and down arrows highlight performance against targets. Green = On Track. Red = Needs Attention.
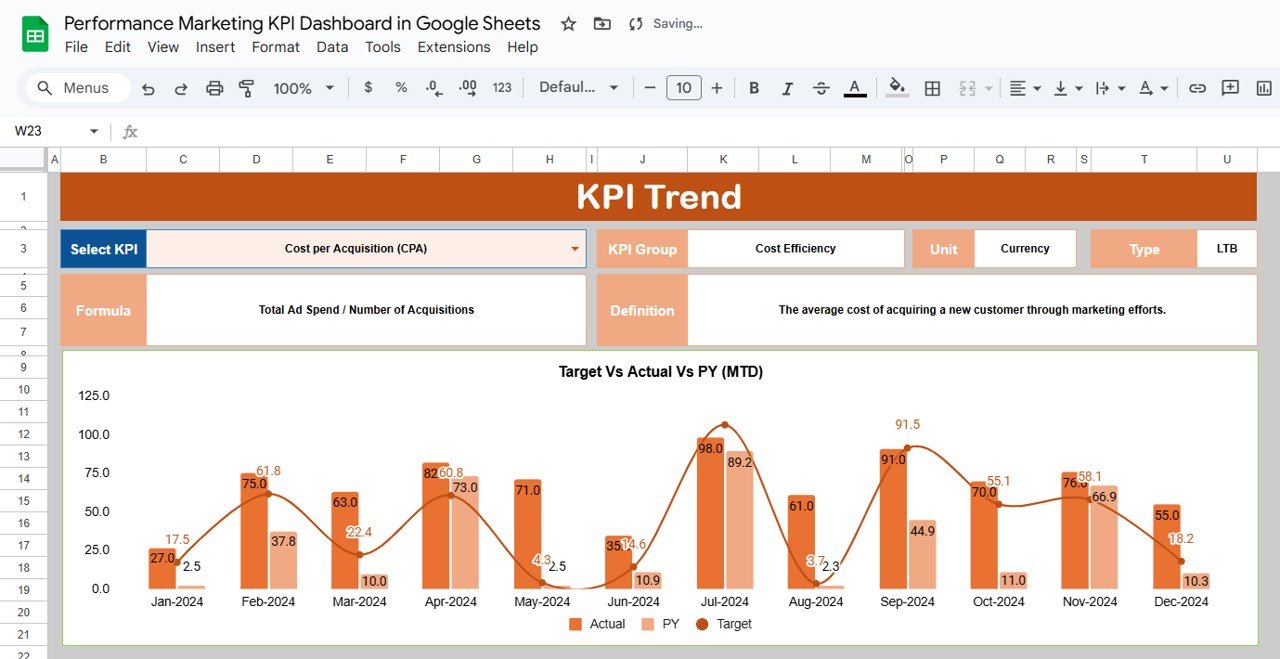
📈 Trend Analysis with KPI Selector
The KPI Trend Sheet lets you choose any KPI and see historical trends, helping you spot what’s working and what’s not over time.
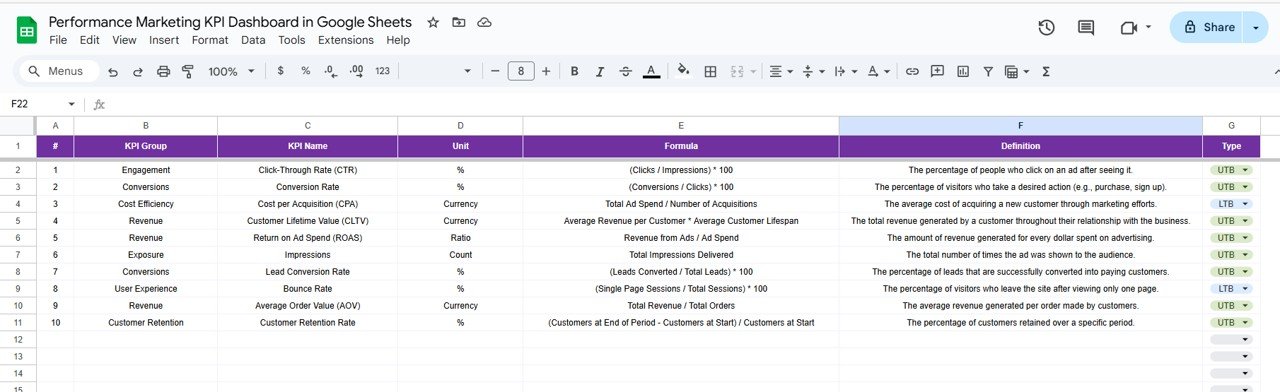
📌 Definition Sheet
Each KPI is clearly defined with formula, unit, group, and its tracking type (UTB or LTB), giving you full transparency.
🧮 Dynamic Calculations
Whether it’s ROAS, CAC, or CTR, your metrics are calculated automatically and displayed clearly.
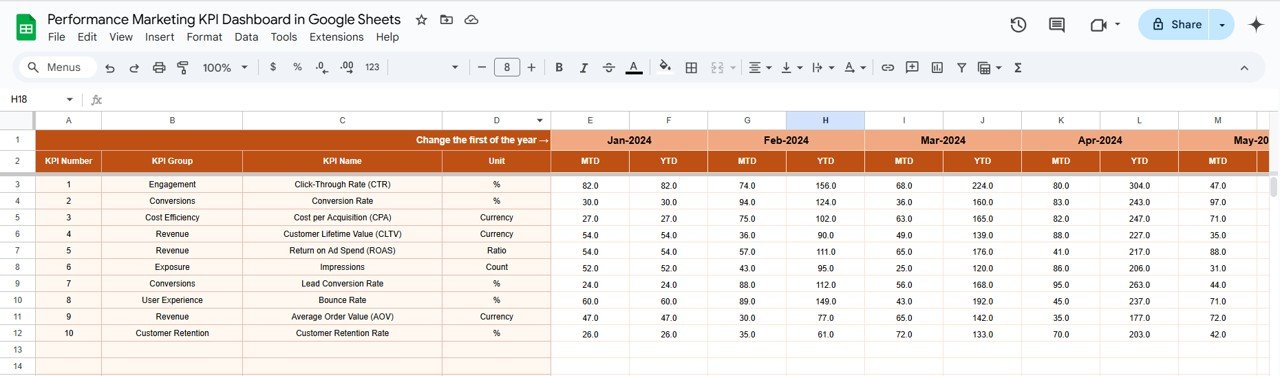
📁 Clean Input Sheets
Use the Actuals, Targets, and Previous Year sheets to plug in data—your dashboard reflects updates instantly, no formulas needed from your side.
📦 What’s Inside the Performance Marketing KPI Dashboard
Here’s what you’ll find in this plug-and-play template:
✅ Dashboard Tab – All KPIs in one interactive view
✅ KPI Trend Tab – Visualize performance over time
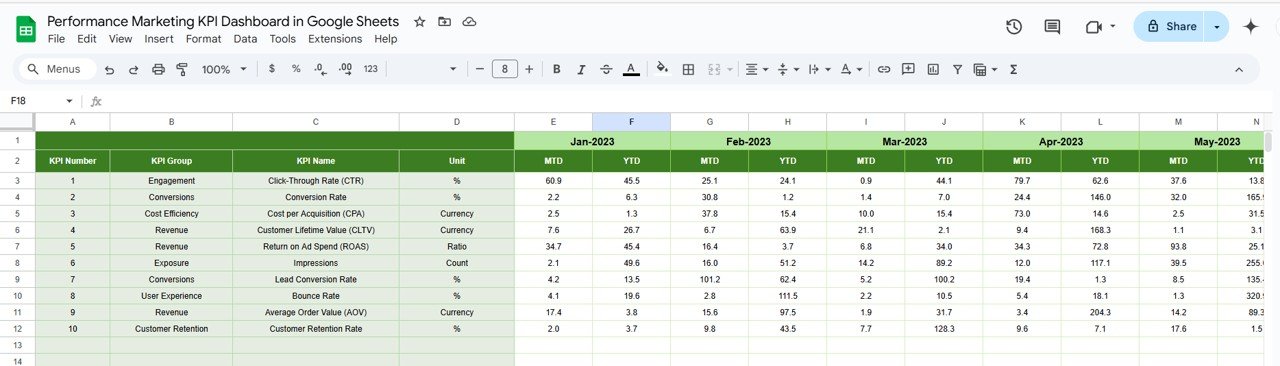
✅ Actual Number Sheet – Input MTD/YTD actuals
✅ Target Sheet – Set your campaign goals
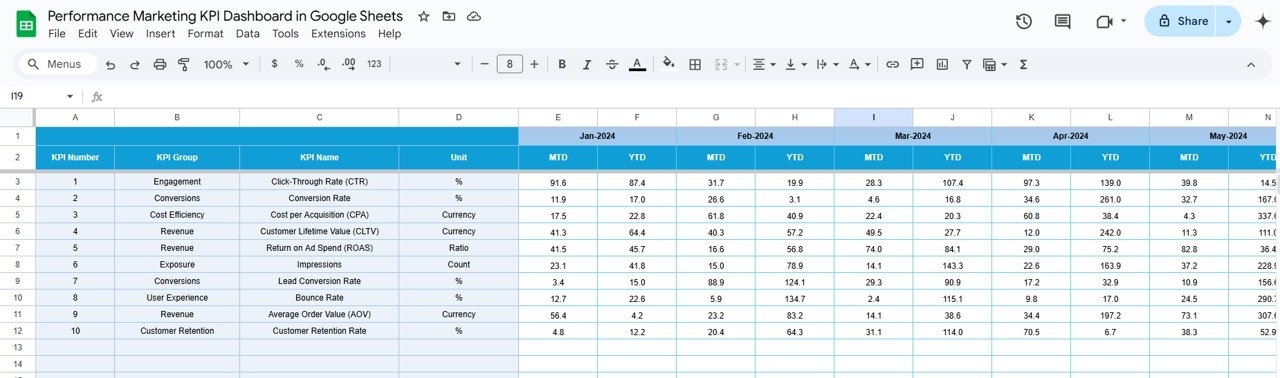
✅ Previous Year Sheet – Historical data comparison
✅ KPI Definition Sheet – Metric explanations and formulas
Each tab is built to auto-sync with the main dashboard, ensuring seamless updates and meaningful insights.
🧑💻 How to Use the Performance Marketing KPI Dashboard
📝 Step 1: Enter your current month and YTD performance in the Actuals Sheet
🎯 Step 2: Set realistic monthly and annual goals in the Target Sheet
📆 Step 3: Log last year’s numbers in the Previous Year Sheet
🔄 Step 4: Select the reporting month on the Dashboard
📊 Step 5: Track changes with automatic charts, KPIs, and indicators
📤 Step 6: Share your dashboard with team members or export to PDF
It’s as simple as fill, filter, and focus.
🚀 Who Can Benefit from This Performance Dashboard?
👩💼 Digital Marketing Managers – Align campaigns with KPIs in real-time
📈 Media Buyers & PPC Experts – Track ROI, CTR, CAC, and more
📊 Marketing Analysts – Get deep-dive trends to advise stakeholders
📢 Agencies – Use it as a client-ready reporting tool
📱 Startups & Entrepreneurs – Make informed growth decisions with no-code tracking
🌐 Freelancers – Showcase results professionally without investing in BI tools
✅ Why Choose This Google Sheets Dashboard?
✔ Built in Google Sheets – access it from anywhere, anytime
✔ No software or plugin needed – just your browser
✔ Easy to customize – add your brand colors or extra KPIs
✔ Real-time metrics and auto-updates
✔ Shareable, secure, and cloud-backed
🔁 Click here to read the Detailed blog post
Watch the step-by-step video Demo:


Reviews
There are no reviews yet.