
In today’s data-driven education ecosystem, simply delivering online content isn’t enough — you need to track, measure, and optimize learning outcomes. The Online Education KPI Dashboard in Google Sheets is your ultimate tool to monitor student engagement, satisfaction, course completion, and much more — all in real-time, with zero coding required.
This ready-to-use Google Sheets dashboard empowers educators, institutions, and e-learning professionals to gain insights instantly, set realistic targets, and enhance course performance through data-backed decisions.
✨ Key Features of the Online Education KPI Dashboard
-
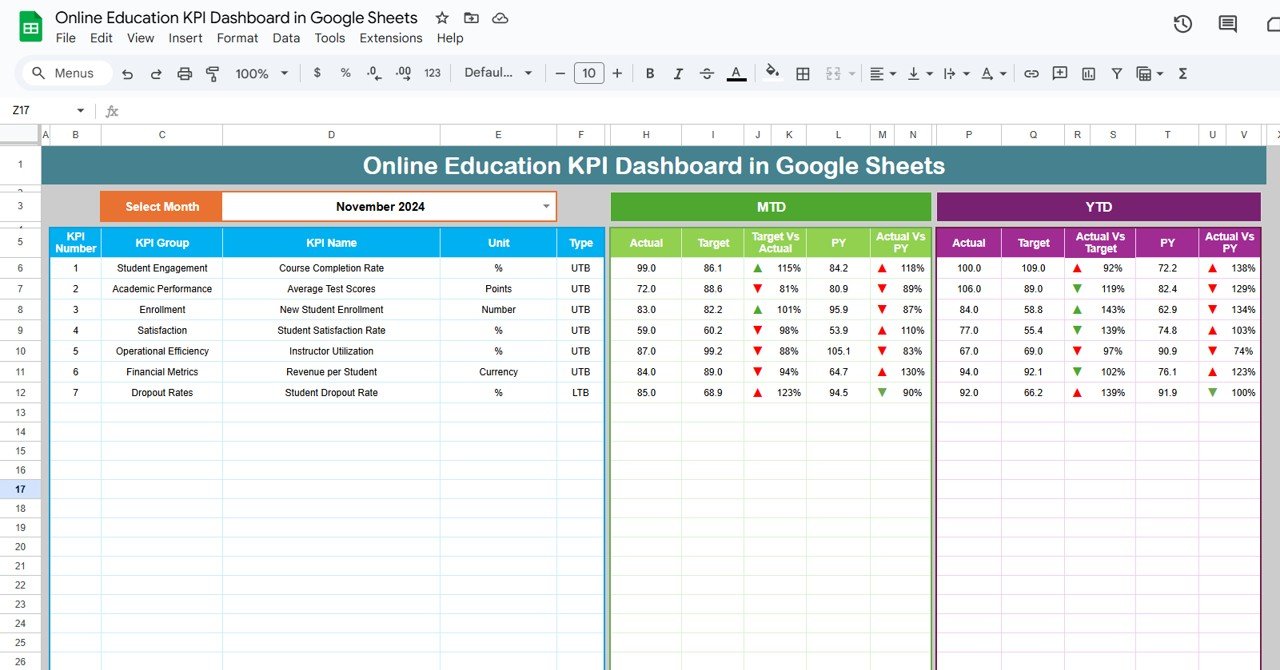
📊 Real-Time MTD & YTD Tracking
Automatically updates month-to-date and year-to-date performance with visual up/down arrows. -
📅 Month Selector Dropdown
Select any month, and the dashboard dynamically adjusts all KPIs and charts. -
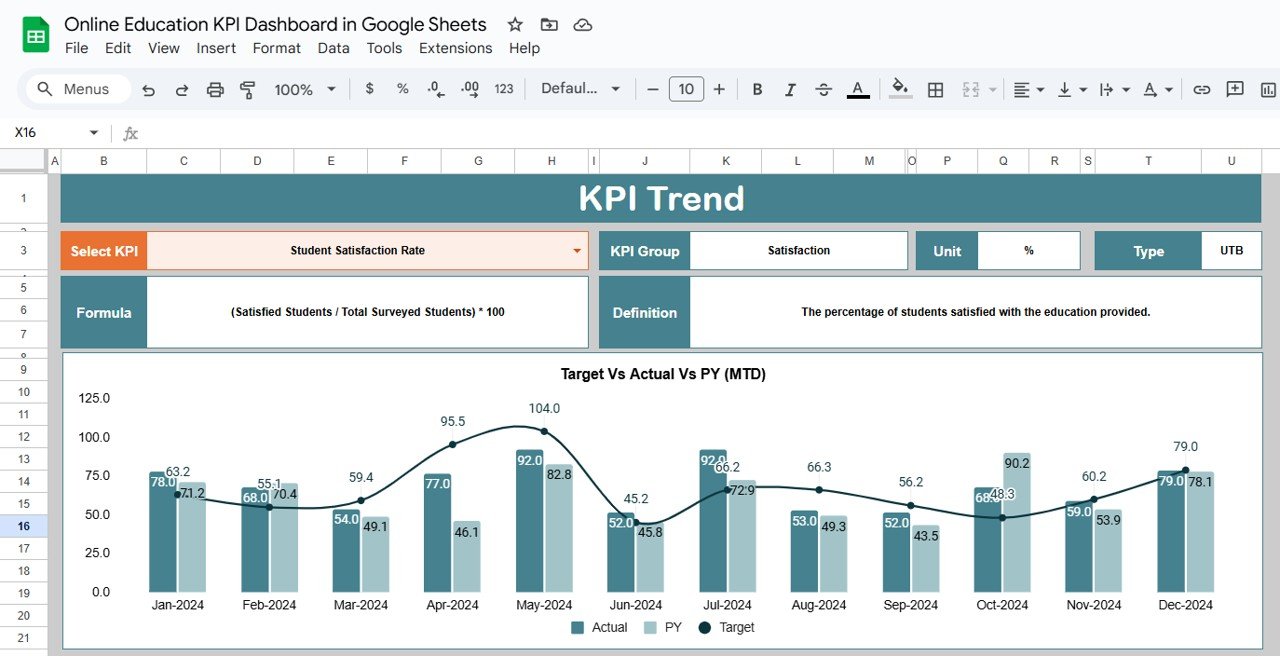
📈 KPI Trend Sheet
Monitor long-term trends and analyze KPI shifts over time — perfect for data-backed strategy updates. -
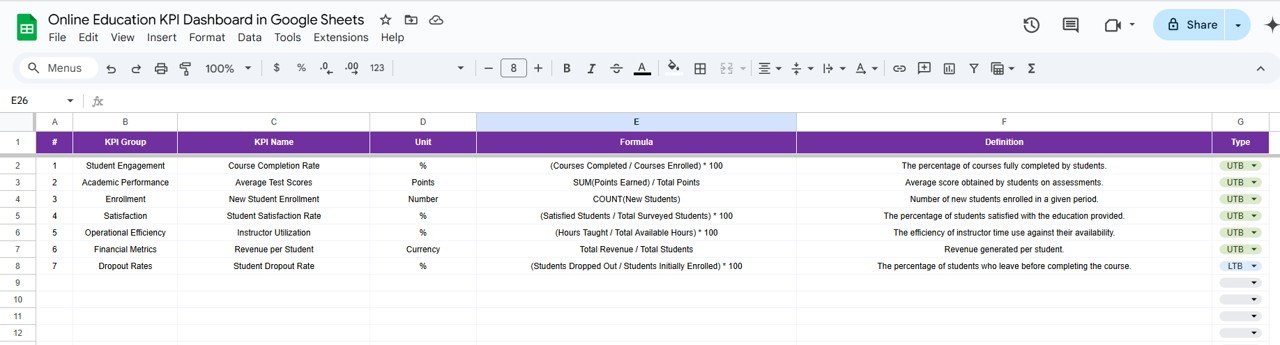
📘 KPI Definition Sheet
Clearly understand what each KPI tracks, its group, formula, unit, and whether it’s “Upper the Better” or “Lower the Better.” -
📤 Customizable for Institutions
Adapt KPIs, formulas, and targets to match your specific course or institutional needs.
📂 What’s Included in the Dashboard
-
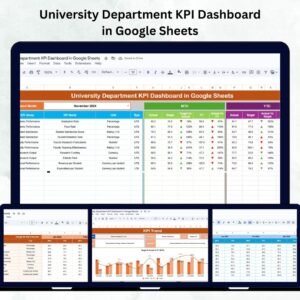
Dashboard Sheet Tab
Visual performance overview for selected month with MTD, YTD, target comparisons, and conditional formatting. -
KPI Trend Sheet Tab
Select any KPI and instantly visualize its historical trend and performance pattern. -
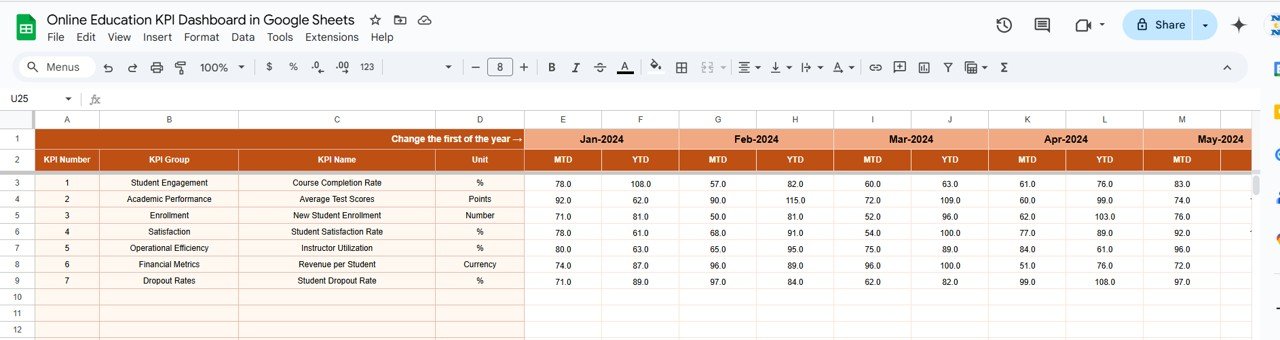
Actual Number Sheet Tab
Input real-time MTD/YTD performance data for each KPI — instantly updates dashboard metrics. -
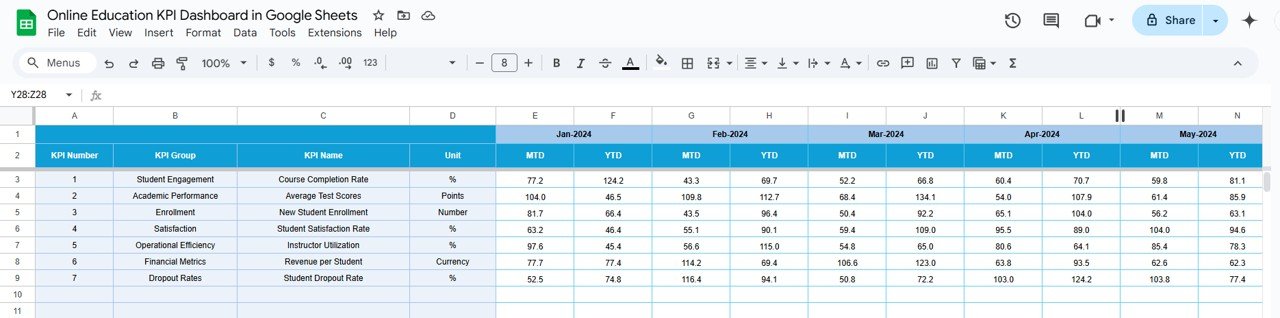
Target Sheet Tab
Define your monthly and yearly performance goals for smarter comparisons. -
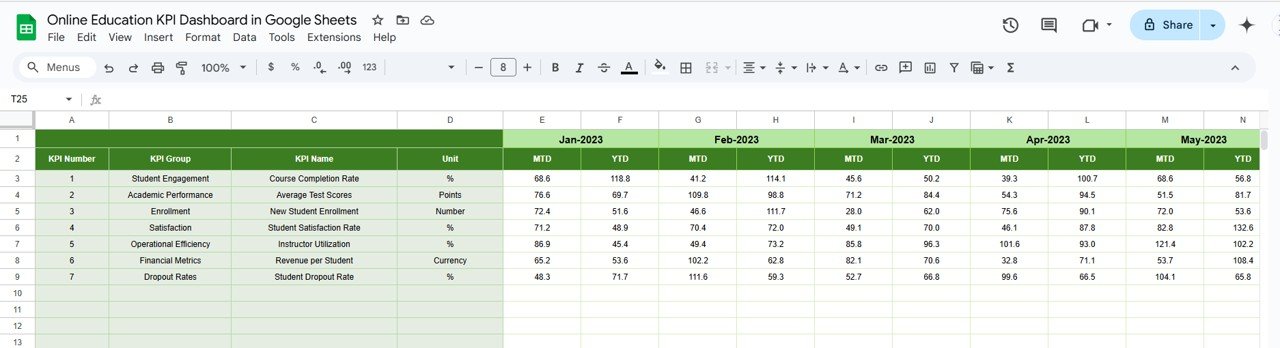
Previous Year Data Sheet
Compare current performance to the previous year to track long-term growth or challenges. -
KPI Definition Sheet Tab
Get detailed definitions, formulas, and insights into each KPI being measured.
🎯 Top KPIs Tracked in This Dashboard
-
📚 Student Engagement Rate
-
🧠 Course Completion Rate
-
💬 Student Satisfaction Score
-
⏰ Average Time Spent per Session
-
✅ Assignment Submission Rate
-
📅 Dropout Rate (LTB)
👥 Who Should Use This Dashboard?
-
🎓 Educators & Online Instructors – Evaluate how well students engage and perform
-
🏫 EdTech Institutions – Monitor performance across multiple online courses
-
📊 Program Managers – Report real-time KPIs to stakeholders and leadership
-
🔍 Curriculum Planners – Identify what’s working and what needs refinement
🚀 Why Choose Google Sheets?
-
🌐 Cloud-Based – Access from anywhere and collaborate in real-time
-
🛠️ No Code Needed – 100% formula-driven, no tech knowledge required
-
🔄 Auto Updates – Change one input and the entire dashboard updates
-
🎨 Easy Customization – Modify KPIs or add new ones as your program grows
🧠 Best Practices for Educators
✅ Update regularly to maintain performance visibility
✅ Use KPI Trend Sheet for strategy optimization
✅ Track engagement to understand student needs
✅ Set SMART goals with Target Sheet comparison
✅ Visualize for impact using conditional arrows and charts
📚 Want to Learn More?
🔗 Read the full blog post
Watch the step-by-step video Demo:
📺 Watch the video tutorial on our YouTube Channel
👉 youtube.com/@NeotechNavigators


Reviews
There are no reviews yet.