

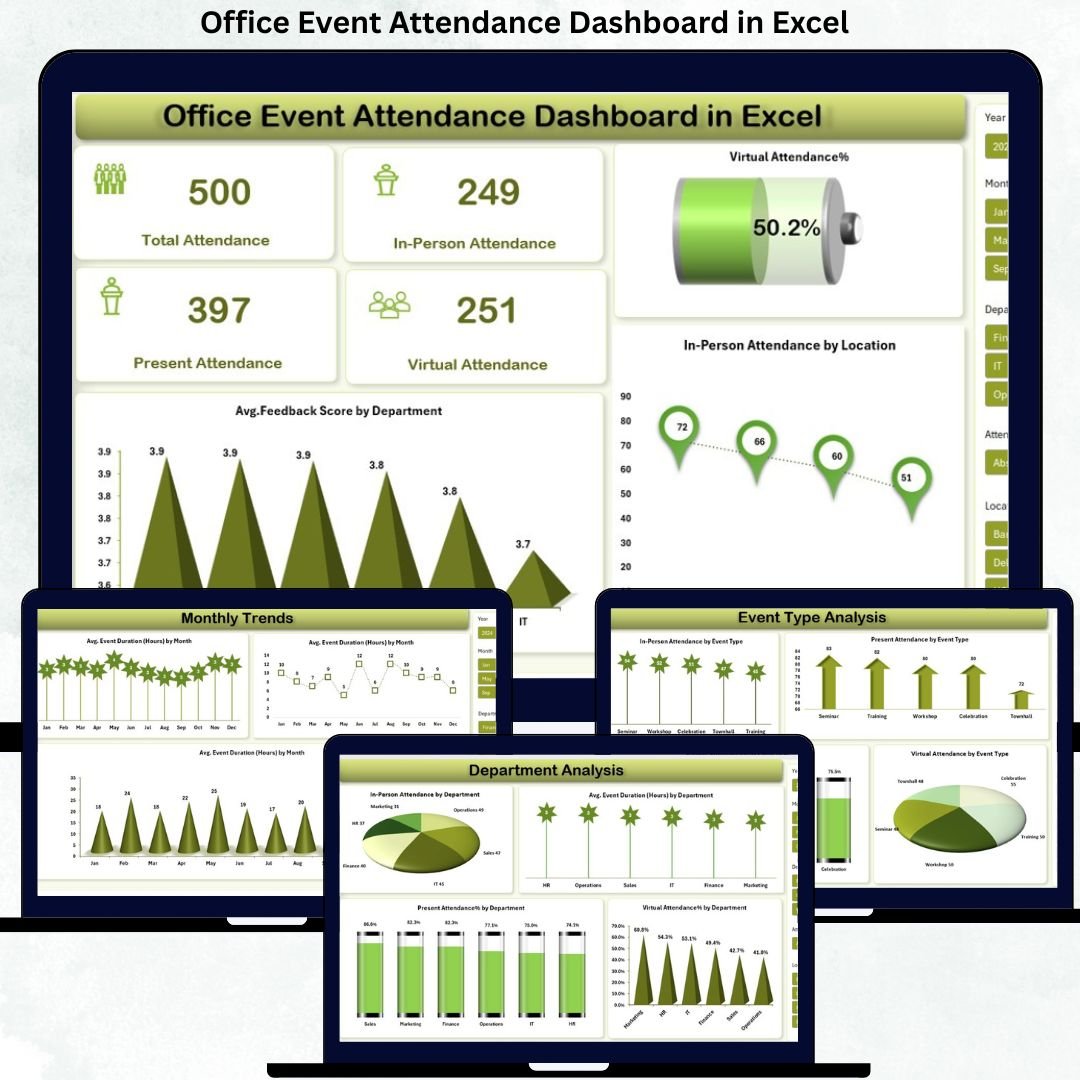



Managing office events today goes far beyond sending calendar invites or marking attendance in sheets. Organizations now need clear visibility into who attends, how they attend, how engaged they are, and what feedback they share. That is exactly where the Office Event Attendance Dashboard in Excel becomes a powerful, practical, and business-ready solution.
The Office Event Attendance Dashboard in Excel is a ready-to-use analytical Excel file designed to track, monitor, and analyze employee attendance across all types of office events from a single centralized dashboard. Instead of juggling emails, manual trackers, or scattered spreadsheets, this dashboard converts raw attendance data into clear visual insights that decision-makers can understand instantly.
Built entirely in Microsoft Excel, this dashboard is cost-effective, flexible, and easy to customize, making it ideal for organizations of any size. Whether events are conducted in person, virtually, or in hybrid mode, this dashboard provides full visibility into participation patterns, engagement levels, and attendance trends.
## 🔑 Key Features of Office Event Attendance Dashboard in Excel
📊 Centralized Attendance Tracking
Track all office event attendance data in one structured Excel dashboard.
🏢 In-Person vs Virtual Participation Analysis
Instantly compare physical attendance and virtual participation across events.
📈 Department-Wise & Location-Wise Insights
Identify which departments and office locations show higher engagement.
📅 Event Type Performance Tracking
Analyze attendance trends across trainings, town halls, workshops, and meetings.
⭐ Engagement & Feedback Analysis
Measure participation quality using engagement levels and feedback scores.
📆 Monthly Trend Analysis
Track how attendance and event duration change over time.
🧩 Fully Customizable Excel Layout
Modify KPIs, charts, and metrics without technical complexity.
## 📦 What’s Inside the Office Event Attendance Dashboard in Excel
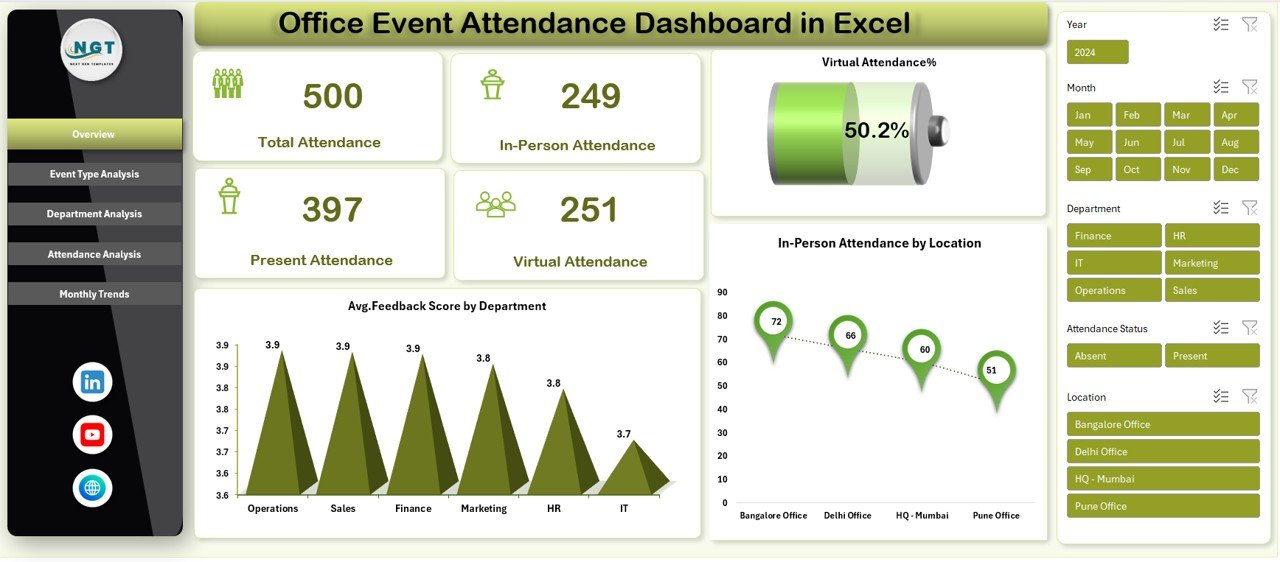
📄 Overview Sheet
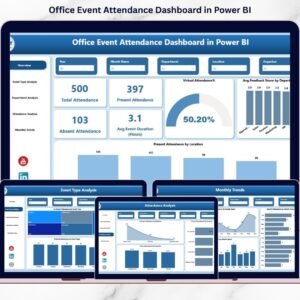
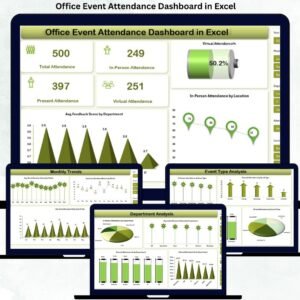
Displays total attendance, in-person attendance, virtual attendance %, feedback scores, and location-wise insights.
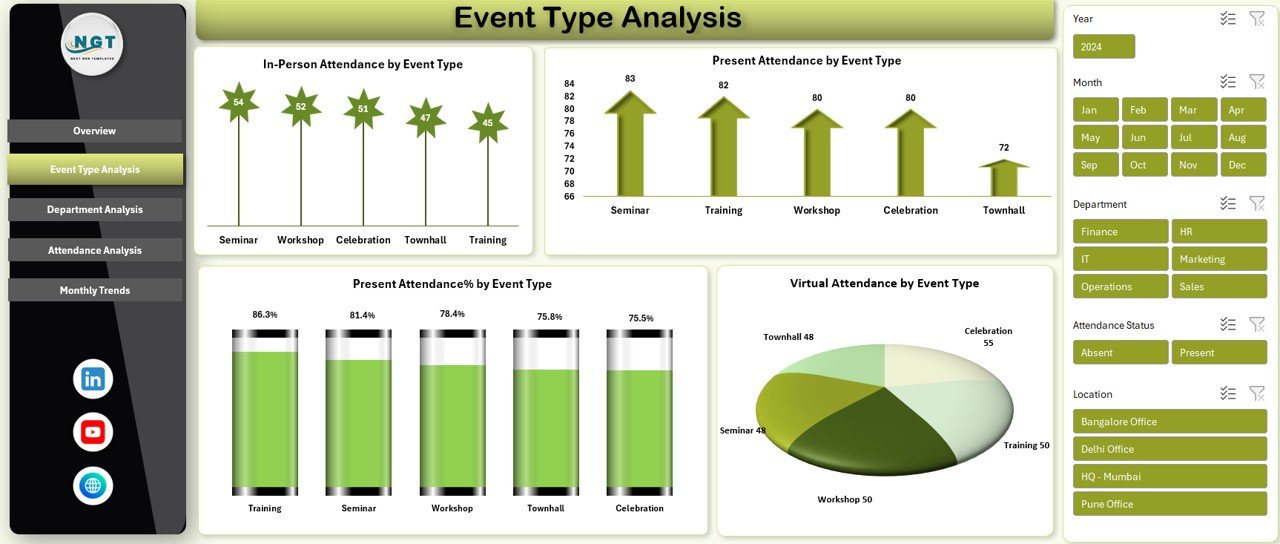
📊 Event Type Analysis Sheet
Shows attendance performance by event categories to identify high-impact events.
🏢 Department Analysis Sheet
Highlights department-wise participation, engagement %, and average event duration.
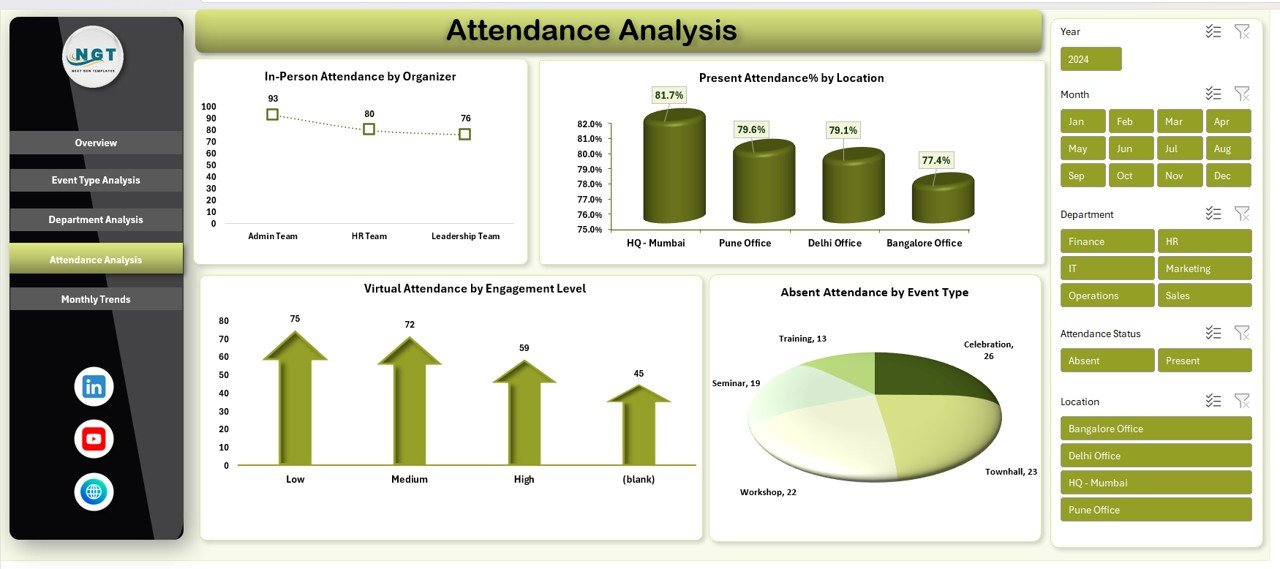
🔍 Attendance Analysis Sheet
Provides deeper insights such as organizer performance, absentee patterns, and engagement levels.
📆 Monthly Trends Sheet
Tracks participation behavior and event duration across months.
🗂️ Structured Data Model
Includes event date, event type, organizer, department, attendance mode, presence status, engagement level, and feedback score.
## ▶️ How to Use the Office Event Attendance Dashboard in Excel
1️⃣ Enter or import event attendance data into the structured data sheet
2️⃣ Refresh pivot tables and charts with one click
3️⃣ Use slicers to filter data by department, event type, location, or month
4️⃣ Analyze in-person vs virtual attendance patterns
5️⃣ Review engagement levels and feedback trends
6️⃣ Use insights to improve future event planning and participation
No advanced Excel knowledge is required—basic Excel familiarity is enough to get started.
## 👥 Who Can Benefit from This Office Event Attendance Dashboard in Excel
👩💼 HR Teams – Track employee engagement and participation trends
🏢 Admin & Office Teams – Manage attendance data efficiently
📅 Corporate Event Planners – Improve event formats using real insights
📊 Managers & Department Heads – Monitor team involvement in events
📈 Business Analysts – Analyze engagement patterns with structured data
🏭 Small to Large Organizations – Suitable for any company size
Click here to read the Detailed blog post
Watch the step-by-step video tutorial:
Visit our YouTube channel to learn step-by-step video tutorials
https://www.youtube.com/@PKAnExcelExpert
Compatibility and Requirements
- Works in Microsoft Excel desktop (Excel 2016 or later, or Microsoft 365).
- The dashboard uses pivot tables and slicers. Microsoft explains slicers in Use slicers to filter data.
Frequently Asked Questions
Which sheets are included?
Overview, Event Type Analysis, Department Analysis, Attendance Analysis and Monthly Trends, plus a data sheet that feeds them.
What data do I enter?
Event date, event type, organizer, department, attendance mode, presence status, engagement level and feedback score.
Can I compare in-person and virtual attendance?
Yes. The Overview sheet shows in-person attendance and virtual attendance percentage side by side.
How do I filter the dashboard?
Use the slicers to filter by department, event type, location or month, then refresh the pivot tables and charts after adding new data.
Do I need advanced Excel skills?
No. Basic Excel familiarity is enough to enter data and use the slicers.
Related Office Event and Attendance Templates
- Office Event Attendance Dashboard in Power BI: the same analysis in Power BI
- Office Event Attendance Dashboard in Google Sheets: a browser-based version for shared editing
- Employee Attendance Dashboard in Google Sheets: daily attendance rather than events
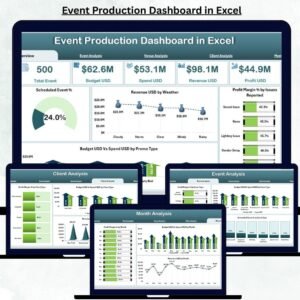
- Event Production Dashboard in Excel: track the cost and delivery side of events
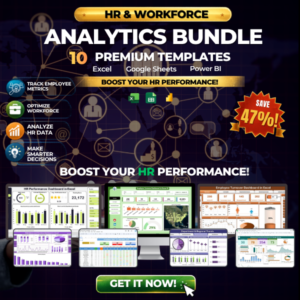
- HR & Workforce Analytics Bundle: 10 HR templates for Excel, Google Sheets and Power BI
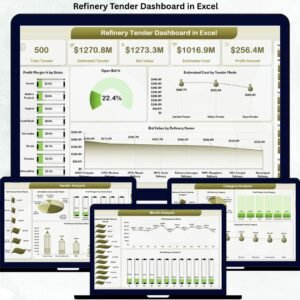
Browse all Excel dashboards or the Excel HR and payroll templates.


Reviews
There are no reviews yet.