


The Manufacturing Efficiency Dashboard in Power BI is a dynamic tool designed to help manufacturers track and analyze key performance indicators (KPIs) that directly impact production efficiency, operational costs, and overall factory performance. This customizable dashboard leverages Power BI’s advanced data visualization capabilities to provide actionable insights into manufacturing processes, helping stakeholders make informed decisions.
Whether you’re monitoring production line efficiency, tracking machine downtime, or analyzing throughput, this dashboard offers a clear, real-time overview of key metrics, allowing you to optimize manufacturing operations and improve productivity.

Key Features of the Manufacturing Efficiency Dashboard in Power BI
📊 Real-Time Data Monitoring: Track key manufacturing KPIs such as production rates, downtime, throughput, and operational costs in real time.
⚙️ Customizable KPIs: Tailor the dashboard to track the most relevant metrics specific to your manufacturing processes.
📈 Performance Analysis: Analyze operational performance to identify bottlenecks, inefficiencies, and areas for improvement.
📅 Time-Based Insights: Track performance over different time periods (daily, weekly, monthly) to evaluate long-term trends and patterns.
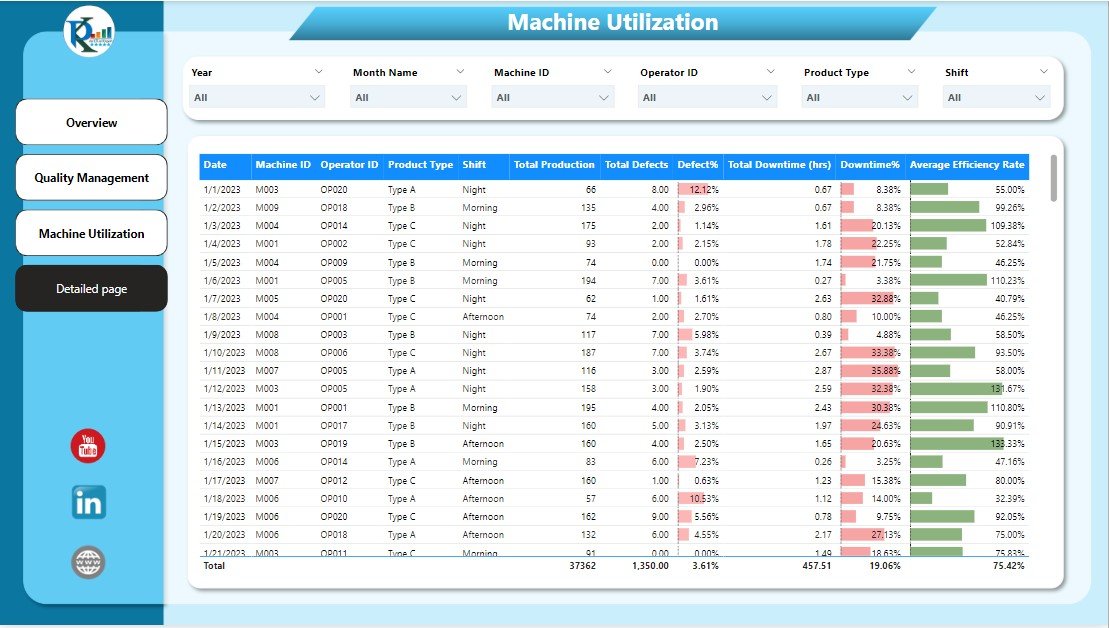
📉 Machine Utilization Tracking: Monitor machine uptime, downtime, and performance to optimize resource utilization.
🔄 Interactive Dashboard: Click through data visuals to explore trends, drill down into specific KPIs, and uncover insights.
🧑💼 User-Friendly Interface: Simple, easy-to-navigate design ensuring that your team can make use of the data without technical expertise.
Why You’ll Love the Manufacturing Efficiency Dashboard in Power BI
✅ Streamlines Operations Monitoring: Easily track multiple performance metrics from production rates to machine efficiency.
✅ Data-Driven Decision Making: Leverage real-time data to make informed decisions and optimize production processes.
✅ Improves Efficiency: Identify inefficiencies and bottlenecks quickly to reduce downtime and improve throughput.
✅ Customizable to Your Needs: Adapt the dashboard to suit your specific manufacturing processes, whether you’re in automotive, food processing, or electronics.
✅ Real-Time Updates: Keep your finger on the pulse of your operations with constantly updated performance data.
What’s Inside the Manufacturing Efficiency Dashboard in Power BI?
📊 Production Efficiency Metrics: Track production rates, output quality, and throughput for a comprehensive view of efficiency.
📈 Operational Performance Analysis: Analyze downtime, machine utilization, and resource allocation for better decision-making.
⚙️ Machine Performance Monitoring: Track machine efficiency, uptime, and maintenance schedules to improve equipment management.
📅 Time-Based Reporting: Monitor performance across different time periods to identify long-term trends.
🔄 Interactive Features: Drill down into data points for deeper insights and better understanding.
How to Use the Manufacturing Efficiency Dashboard in Power BI
1️⃣ Download the Dashboard Template – Instantly access the Power BI file upon purchase.
2️⃣ Customize KPIs: Adjust the dashboard to match your specific manufacturing needs and KPIs.
3️⃣ Input Your Data: Connect your manufacturing data sources to Power BI and start tracking performance.
4️⃣ Analyze Performance: Use the interactive features to monitor efficiency, identify trends, and analyze machine performance.
5️⃣ Generate Reports: Produce detailed reports to present key findings to stakeholders.
Who Can Benefit from the Manufacturing Efficiency Dashboard in Power BI?
🔹 Manufacturing Managers
🔹 Operations Managers
🔹 Production Line Supervisors
🔹 Data Analysts
🔹 Supply Chain Managers
🔹 Factory Owners and Stakeholders
Click here to read the detailed blog post
Visit our YouTube channel to learn step-by-step video tutorials
Watch the step-by-step video tutorial:
Also check our Expense Tracking Dashboard in Power BI


Reviews
There are no reviews yet.