


Struggling to track candidates, source effectiveness, or hiring trends? 📉
The Recruitment and Hiring Dashboard in Power BI is your all-in-one solution to streamline the entire hiring pipeline—track metrics, visualize insights, and make data-driven decisions in real-time.
This ready-to-use dashboard transforms raw Excel data into powerful visuals and interactive reports, helping HR teams and recruitment professionals optimize hiring strategies, reduce costs, and improve candidate quality.
✅ Key Features of Recruitment and Hiring Dashboard in Power BI
📊 5 Dedicated Analytical Pages – Overview, Source Effectiveness, Department Analysis, Hiring Breakdown & Monthly Trends
🧩 6 Interactive Slicers Per Page – Filter by department, position, stage, source, month, and more
📈 Real-Time Visualizations – Auto-refresh charts and cards that respond to filters
💰 CTC, Experience & Volume Metrics – Gain complete visibility overcompensation trends and candidate experience
🎯 Department-Wise & Source-Wise Breakdown – Spot hiring patterns across teams and channels
📅 Hiring Trend Forecasting – Monitor monthly hiring activity to plan ahead
⚙️ Customizable Power BI Template – Modify visuals, filters, and layouts to suit your needs
📦 What’s Inside the Recruitment and Hiring Dashboard?
This Power BI template includes five powerful pages; each designed for specific HR insights:
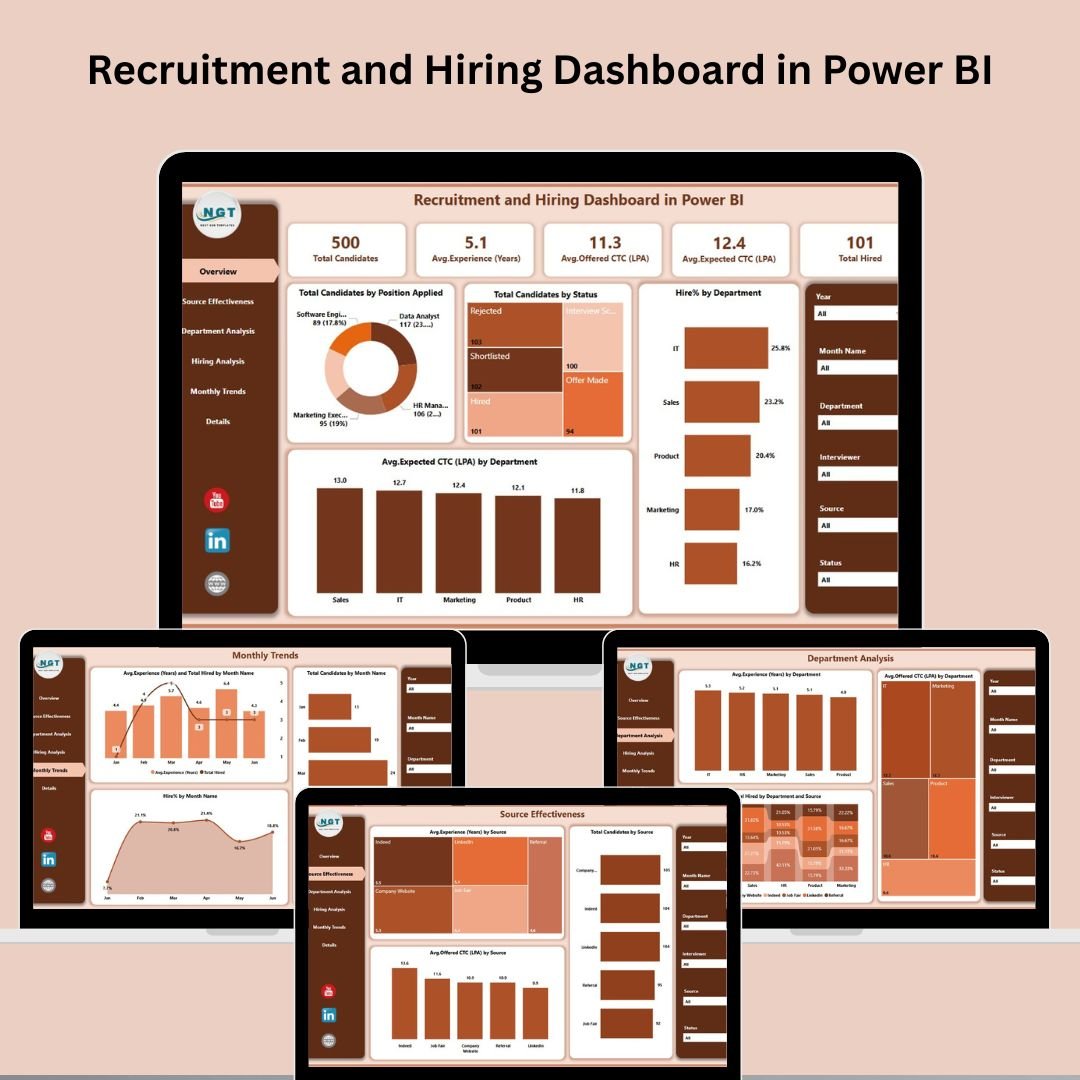
📌 Overview Page
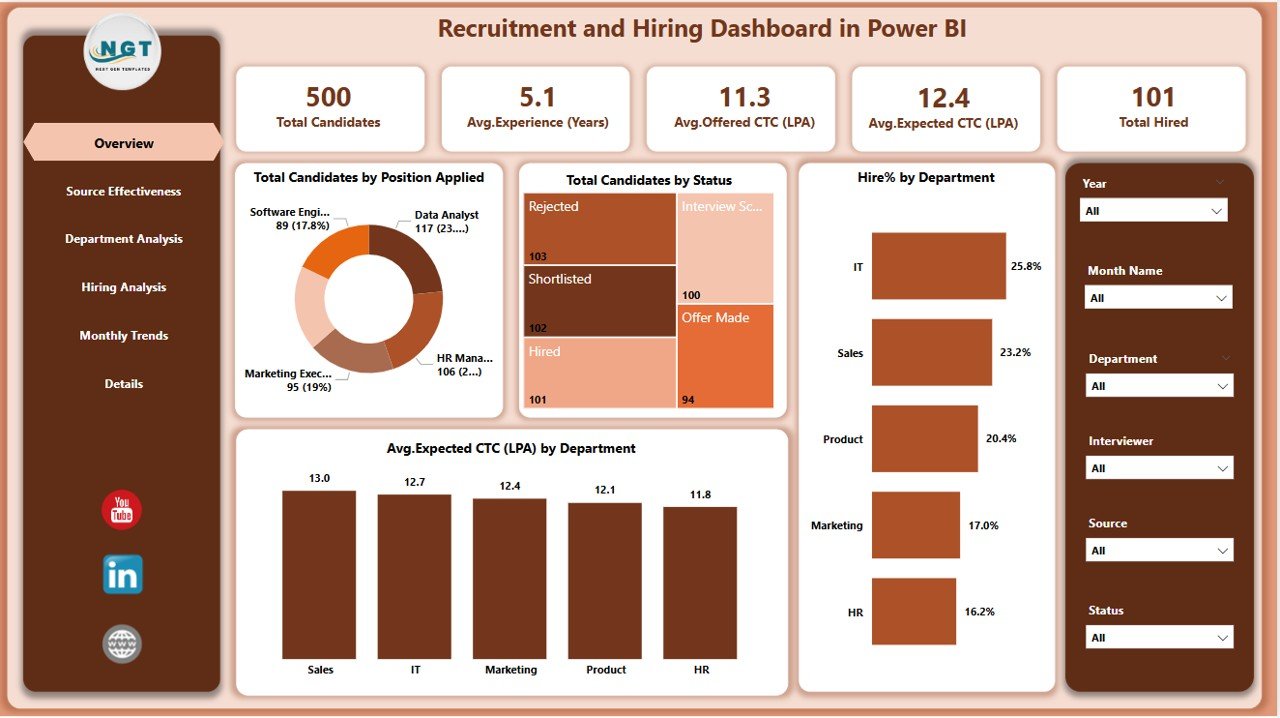
Your central summary with:
6 slicers (Department, Stage, Position, Source, Month, Status)
5 KPI Cards: Total Candidates, Hired Count, etc.
4 charts:
Candidates by Position
Candidates by Status
Hire % by Department
Average Expected CTC by Department
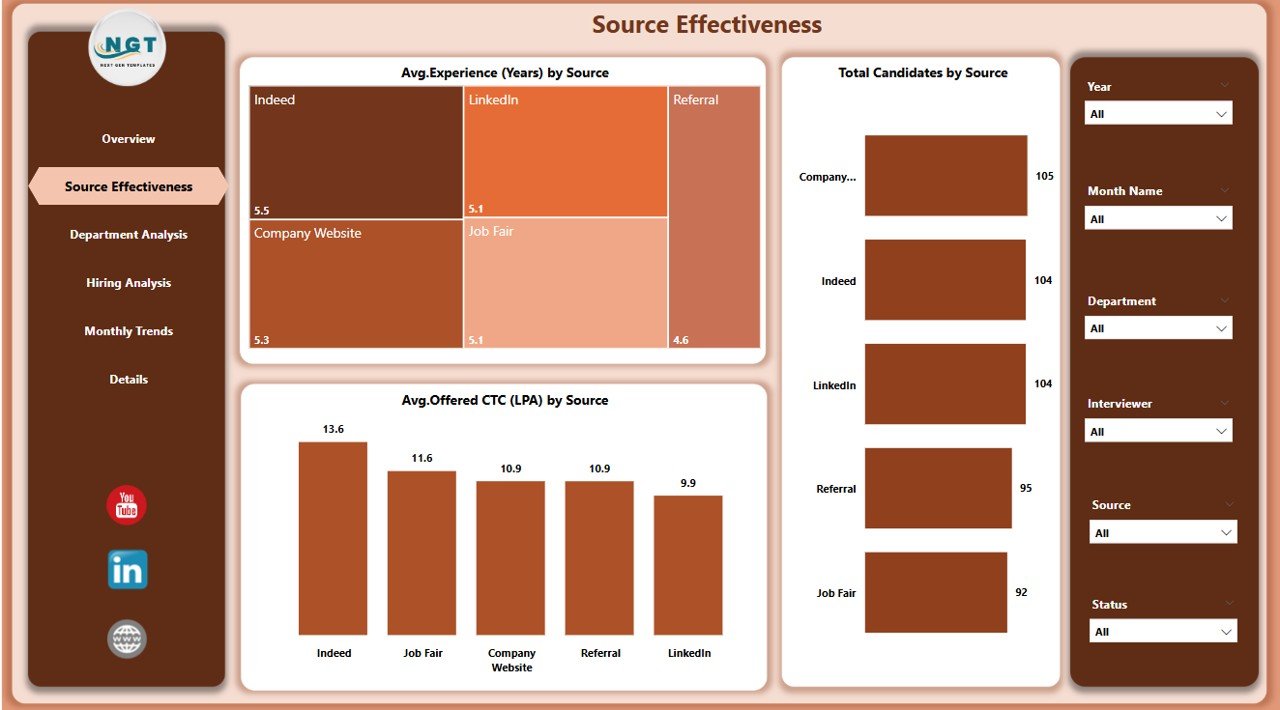
🌐 Source Effectiveness Page
Evaluate how each recruitment source is performing:
Average Experience by Source
Total Candidates by Source
Average Offered CTC by Source
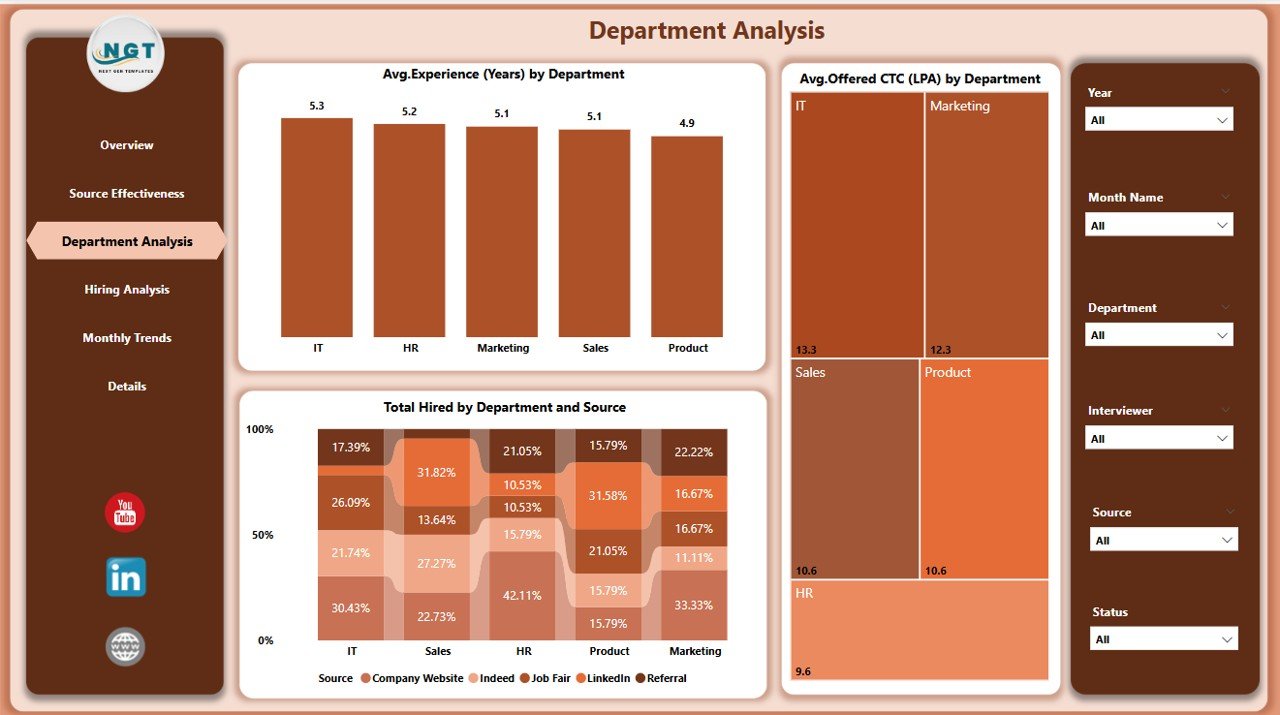
🏢 Department Analysis Page
Track recruitment by department:
Average Experience by Department
Average Offered CTC by Department
Total Hires by Department & Source
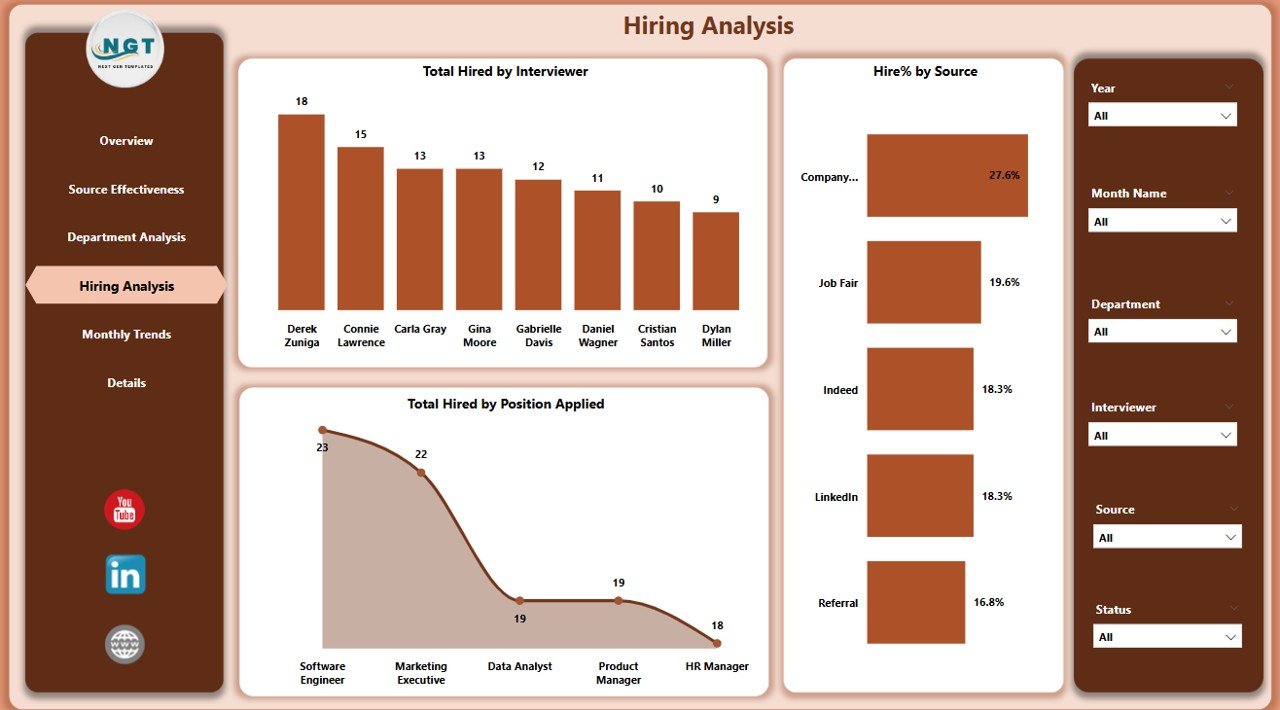
👥 Hiring Analysis Page
Deep-dive into actual hiring outcomes:
Total Hired by Department & Source
Experience and CTC data segmented by hires
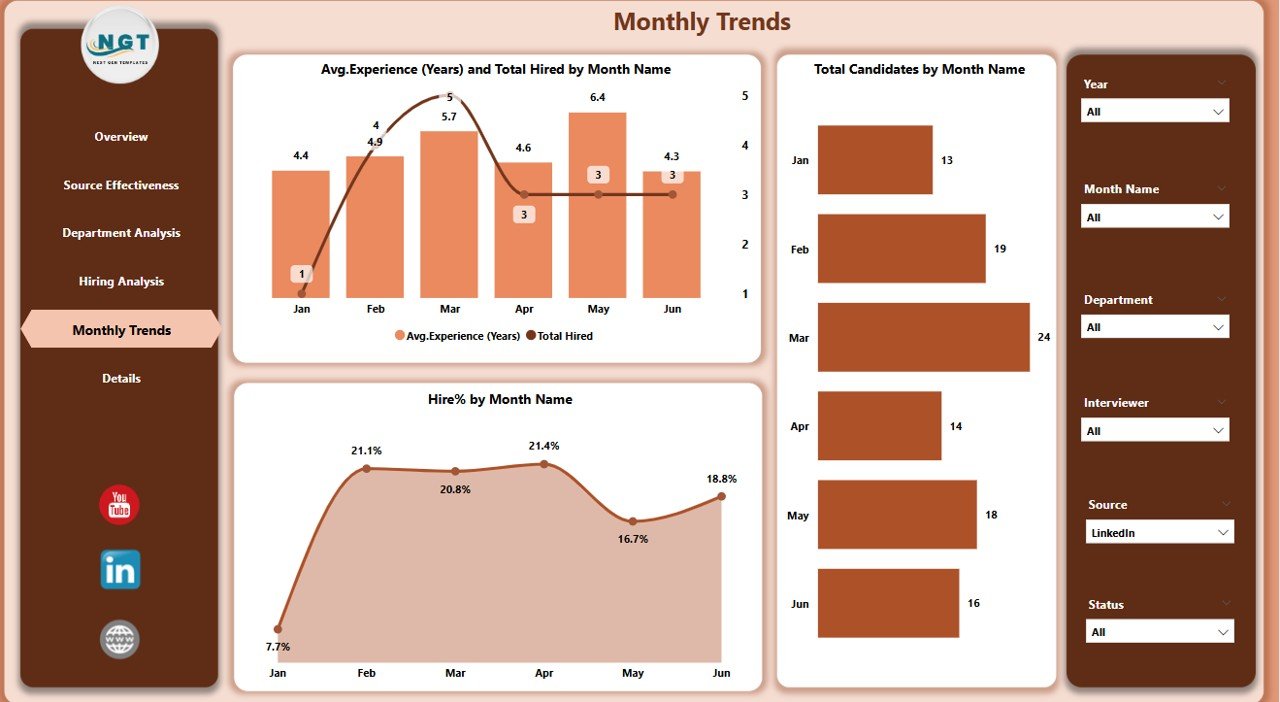
📆 Monthly Trends Page
Monitor hiring across time:
Total Hires by Month
Average Experience by Month
Hire % by Month
Total Candidates by Month
Each chart updates dynamically based on slicers—no manual adjustments needed!
🛠️ How to Use the Dashboard
Connect Your Excel Data File with fields for candidate details, departments, hiring status, source, experience, and CTC
Load Data into Power BI and ensure field mappings are correct
Navigate Between Pages using slicers for custom views
Analyze KPIs & Trends across positions, departments, and channels
Update Weekly or Monthly for real-time accuracy
Customize Layouts & Charts as needed using Power BI’s intuitive interface
👥 Who Can Benefit from This Dashboard?
💼 HR Professionals – Monitor recruitment metrics and hiring quality
🧑💼 Recruitment Managers – Identify bottlenecks and high-performing sources
🏢 Department Heads – Track hiring progress for their teams
📊 Talent Acquisition Teams – Optimize resource planning and hiring forecasts
📈 Executives – Gain strategic insight into organizational growth
🔗 Click here to read the Detailed blog post
🔗 Visit our YouTube channel to learn step-by-step video tutorials
Watch the step-by-step video tutorial:
Compatibility and Requirements
- Opens in Power BI Desktop, which is free. Microsoft explains how to install it in Get Power BI Desktop.
- The data comes from an Excel file with candidate details, departments, hiring status, source, experience and CTC.
Frequently Asked Questions
Which pages does the dashboard include?
Overview, Source Effectiveness, Department Analysis, Hiring Analysis and Monthly Trends.
How can I filter the reports?
Each page has slicers for department, stage, position, source, month and status, and every chart updates with your selection.
What does the Overview page show?
Five KPI cards, such as total candidates and hired count, plus charts for candidates by position and status, hire % by department and average expected CTC by department.
How do I use my own data?
Connect your Excel data file, load it into Power BI, check the field mappings and refresh. Update it weekly or monthly to keep the reports current.
Is there an Excel version?
Yes. The Recruitment and Hiring Dashboard in Excel covers the same topic in Excel.
Related Recruitment Templates
- Recruitment and Hiring Dashboard in Excel: the same topic in Excel
- Recruitment Pipeline Dashboard in Power BI: follow candidates through each stage
- Recruitment Pipeline Dashboard in Google Sheets: a pipeline view in Google Sheets
- Recruitment Funnel KPI Dashboard in Excel: funnel KPIs in Excel
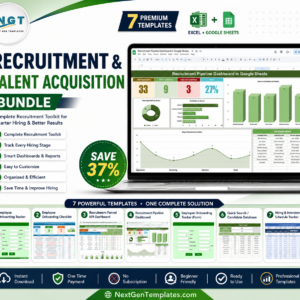
- Recruitment & Talent Acquisition Bundle: 7 recruitment templates in one download
Browse all Power BI dashboards or the HR and Payroll templates.










Reviews
There are no reviews yet.