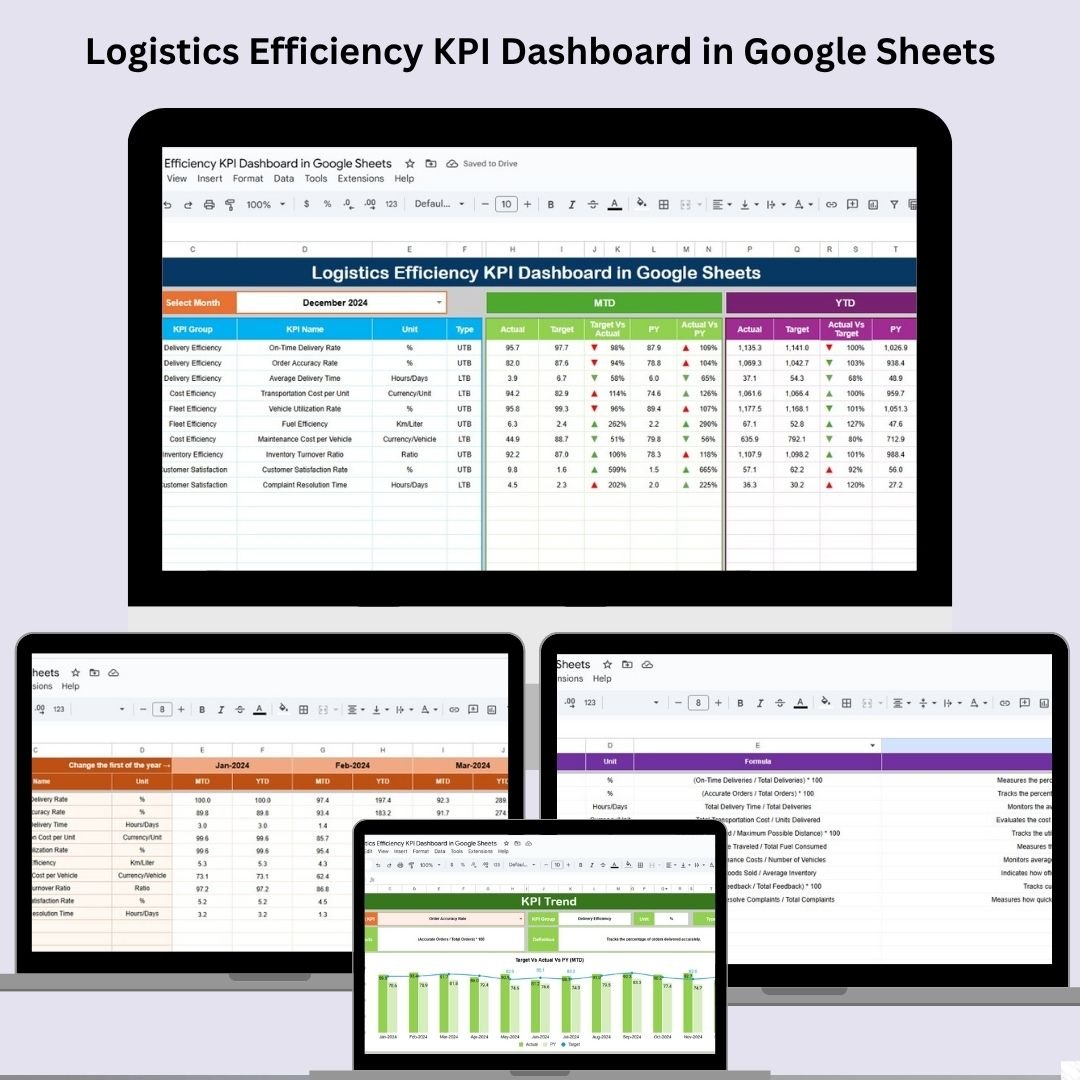
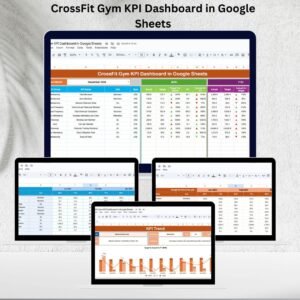
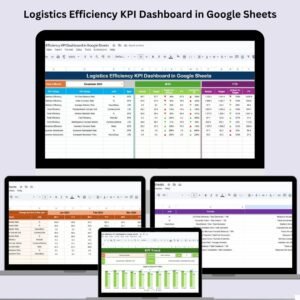
Managing logistics operations without real-time insights is like navigating without a map. That’s why we’ve created the Logistics Efficiency KPI Dashboard in Google Sheets—a smart, ready-to-use solution tailored for logistics teams and operations managers who want to monitor KPIs effortlessly and drive efficiency across every delivery, warehouse, and order fulfillment process. 📦📈
This dashboard isn’t just a spreadsheet—it’s your command center for analyzing logistics performance with clarity. With dynamic drop-downs, trend-tracking, and easy input panels, this Google Sheets tool allows you to track essential metrics like On-Time Delivery, Cost Per Delivery, Order Accuracy, and more—right from your browser.
🔑 Key Features of the Logistics KPI Dashboard
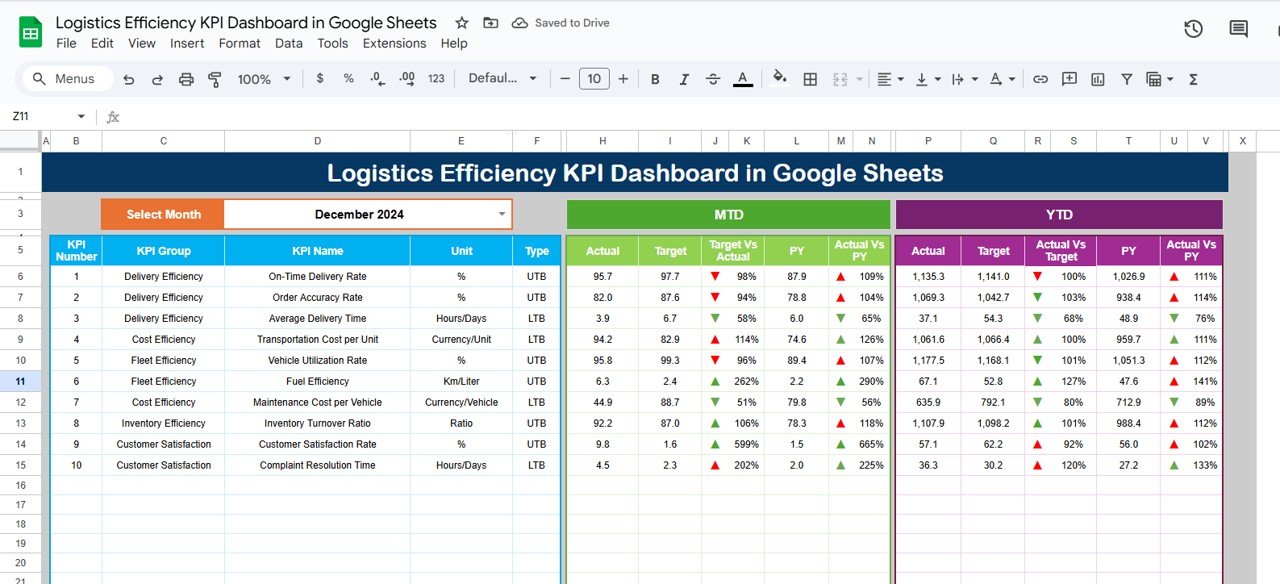
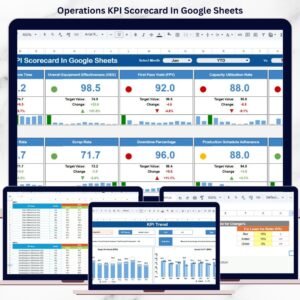
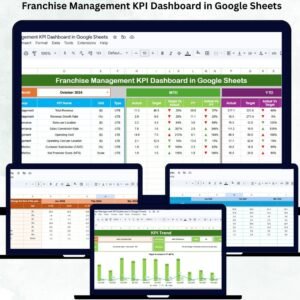
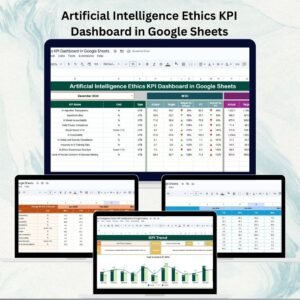
📍 Dashboard Sheet Tab
Your centralized performance view:
-
✅ MTD Actuals (Month-to-Date actual performance)
-
🎯 Target values for current month
-
📆 Previous Year Comparison for benchmarking
-
📊 Visual Indicators with up/down arrows and conditional formatting
-
📅 Month selector at cell D3 for dynamic updates
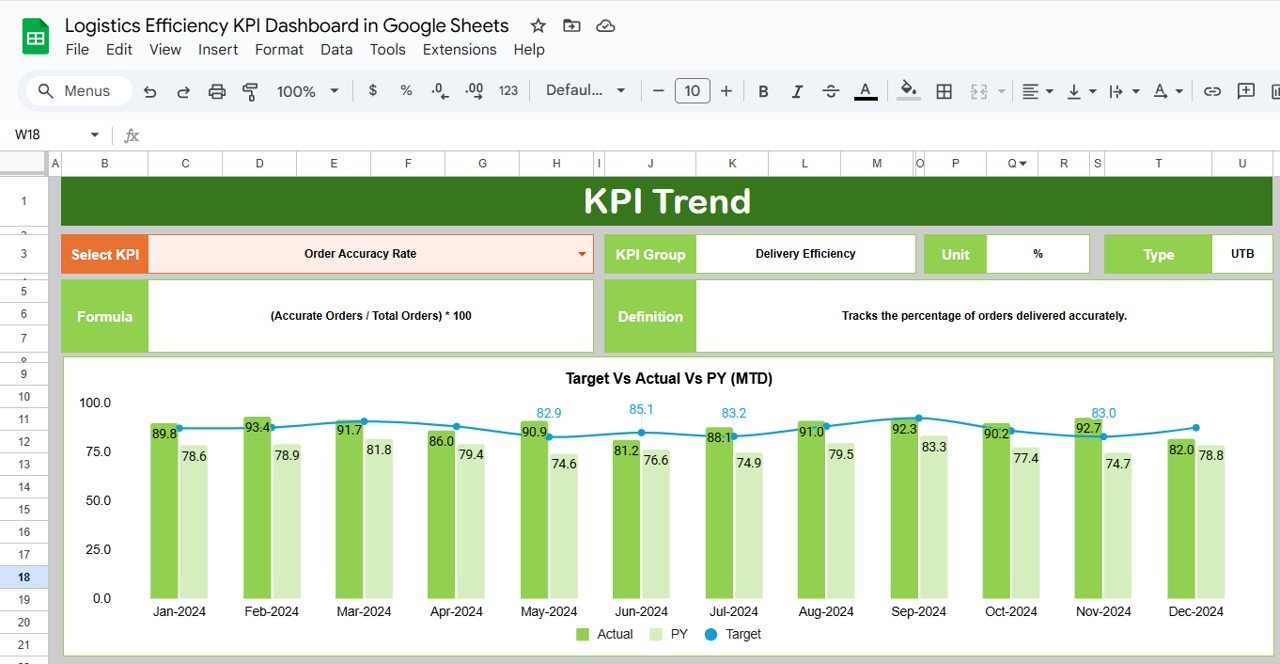
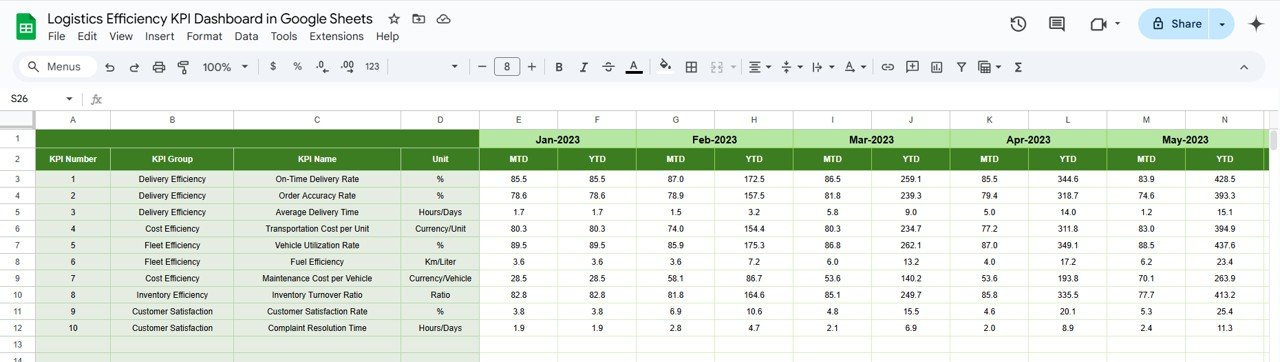
📈 KPI Trend Sheet Tab
Zoom in on any KPI:
-
View historical trends by selecting a KPI from the drop-down in Range C3
-
Includes KPI Group, Unit, Formula, and whether it’s Lower the Better (LTB) or Upper the Better (UTB)
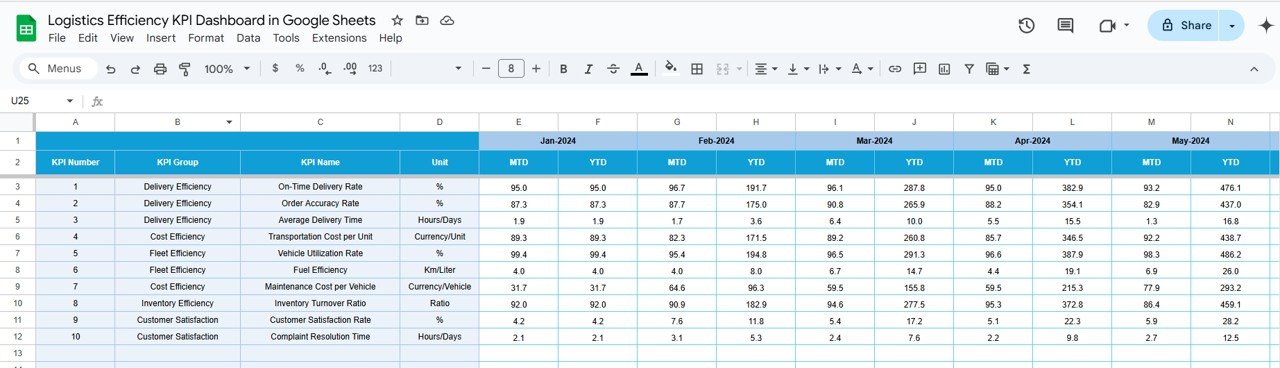
🧾 Actual Numbers Sheet Tab
Enter your real monthly and YTD numbers with a smart month selector in cell E1—keeping the dashboard updated in real-time.
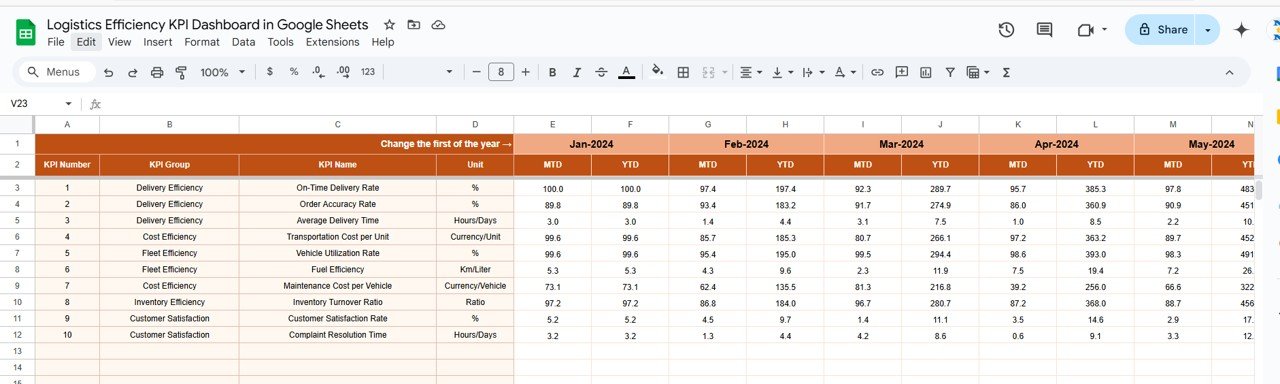
🎯 Target Sheet Tab
Input KPI targets for both MTD and YTD, enabling consistent goal-tracking and performance evaluation.
📊 Previous Year Sheet Tab
Compare your current numbers against last year’s performance to identify progress or setbacks.
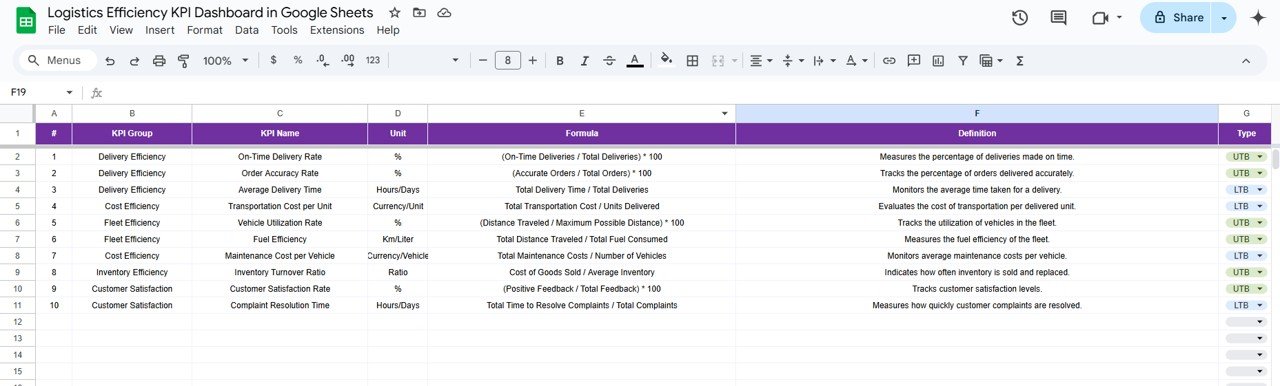
📘 KPI Definition Sheet Tab
Find all KPI definitions, formulas, units, and types clearly documented for your team’s understanding and alignment.
🚀 Why This Dashboard Is a Game-Changer
✅ Real-Time Performance Tracking – Monitor logistics metrics that matter, as data updates reflect instantly across all sheets
📊 Comprehensive View – From delivery timeliness to inventory turnover, see the full logistics picture in one place
🔁 Year-over-Year Insights – Easily spot improvement areas and historical dips
⚙️ Fully Customizable – Add new KPIs or modify formulas to match your business processes
📱 Cloud-Based Access – Use it on any device with Google Sheets, no software required
📥 No Coding Needed – Simple dropdowns and clean layouts mean anyone on your team can use it
👤 Who Should Use This Tool?
-
Logistics Managers – Optimize delivery timelines, reduce costs, and improve resource use
-
Operations Heads – Gain oversight across shipping, warehousing, and fulfillment
-
Supply Chain Analysts – Track trends, highlight inefficiencies, and recommend improvements
-
Warehouse Supervisors – Analyze throughput and track loading/unloading accuracy
-
Startups and SMBs – Get an enterprise-grade dashboard without the enterprise price tag
🧠 Best Practices
📌 Update data monthly in the Actual and Target sheets for accurate reports
📌 Review trends regularly to make proactive adjustments
📌 Customize your KPIs to match business-specific logistics goals
📌 Use visual indicators to instantly identify underperforming areas
📌 Involve your team in understanding and improving the numbers
🔗 Click here to read the Detailed blog post
Watch the step-by-step video Demo:


Reviews
There are no reviews yet.