Every organization, big or small, must ensure compliance with laws, regulations, and internal standards to maintain accountability and avoid legal risks. The Legal Compliance Dashboard in Google Sheets is a ready-to-use, interactive solution that helps compliance officers, HR managers, and executives monitor and manage compliance activities — all in one centralized, automated workspace.
With this dashboard, you can instantly visualize compliance metrics, track overdue tasks, measure on-time completion rates, and evaluate department-wise performance through dynamic charts and KPI cards — no coding or expensive software required.
⚖️ What Is a Legal Compliance Dashboard in Google Sheets?
A Legal Compliance Dashboard is a real-time monitoring and reporting system designed to track and analyze an organization’s compliance status.
Built entirely in Google Sheets, it provides full transparency into how different departments and compliance areas (like HR, Finance, Safety, or Tax) are performing. The dashboard automatically calculates compliance scores, urgency ratings, and completion status, helping managers stay ahead of risks and deadlines.
It’s an ideal tool for:
✅ Legal and compliance teams
✅ Internal auditors
✅ HR and operations managers
✅ Risk management professionals
🧭 Dashboard Structure Overview
The dashboard consists of multiple interactive tabs that provide both summarized and detailed performance views.
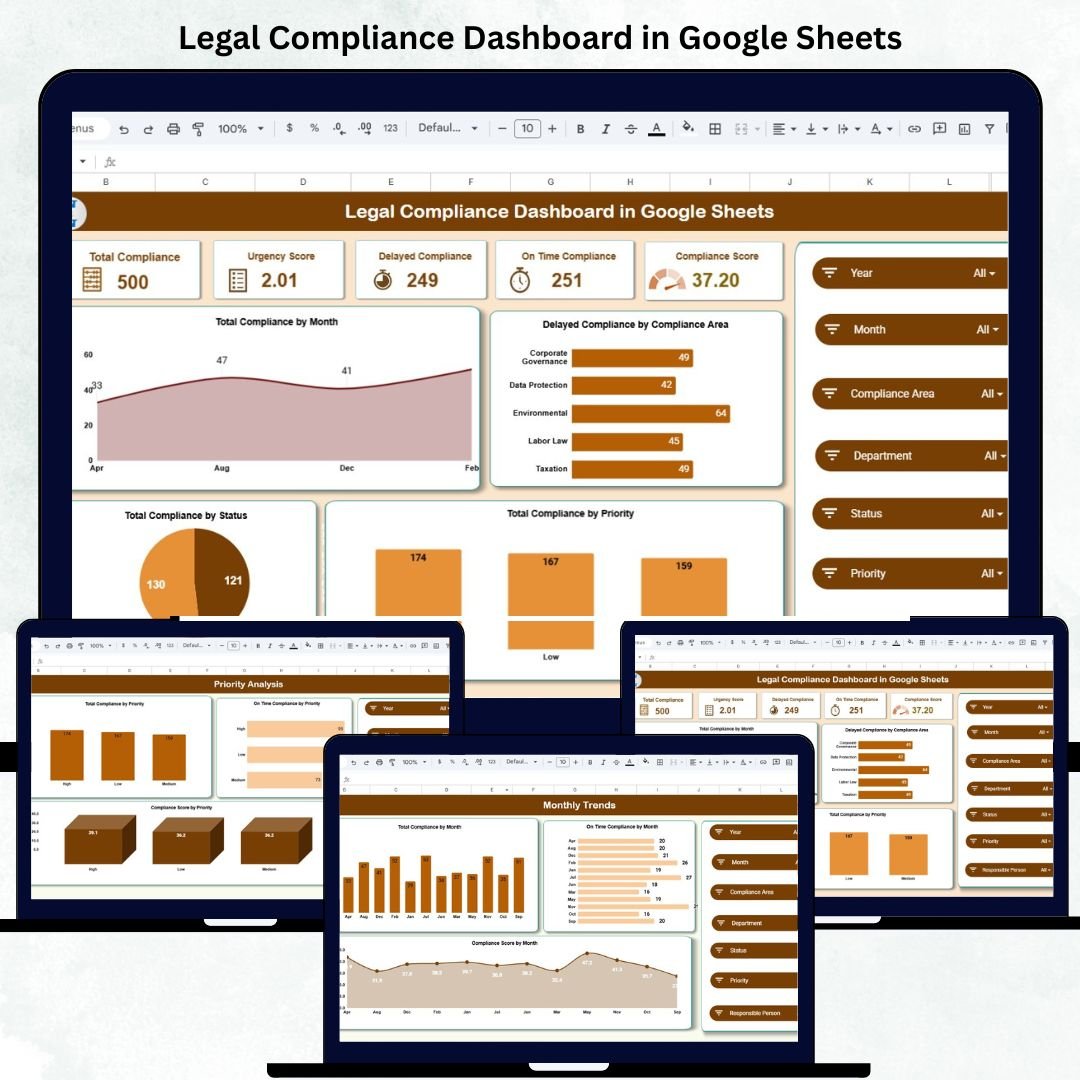
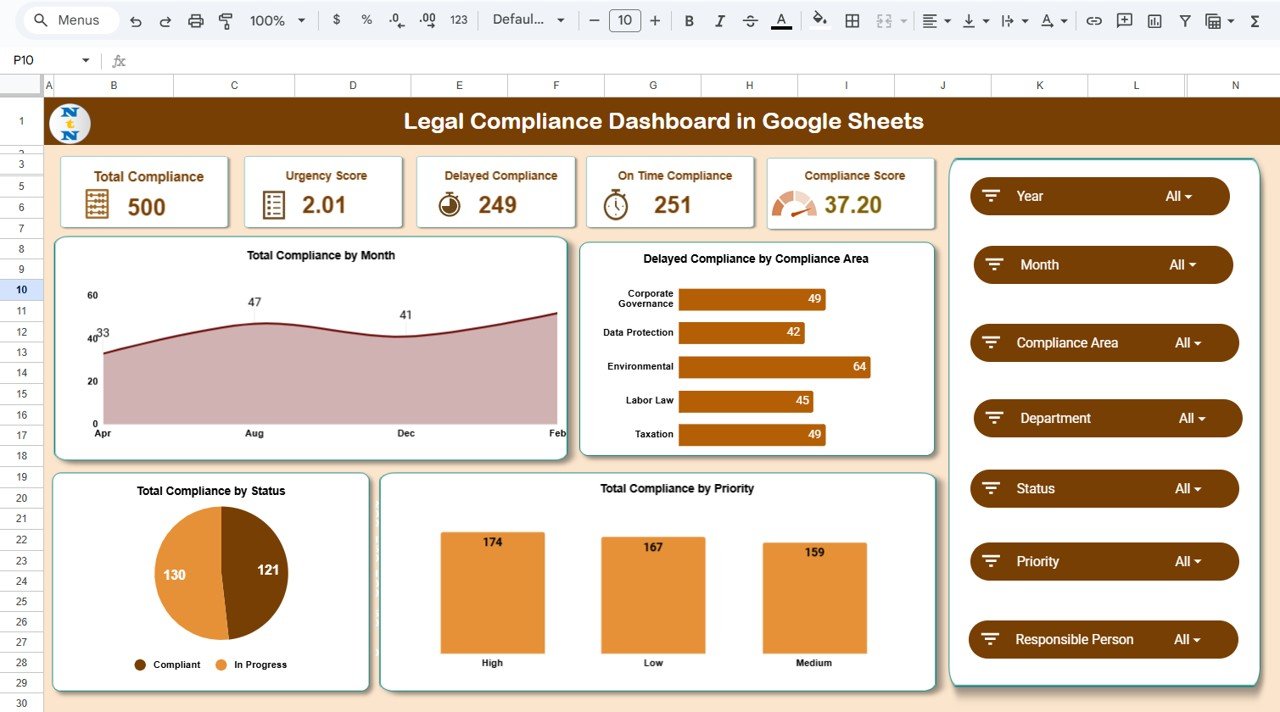
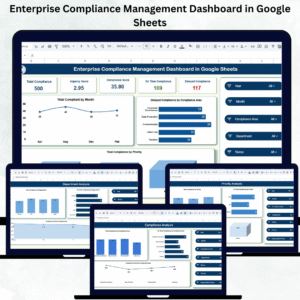
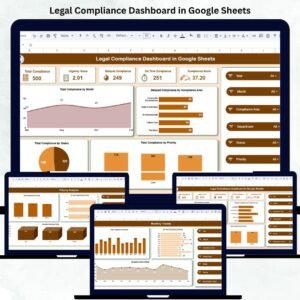
1️⃣ Overview Sheet Tab
This is the main page of the dashboard — a high-level summary of all compliance performance metrics.
KPI Cards Display:
-
Total Compliance: Total compliance tasks being tracked.
-
Urgency Score: Weighted score representing how many tasks are approaching deadlines.
-
Delayed Compliance: Number of compliance activities missed or completed late.
-
On-Time Compliance: Total number of items completed before or within deadlines.
-
Compliance Score: Overall health percentage that measures performance.
These KPIs allow decision-makers to instantly gauge the organization’s compliance health.
Key Charts:
📅 Total Compliance by Month – Monitors monthly compliance activity volume.
⚠️ Delayed Compliance by Area – Highlights domains (HR, Finance, Safety) facing frequent delays.
🏷️ Total Compliance by Priority – Categorizes High, Medium, and Low-priority tasks for resource allocation.
📊 Compliance Status Distribution – Shows overall task completion and pending percentages.
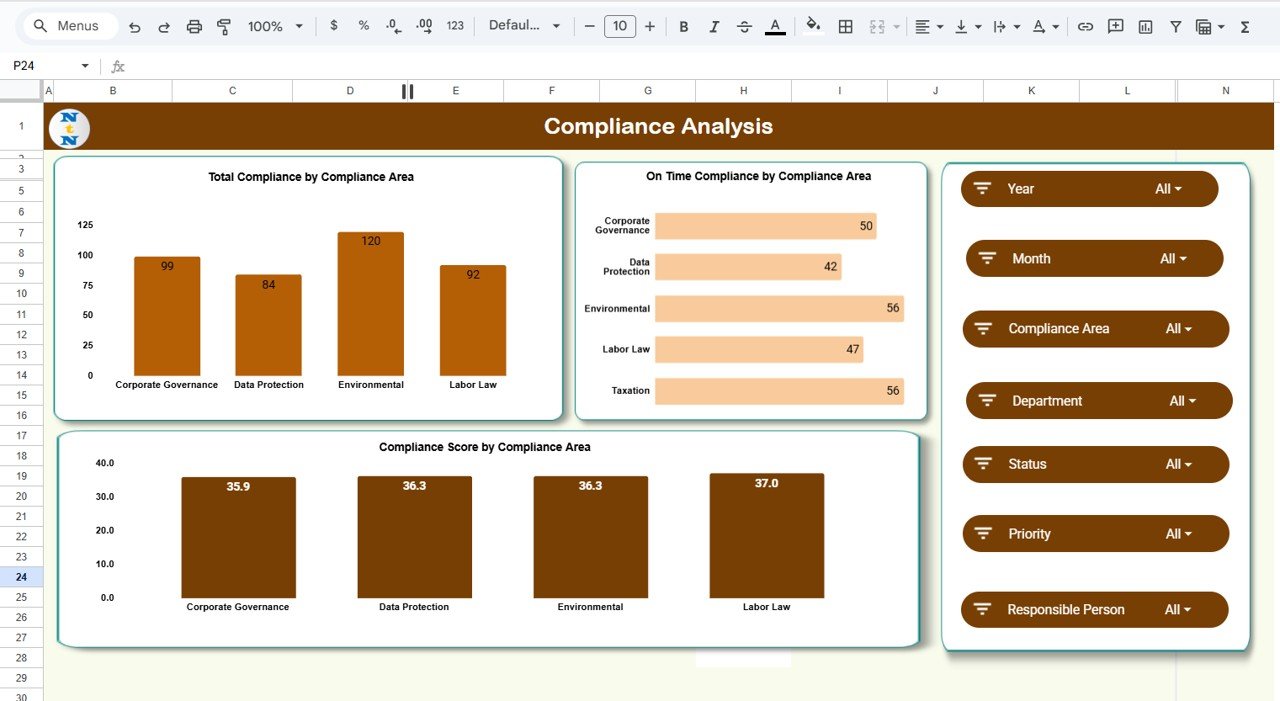
2️⃣ Compliance Analysis Sheet
This sheet dives deeper into the compliance performance by regulatory area.
Charts Included:
-
Total Compliance by Area
-
On-Time Compliance by Area
-
Compliance Score by Area
This allows compliance officers to pinpoint bottlenecks, recurring delays, or best-performing compliance domains.
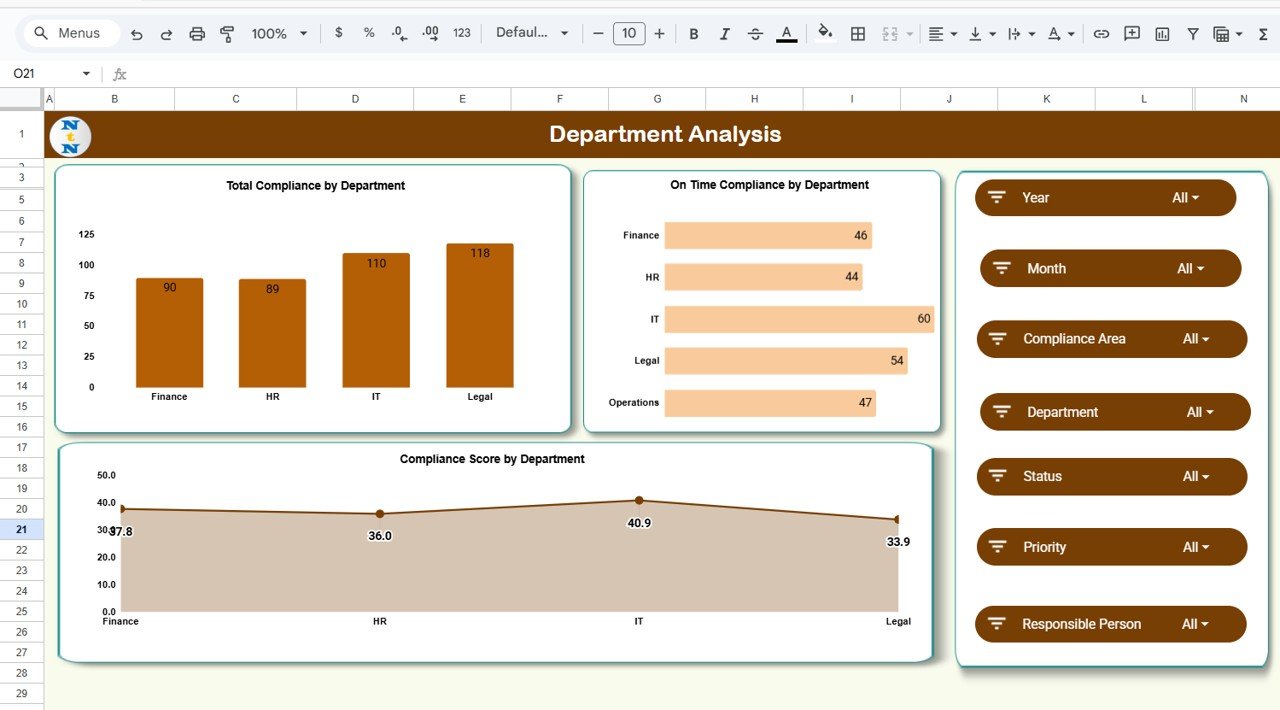
3️⃣ Department Analysis Sheet
This tab focuses on department-wise performance.
Charts Included:
-
Total Compliance by Department
-
On-Time Compliance by Department
-
Compliance Score by Department
This analysis helps leadership identify which teams are excelling and which need process improvement or additional training.
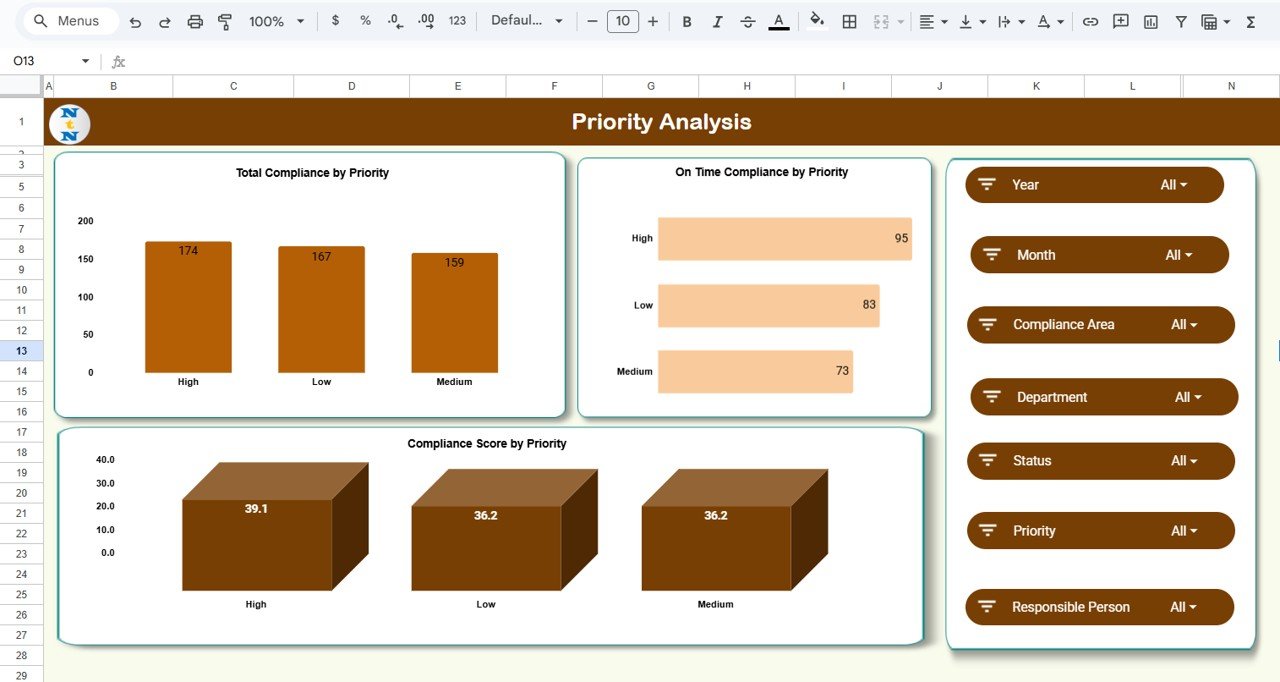
4️⃣ Priority Analysis Sheet
This page categorizes compliance items by their urgency or importance.
Charts Included:
-
Total Compliance by Priority
-
On-Time Compliance by Priority
-
Compliance Score by Priority
This view ensures that high-priority tasks get the most attention, reducing the risk of missing critical deadlines.
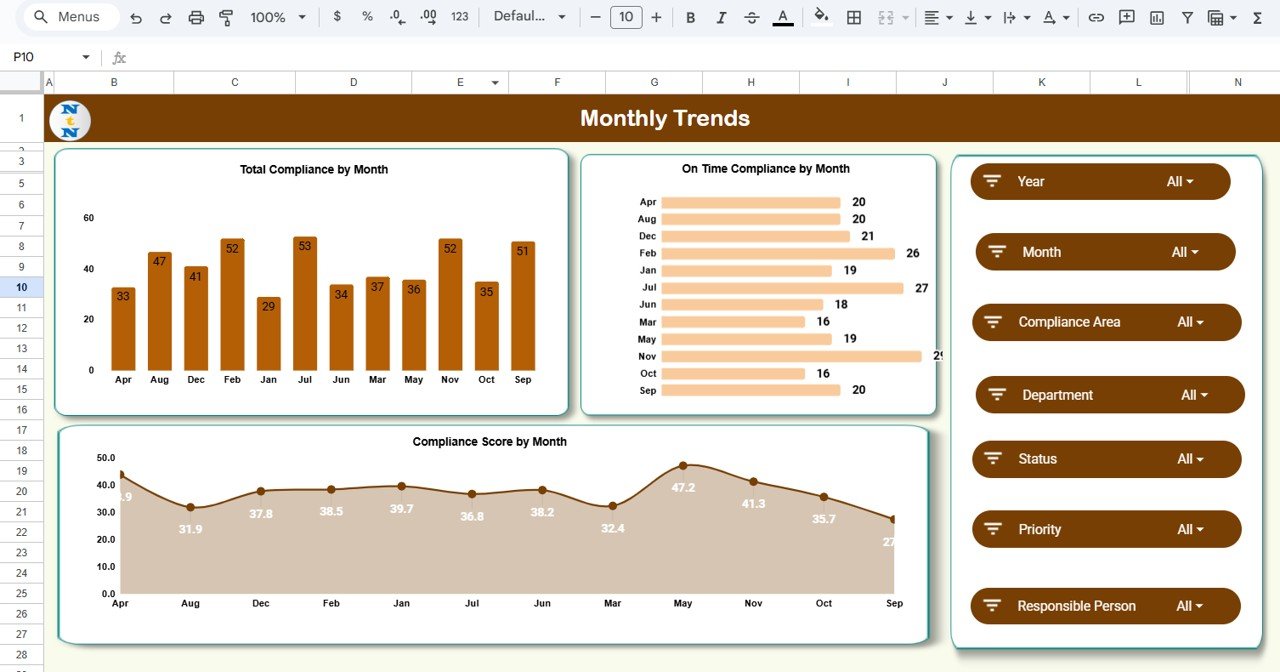
5️⃣ Monthly Trends Sheet
Here you can visualize performance over time to identify trends and forecast future risks.
Charts Included:
-
Total Compliance by Month
-
On-Time Compliance by Month
-
Compliance Score by Month
Perfect for monthly reviews or compliance committee reporting.
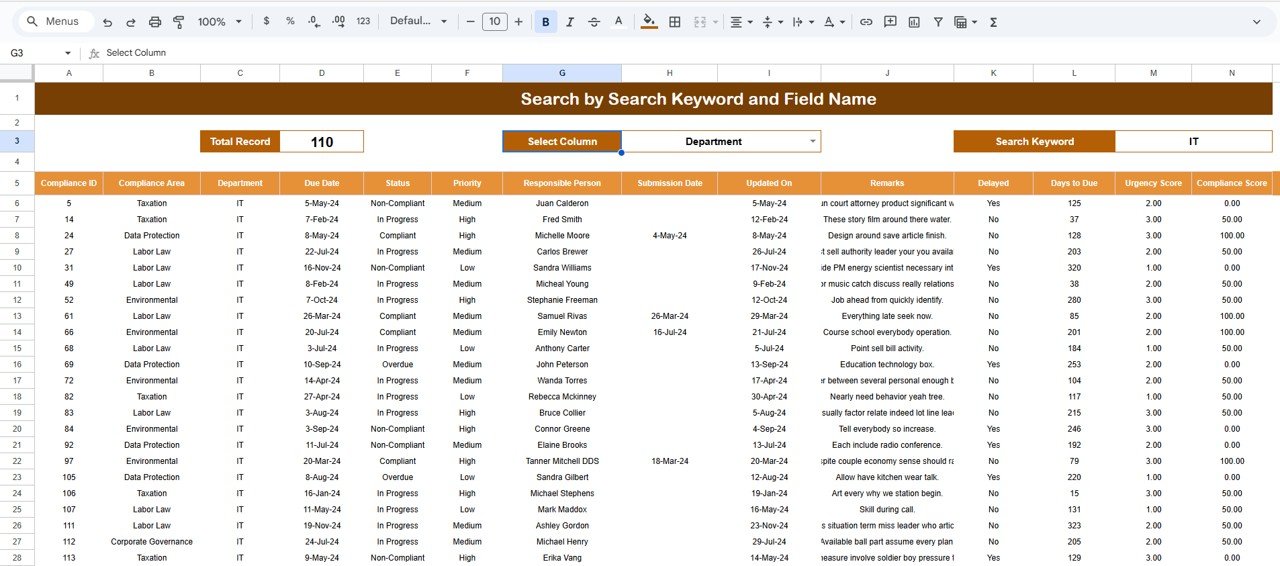
6️⃣ Search Tab
The Search Tab allows users to quickly filter compliance records by keywords.
Examples:
-
Search “Finance Department” → All finance-related tasks.
-
Search “High Priority” → Only critical compliance items.
-
Search “Overdue” → Immediate actions required.
This feature ensures quick access to specific compliance data without manual filtering.
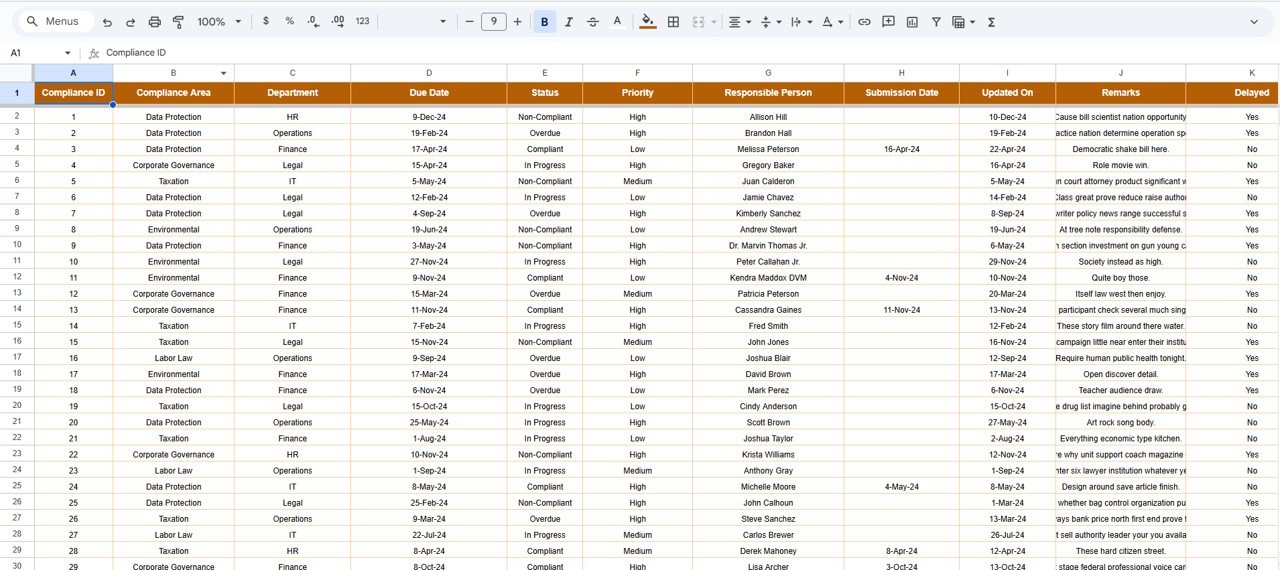
7️⃣ Data Sheet Tab
This is the foundation of the dashboard, containing all raw data inputs.
Typical Columns:
Compliance ID | Department | Compliance Area | Priority | Status | Due Date | Completion Date | Days Delayed | Compliance Score (%) | Urgency Score
As you enter or update data, the dashboard automatically recalculates KPIs and updates all charts.
🌟 Advantages of the Legal Compliance Dashboard
-
🏛️ Centralized Tracking: Monitor all compliance areas in one unified view.
-
⚙️ Automated Updates: Real-time recalculations ensure accurate insights.
-
📊 Visual Reporting: Instantly interpret data through charts and color-coded visuals.
-
🤝 Collaborative Access: Multiple users can edit and review simultaneously.
-
💡 Actionable Insights: Identify high-risk areas before they escalate.
-
💰 Cost-Efficient: Built in Google Sheets — no licensing fees required.
🚀 Opportunities for Improvement
Take your dashboard to the next level with:
-
Email Alerts: Automated reminders for pending or overdue tasks.
-
Google Form Integration: Collect compliance data directly from departments.
-
Automated Reporting: Generate PDFs or summary emails using Apps Script.
-
Geo-Mapping: Visualize compliance by location.
-
Audit Logs: Maintain an approval and verification history for each task.
💡 Best Practices for Using the Dashboard
✅ Update compliance data weekly or monthly.
✅ Maintain consistent naming formats for departments and compliance areas.
✅ Clearly define KPIs and thresholds.
✅ Restrict access for sensitive information.
✅ Review monthly trends to identify recurring non-compliance areas.
✅ Use color coding (Green/Yellow/Red) to focus on critical risks.
✅ Conclusion
The Legal Compliance Dashboard in Google Sheets is a game-changing tool for compliance management. It empowers organizations to stay legally aligned, audit-ready, and performance-driven — without the complexity of traditional software.
From tracking regulatory submissions to identifying at-risk areas, this dashboard transforms compliance management into a visual, collaborative, and data-driven process.
Whether you’re managing compliance for a startup or a large enterprise, this Google Sheets dashboard provides transparency, accountability, and peace of mind.
Click here to read detailed blog post
Watch the step-by-step video Demo:


Reviews
There are no reviews yet.