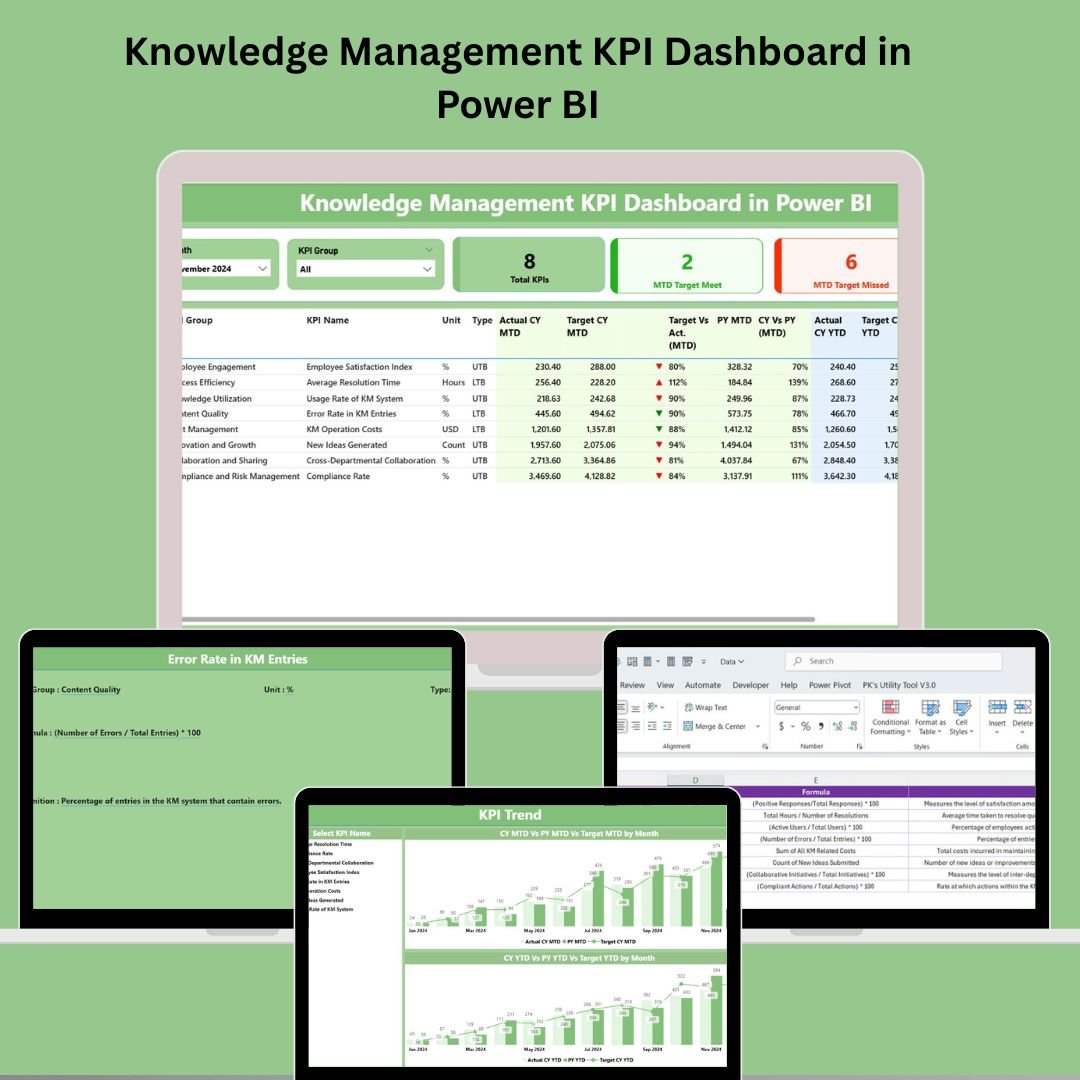
In the era of digital transformation, knowledge is one of your organization’s most valuable assets. But how do you measure it? Introducing the Knowledge Management KPI Dashboard in Power BI—a ready-to-use, powerful visual solution designed to help you monitor, track, and optimize how knowledge is captured, shared, and utilized across your teams.
Built with interactivity and simplicity in mind, this dashboard connects to a structured Excel data source, offering real-time performance visibility into your knowledge initiatives. Whether you’re managing documentation systems, training programs, or internal communication flows, this dashboard helps turn insights into action! ⚡
✨ Key Features of Knowledge Management KPI Dashboard
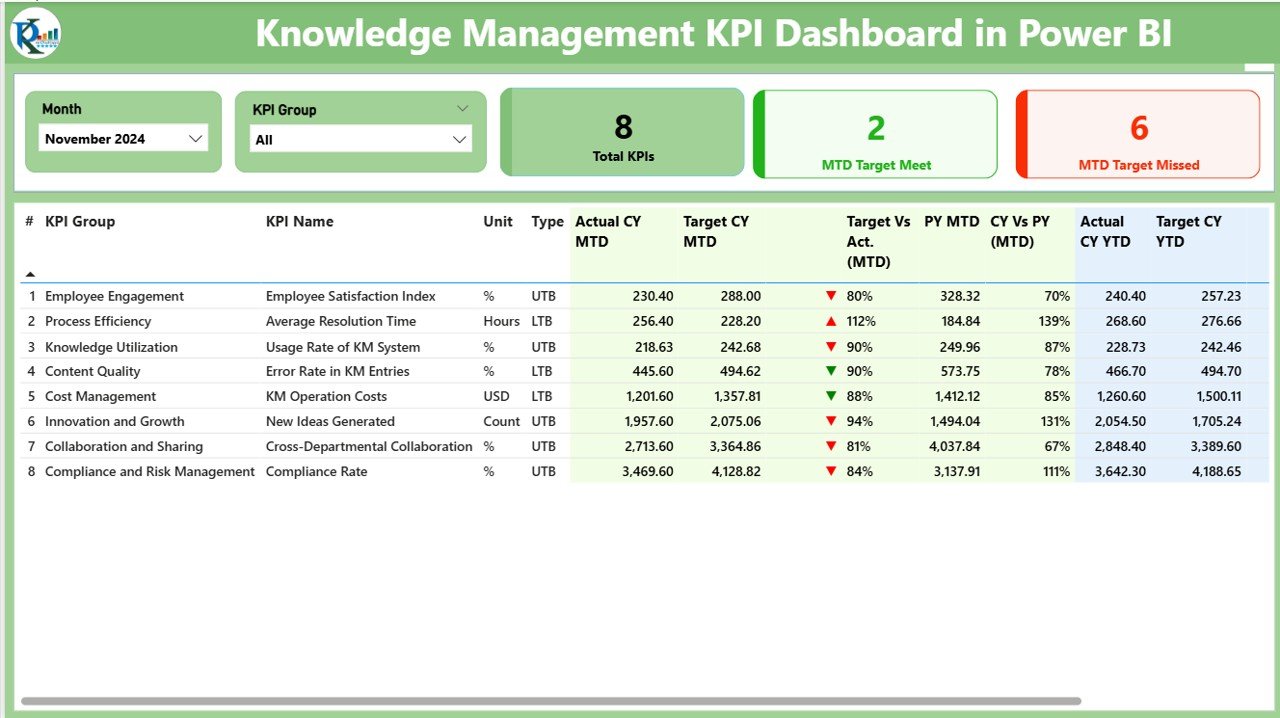
📊 Summary Page – The Pulse of Your KM Strategy
-
Navigate easily with slicers by month or KPI group.
-
View real-time cards showing:
-
✅ Total KPIs
-
🎯 MTD Target Met
-
❌ MTD Target Missed
-
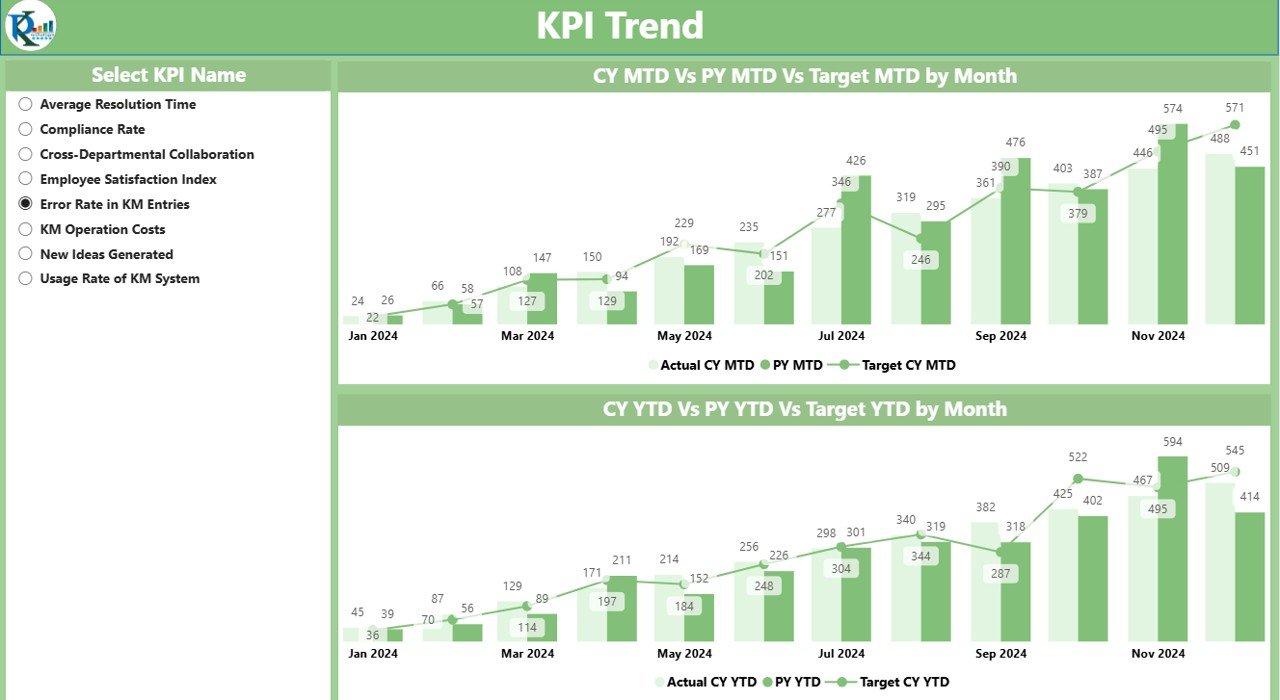
📈 KPI Trend Page – Track Performance Over Time
-
Visual combo charts for both Monthly and Yearly comparisons.
-
Filter by individual KPI to explore performance gaps or improvements.
-
Instantly identify patterns, dips, or gains in KPI progress.
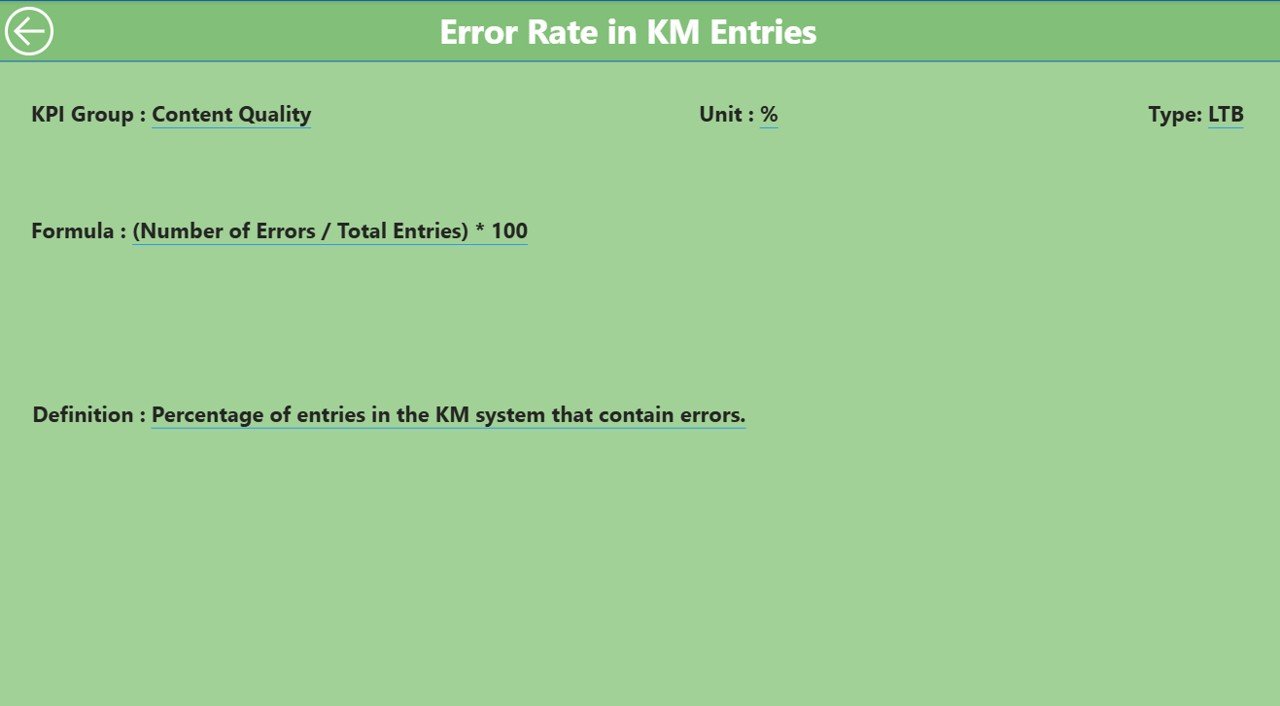
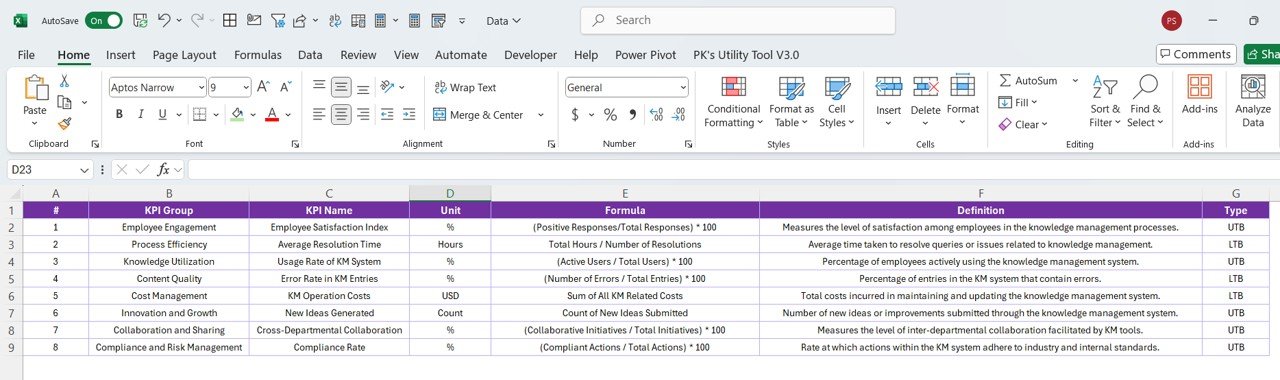
🧾 KPI Definition Page – Understand What Matters
-
Drill through to view formula, definition, and type (UTB or LTB).
-
Return with a simple back button for easy navigation.
-
No guesswork—know exactly what each KPI measures.
📦 What’s Inside the Knowledge Management KPI Dashboard
-
Three Power BI Pages: Summary, KPI Trend, and KPI Definition.
-
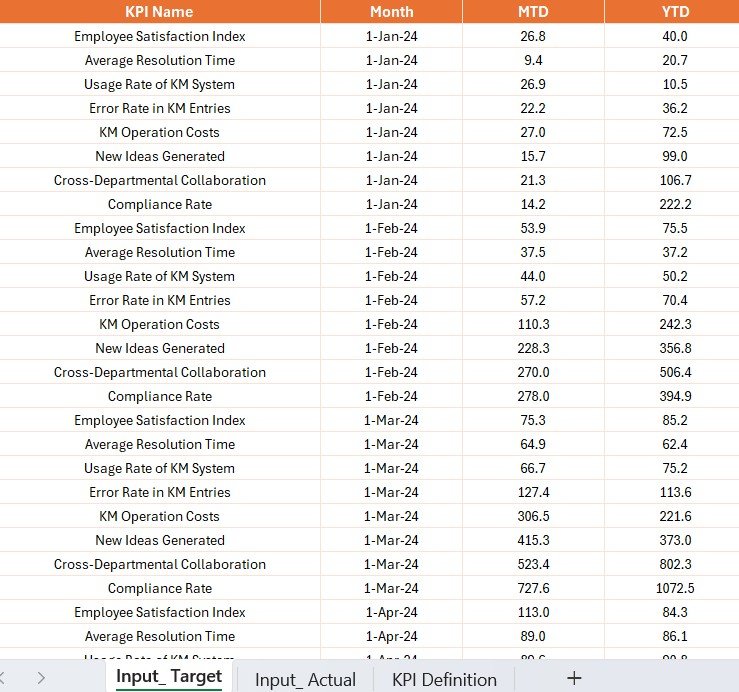
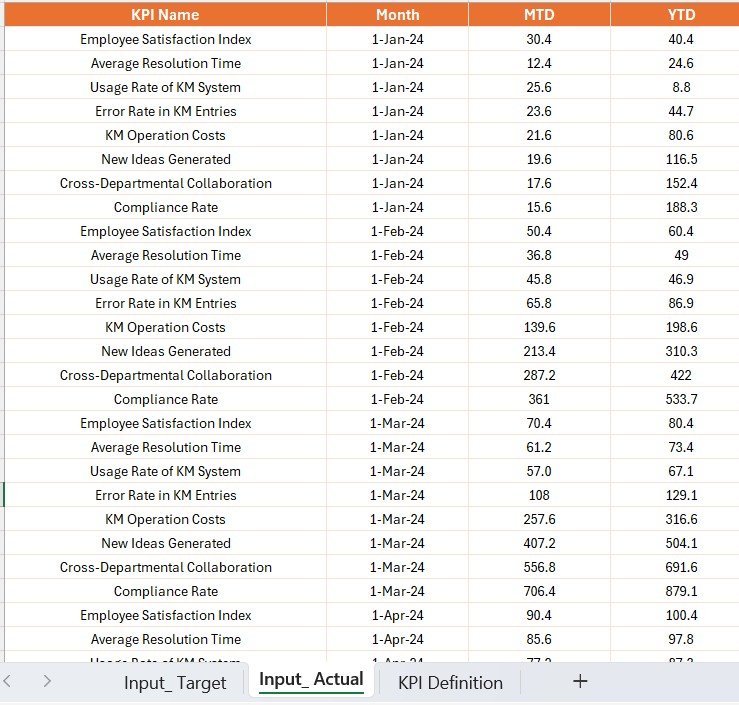
Excel Source File with:
-
Input_Actual sheet (for MTD & YTD data)
-
Input_Target sheet (for target tracking)
-
KPI Definition sheet (with metadata and formulas)
-
-
Slicers, Charts, Drill-throughs, and Icons for intuitive navigation and performance clarity.
-
Data structure that supports scalability—easily add more KPIs as your needs evolve.
🛠️ How to Use the Knowledge Management KPI Dashboard
-
Open the Excel source file and enter/update your monthly KPI data.
-
Refresh the Power BI report to see all charts and visuals auto-update.
-
Use slicers and charts to analyze trends and performance across departments or projects.
-
Drill down into KPI definitions for clarification or during team reviews.
-
Export visuals or publish to Power BI Service for team-wide reporting.
👥 Who Can Benefit from This Dashboard?
🎓 Knowledge Managers
Track documentation lifecycle, article usage, and knowledge sharing effectiveness.
💼 Business Analysts
Gain real-time visibility into process gaps and data-driven opportunities.
📚 Learning & Development Teams
Measure training participation, learning material usage, and performance growth.
🏢 Project and IT Teams
Understand internal knowledge flows, tech documentation access, and issue resolution efficiency.


Reviews
There are no reviews yet.