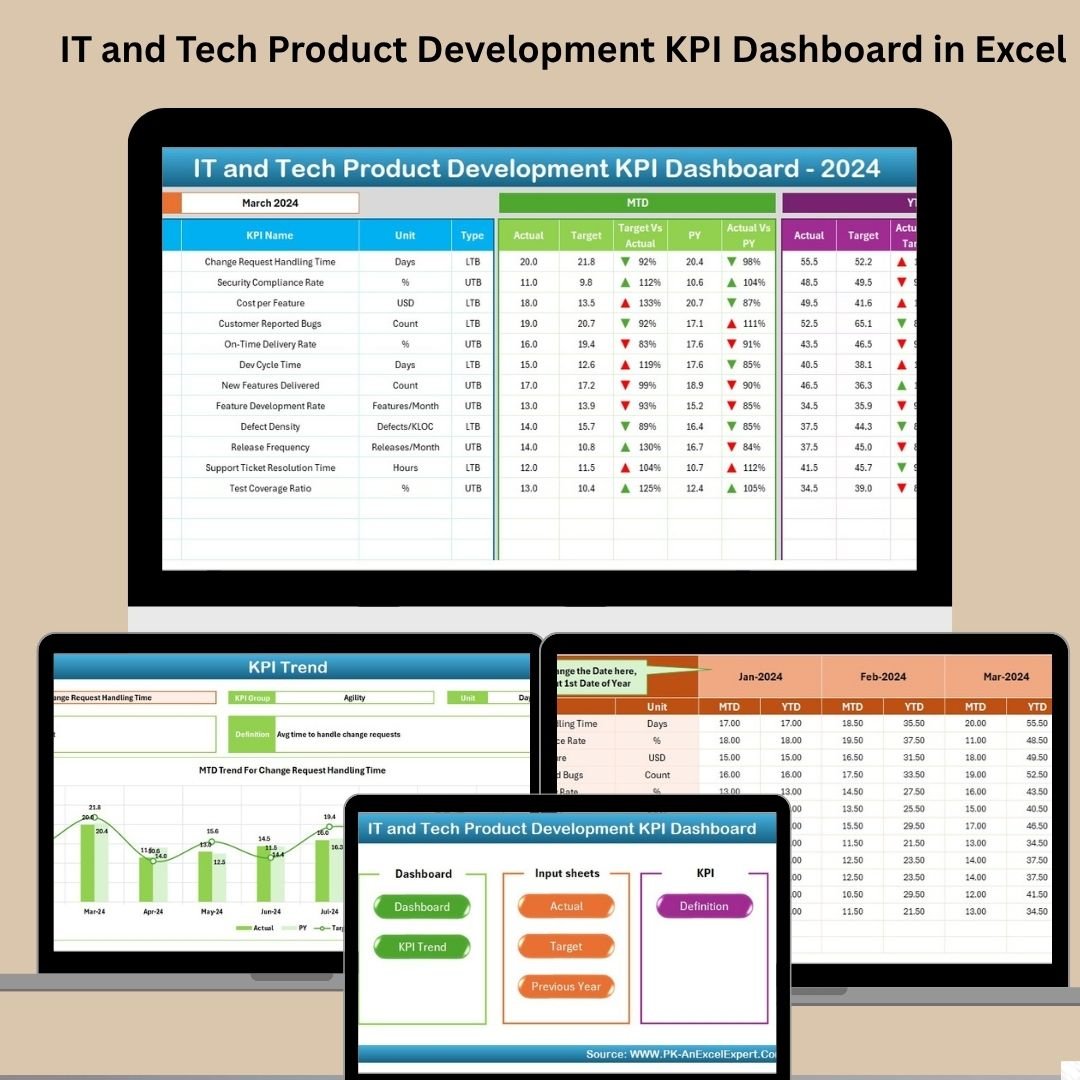
Tracking tech product development without real-time visibility is like coding in the dark. That’s where the IT and Tech Product Development KPI Dashboard in Excel becomes a true asset. 🚀
This powerful, ready-to-use Excel-based dashboard helps you track your product development KPIs with clarity, consistency, and visual impact. Whether you’re managing sprints, debugging code, or analyzing team performance—this dashboard empowers your decisions with real data.
No subscriptions, no complex software—just Excel and your team’s focus. 💡
✨ Key Features of IT and Tech KPI Dashboard
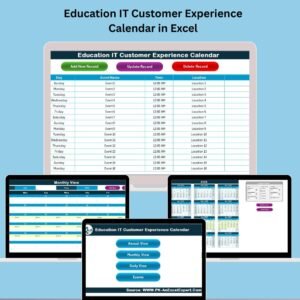
📌 Home Sheet: Your Central Command
-
Clean and clickable interface with 6 navigation buttons
-
Perfect for developers, project leads, and analysts
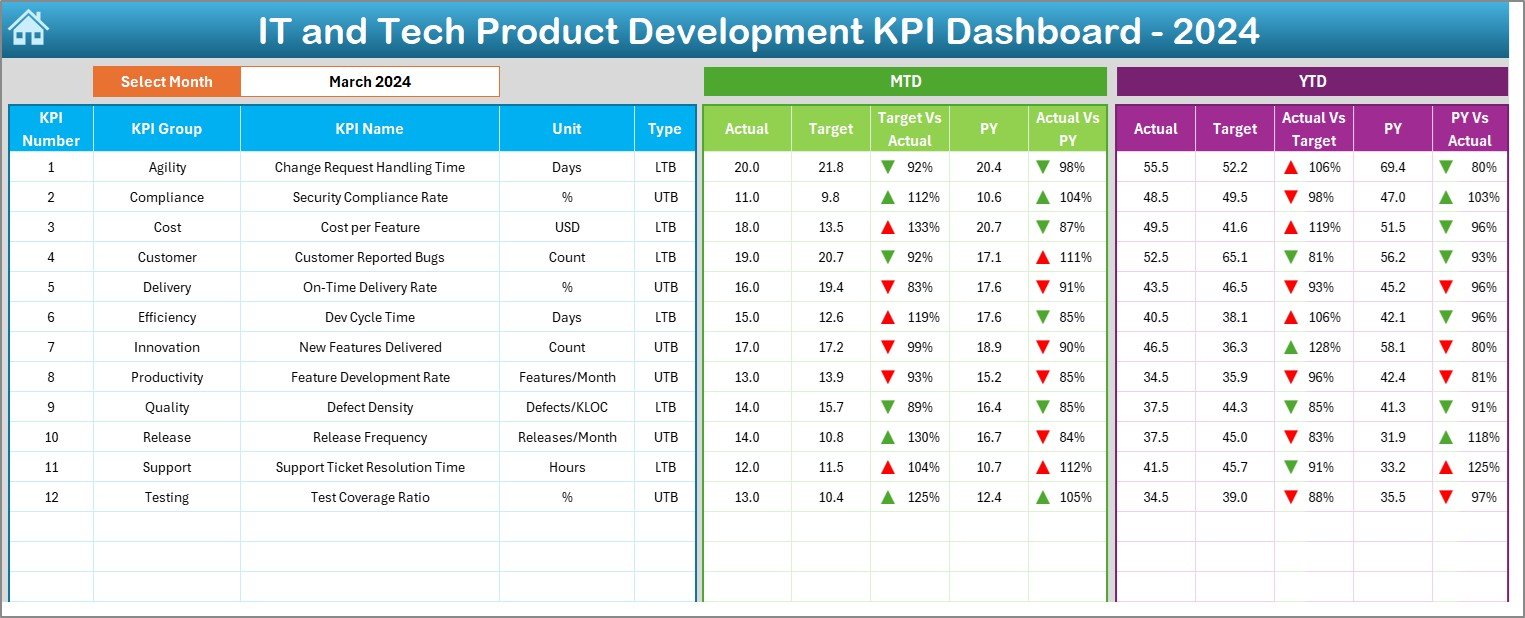
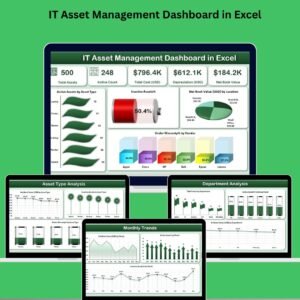
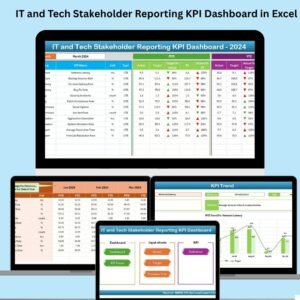
📈 Dashboard Sheet: KPI Performance in Focus
-
Month selection via dropdown (cell D3)
-
Auto-updating visuals with MTD, YTD, Target & PY comparison
-
🚦 Up/Down arrows signal real-time performance trends
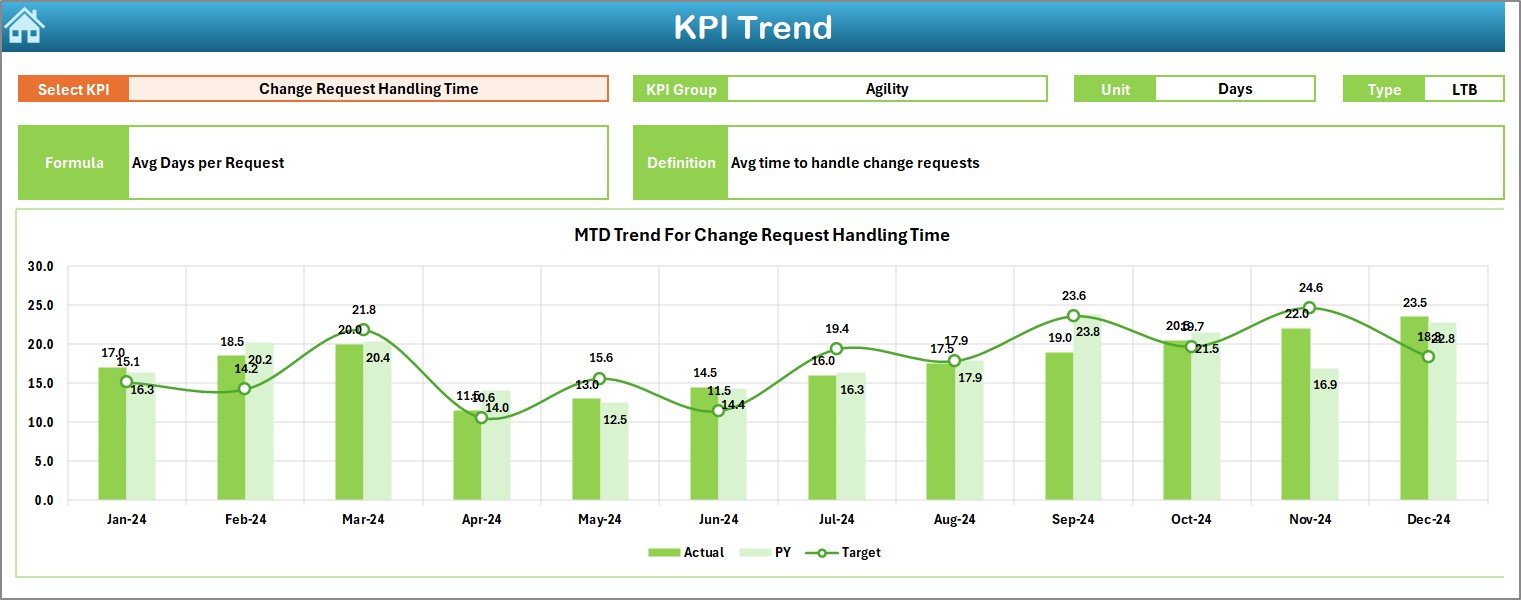
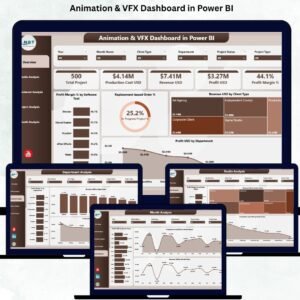
📊 KPI Trend Sheet: Performance Over Time
-
Select KPI to view progress over months
-
Highlights KPI Group, Formula, Unit, and Type (LTB/UTB)
-
Includes MTD/YTD trend charts to track gaps and growth
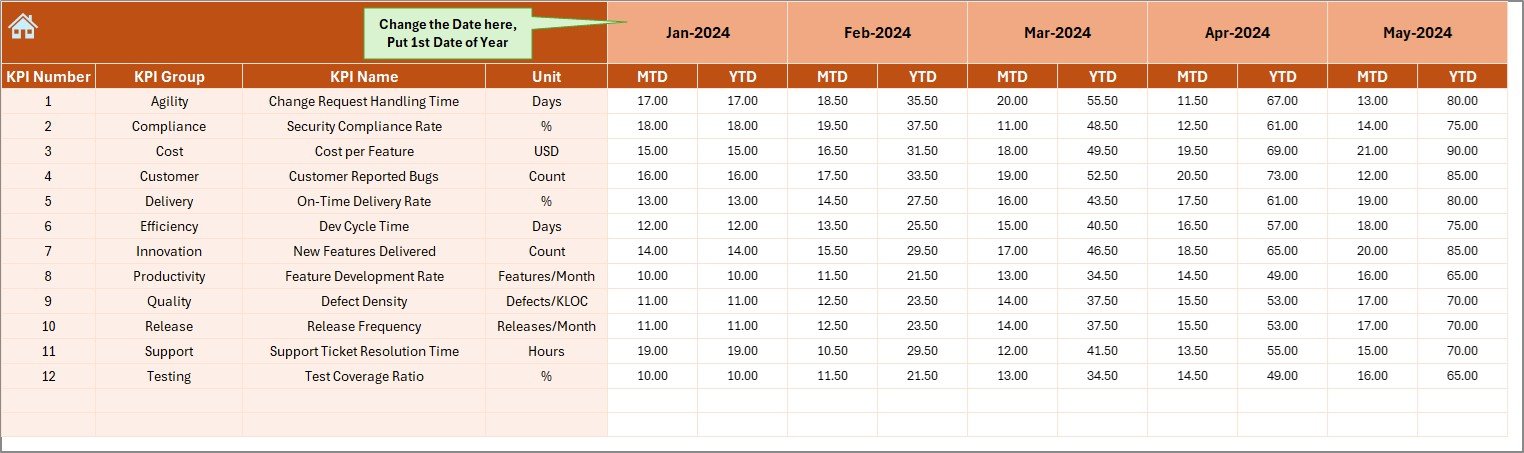
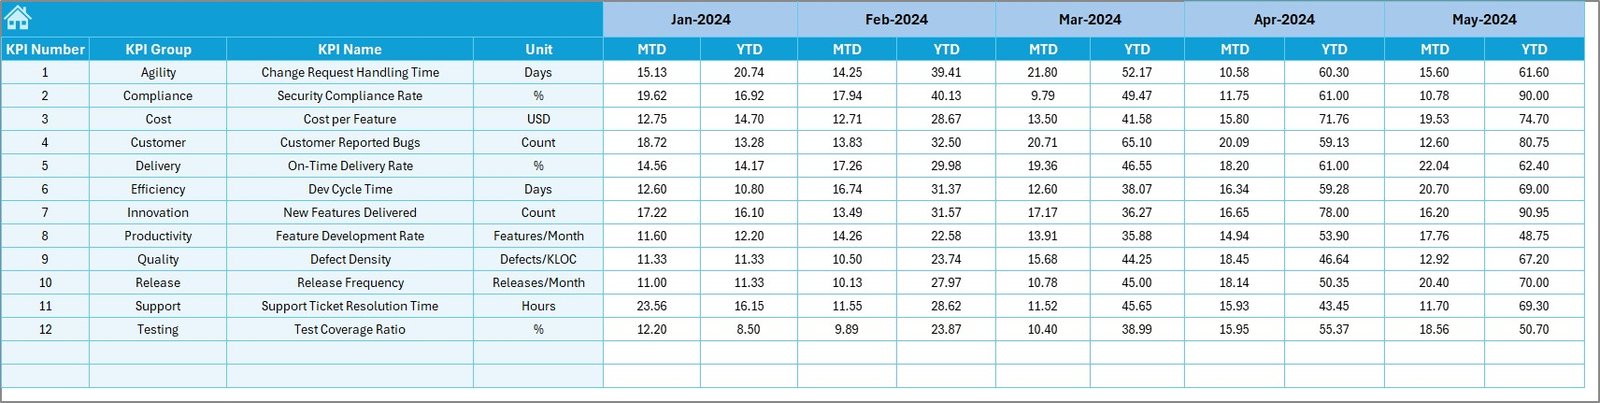
📥 Actual Numbers Input Sheet: Your Data, Your Way
-
Simple input for MTD/YTD actuals
-
Set your current month (cell E1) to automate yearly metrics
🎯 Target Sheet: Goal Setting Made Easy
-
Input strategic benchmarks for every month
-
Aligned with OKRs or historical performance
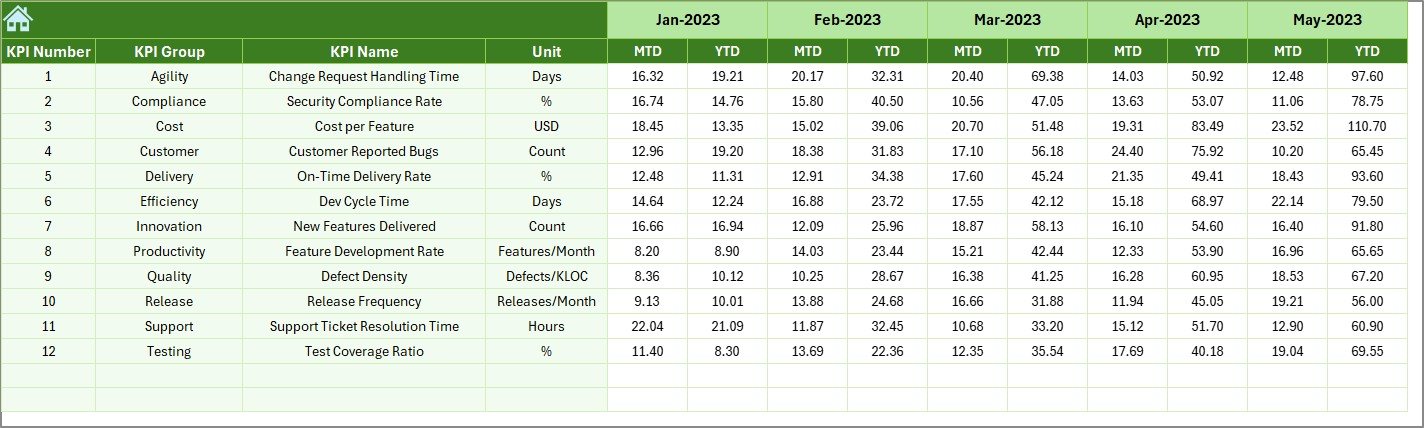
📆 Previous Year Sheet: Learn from the Past
-
Add last year’s KPI data to assess YoY progress
-
Visual growth indicators for better forecasting
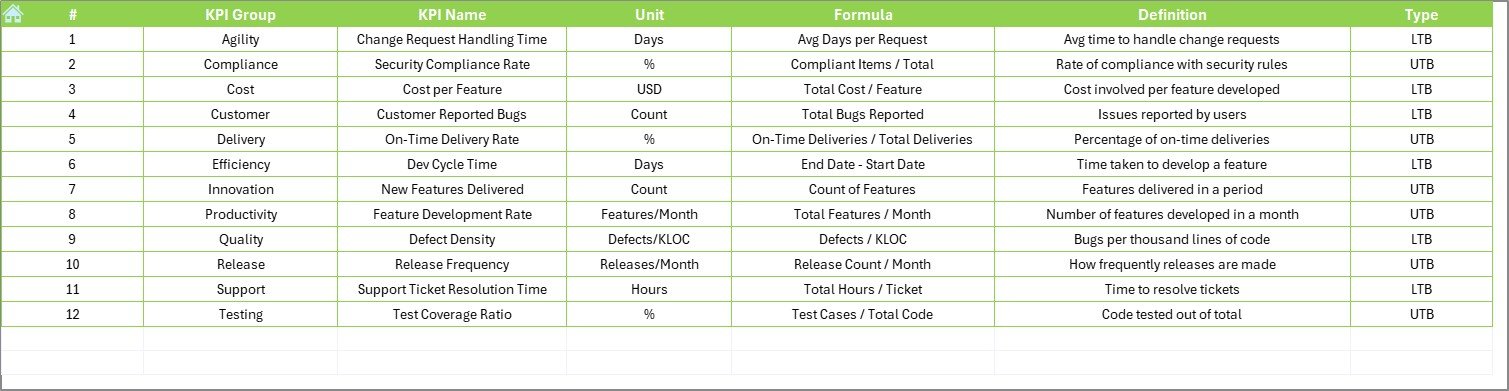
📌 KPI Definition Sheet: Speak the Same Language
-
All KPIs are clearly defined
-
Includes group, formula, unit, and KPI type
-
Keeps your entire team aligned on what’s being measured
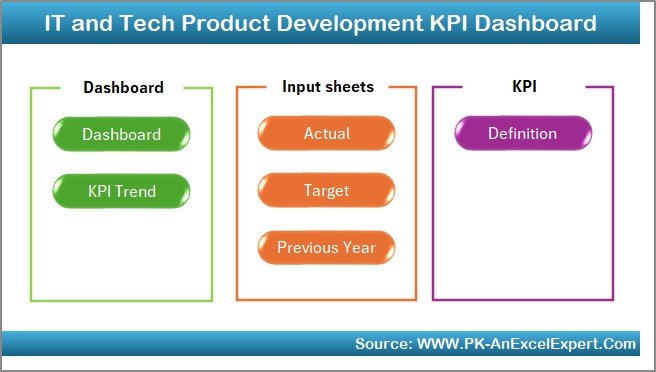
📂 What’s Inside the Product
🧩 7 Structured Sheets:
-
Home Sheet – Navigation buttons to each module
-
Dashboard Sheet – At-a-glance monthly KPI summary
-
KPI Trend Sheet – Interactive trend visualization
-
Actual Numbers Input – Feed MTD/YTD data easily
-
Target Sheet – Define monthly performance benchmarks
-
Previous Year Sheet – Store and compare past metrics
-
KPI Definition Sheet – View all KPI details at a glance
Each sheet is fully linked and automated for seamless updates and performance tracking.
🛠️ How to Use the Product
✅ Open the Excel file and start on the Home Sheet
✅ Input actual values monthly in the Actual Numbers Input Sheet
✅ Set your current reporting month (cell E1)
✅ Enter monthly targets in the Target Sheet
✅ Populate previous year data to analyze trends
✅ Head to the Dashboard Sheet for auto-generated insights
✅ Track historical performance in the KPI Trend Sheet
✅ Standardize all KPI definitions in the Definition Sheet
No coding. No setup headaches. Just data-driven visibility in minutes.
👥 Who Can Benefit from This Dashboard?
👨💻 Agile Product Teams – Track velocity, cycle time, and deployments
📈 Tech Startups – Analyze progress against key milestones
🧪 QA & Testing Teams – Monitor test failures and defect leaks
🧑💼 IT Managers & PMs – Report KPIs to stakeholders
🏢 Mid-size IT Companies – Align cross-functional teams under one dashboard
📊 Freelancers & Consultants – Use this to wow clients and manage product delivery
🔗 Click here to read the Detailed blog post
🎥 Visit our YouTube channel to learn step-by-step video tutorials


Reviews
There are no reviews yet.