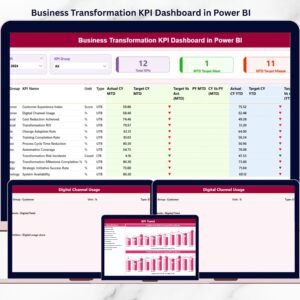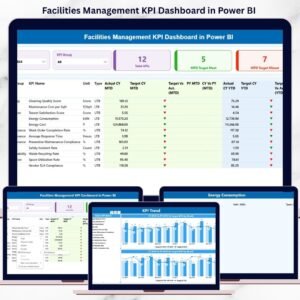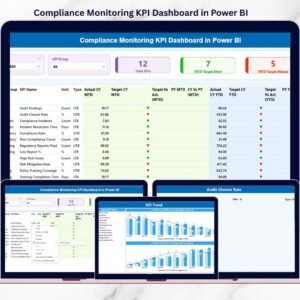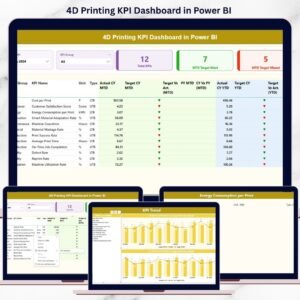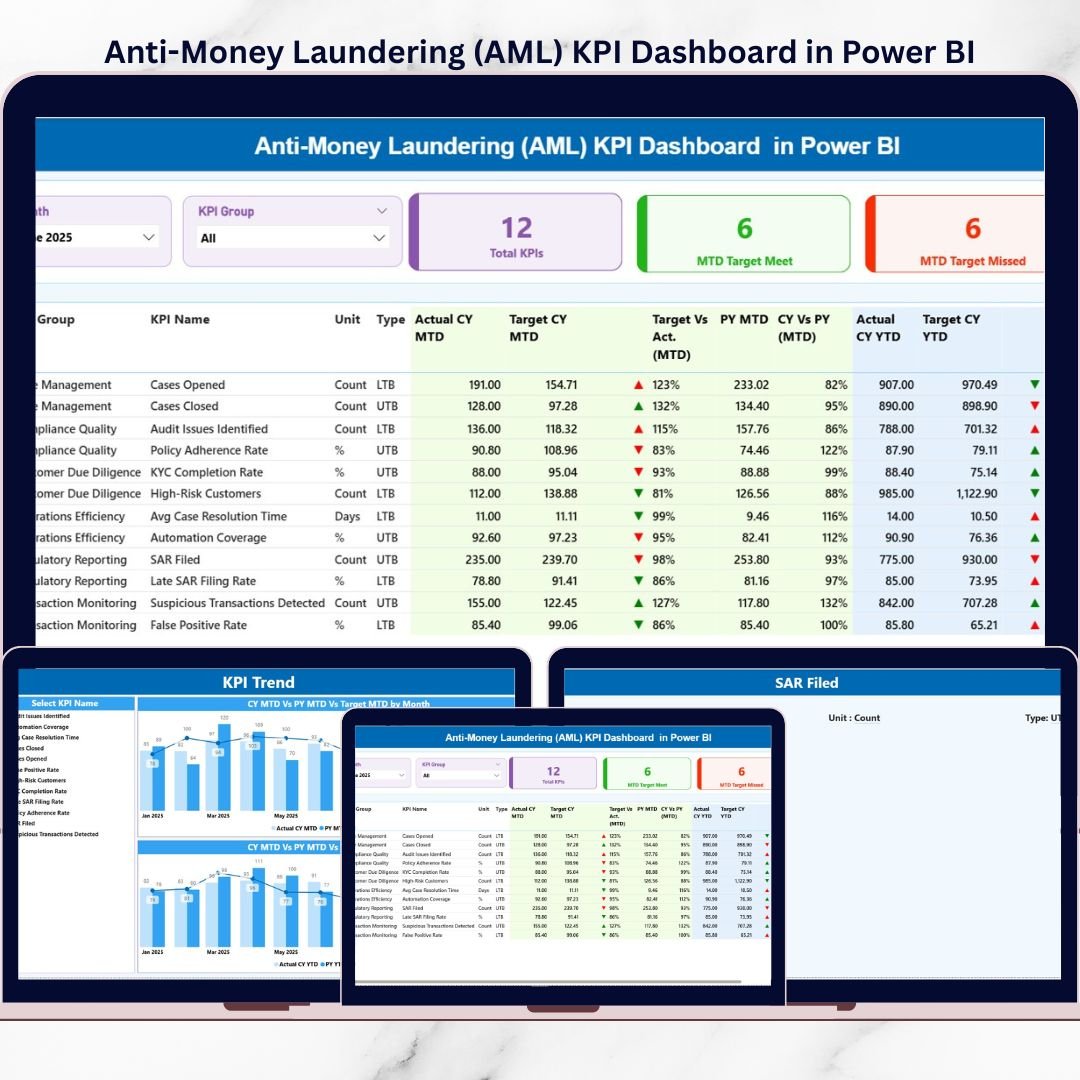
Financial crime continues to put intense pressure on banks, financial institutions, and regulated organizations worldwide. As AML regulations become stricter every year, compliance teams must monitor performance with speed, accuracy, and clarity. Anti-Money Laundering (AML) KPI Dashboard in Power BI However, when AML KPIs are tracked using manual reports, scattered spreadsheets, or static documents, organizations face delayed insights, compliance gaps, and audit risks. This is exactly where the Anti-Money Laundering (AML) KPI Dashboard in Power BI becomes a powerful compliance solution 🚀.
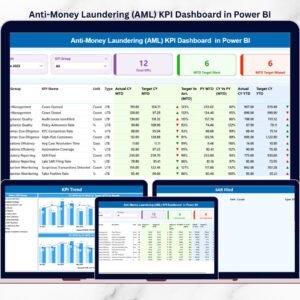
Anti-Money Laundering (AML) KPI Dashboard in Power BI the AML KPI Dashboard in Power BI is a ready-to-use, interactive analytics dashboard designed to help organizations track, monitor, and analyze AML performance metrics in real time. Instead of reviewing multiple Excel files or PDFs, teams gain a single, centralized Power BI dashboard that delivers actionable insights through visuals, icons, and trends 📊.
By combining structured Excel data input with Power BI’s advanced visualization capabilities, this dashboard enables organizations to move from reactive compliance to proactive AML risk management.
✅ Key Features of Anti-Money Laundering (AML) KPI Dashboard in Power BI
The AML KPI Dashboard in Power BI is designed to provide instant visibility into compliance performance 🔍.
It offers dynamic slicers, KPI cards, icons, and trend charts that allow users to analyze AML performance quickly and confidently. With just a few clicks, users can filter data by month or KPI group and instantly review updated results.
Key capabilities include:
MTD and YTD AML performance tracking
Target vs Actual and Current Year vs Previous Year comparison
Color-coded ▲▼ performance indicators
Interactive trend analysis using charts
Drill-through access to KPI definitions
Because everything updates automatically after data refresh, compliance teams save significant time and reduce reporting errors.
📦 What’s Inside the Anti-Money Laundering (AML) KPI Dashboard in Power BI
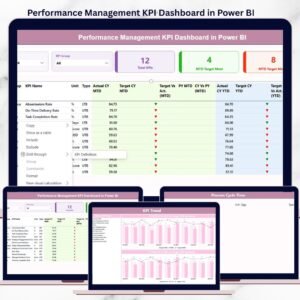
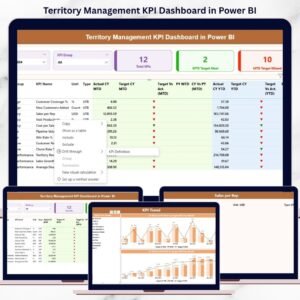
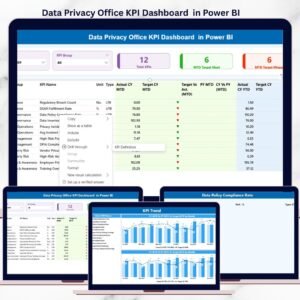
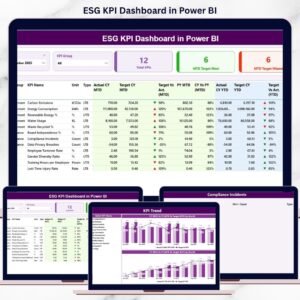
This product includes three professionally designed Power BI pages along with a structured Excel data model.
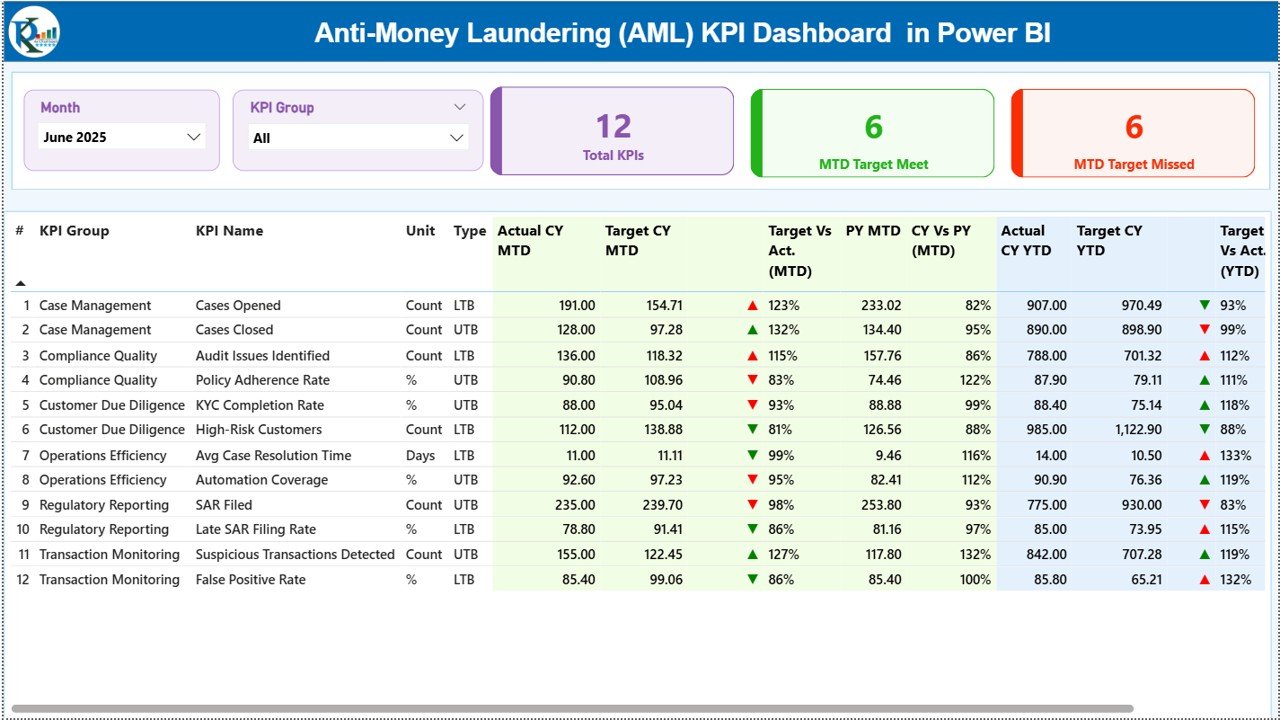
1️⃣ Summary Page
The Summary Page acts as the main landing page 🧭.
It includes:
Month slicer
KPI Group slicer
At the top, three KPI cards provide instant insights:
Total KPIs Count
MTD Target Met Count
MTD Target Missed Count
Below the cards, a detailed KPI table displays:
KPI Number, Group, Name, Unit, and Type (LTB / UTB)
MTD Actual, Target, PY, icons, and percentages
YTD Actual, Target, PY, icons, and percentages
This structured view allows users to evaluate both short-term and long-term AML performance on one screen.
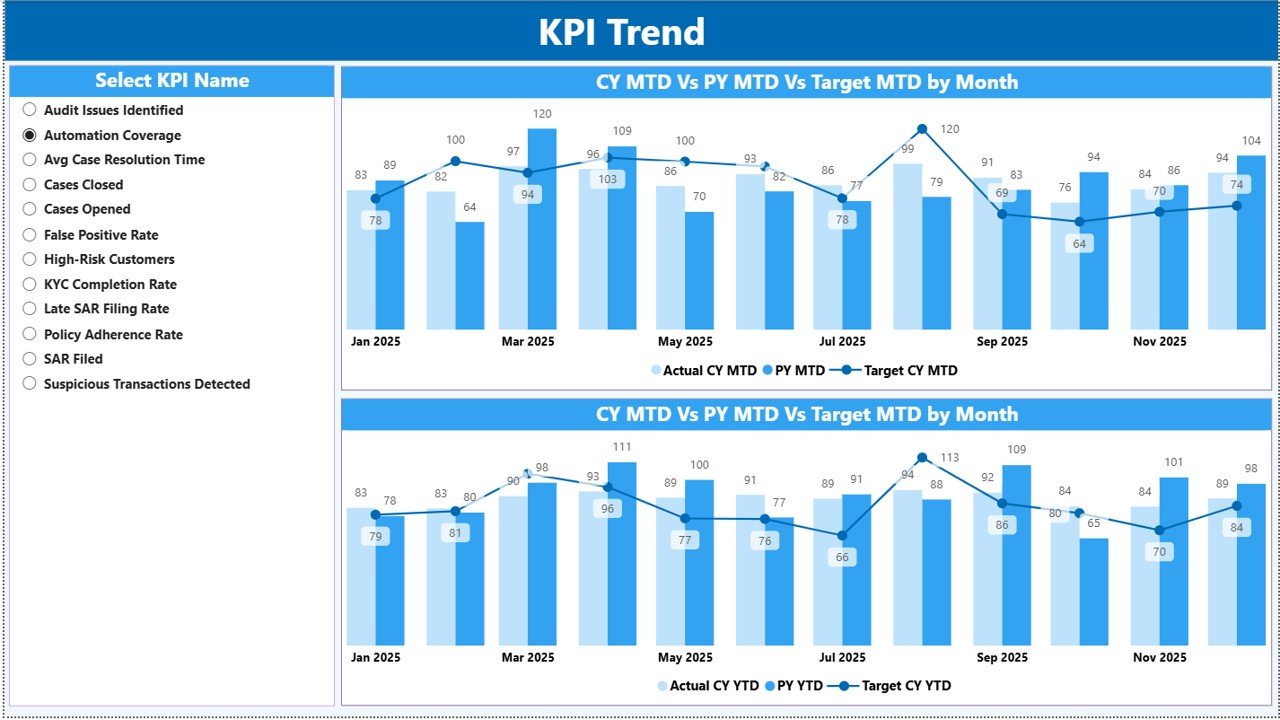
2️⃣ KPI Trend Page
The KPI Trend Page focuses on deep analytical insights 📈.
Users select a KPI from the slicer and instantly view:
MTD trend chart (Actual vs Target vs PY)
YTD trend chart (Actual vs Target vs PY)
These visuals help compliance teams identify:
Improving or declining KPIs
Seasonal patterns
Repeated compliance issues
As a result, teams can take corrective action early.
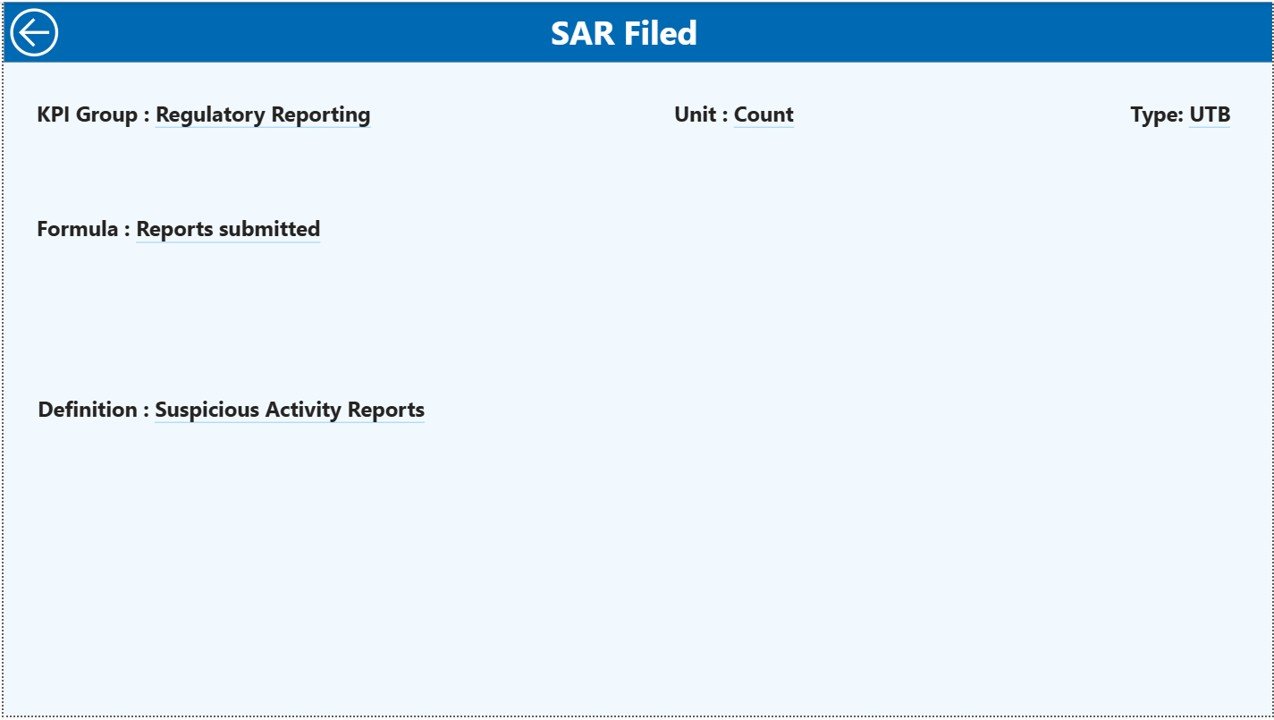
3️⃣ KPI Definition Page
The KPI Definition Page is a drill-through page that keeps the dashboard audit-ready.
When users right-click a KPI and drill through, they see:
KPI Formula
KPI Definition
KPI Type and logic
A Back button allows users to return to the main dashboard easily.
🛠️ How to Use the Anti-Money Laundering (AML) KPI Dashboard in Power BI
Using the dashboard is simple and efficient 👍.
First, update actual and target data in the linked Excel input sheets.
Next, refresh the Power BI dashboard.
Then, use slicers to select the required month or KPI group.
Finally, analyze KPI cards, tables, and trend charts to assess compliance performance.
Because Power BI handles calculations and visuals automatically, teams focus on insights and decisions, not manual reporting.
👥 Who Can Benefit from This AML KPI Dashboard
This dashboard is ideal for:
AML Compliance Officers
Risk Managers
Compliance Analysts
Internal Auditors
Regulatory Reporting Teams
Senior Management
It is especially useful for banks, fintech firms, NBFCs, and regulated financial institutions.
🔗 Click here to read the Detailed blog post
🎥 Visit our YouTube channel to learn step-by-step video tutorials
👉 https://www.youtube.com/@PKAnExcelExpert