
Are you running an astrology or spiritual service business but still relying on scattered Excel sheets to track performance?
Stop guessing. Start measuring.The Astrology and Spiritual Services KPI Dashboard in Power BI is a powerful, ready-to-use analytics solution designed specifically for astrology centers, tarot readers, reiki healers, numerologists, spiritual coaches, and online horoscope platforms.Instead of manually calculating revenue, repeat clients, cancellations, and satisfaction rates, this dashboard converts your raw Excel data into stunning, interactive insights.Now you can grow spiritually — and strategically.
🚀 Key Features of Astrology and Spiritual Services KPI Dashboard in Power BI
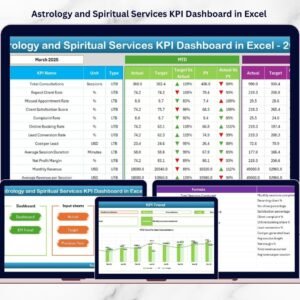
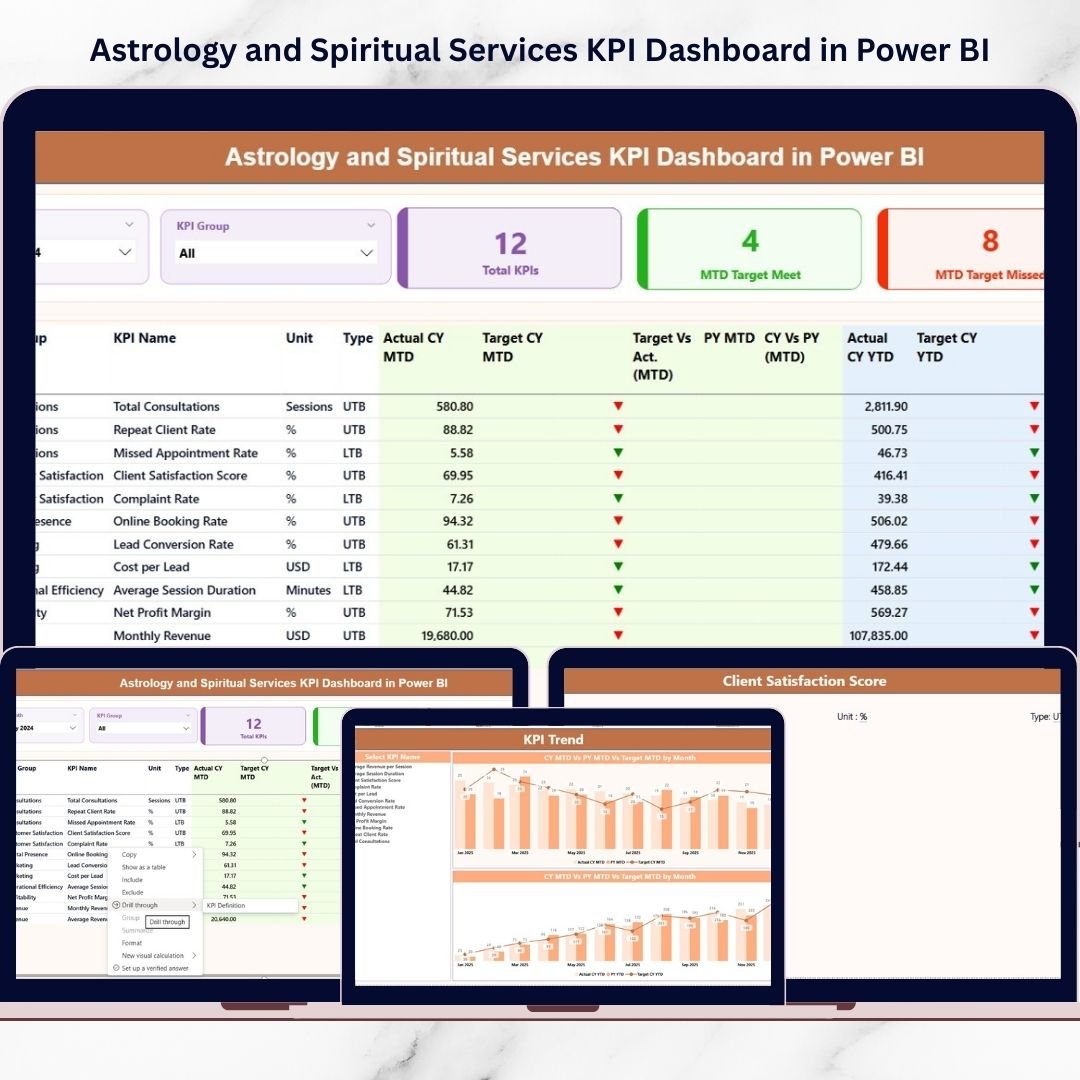
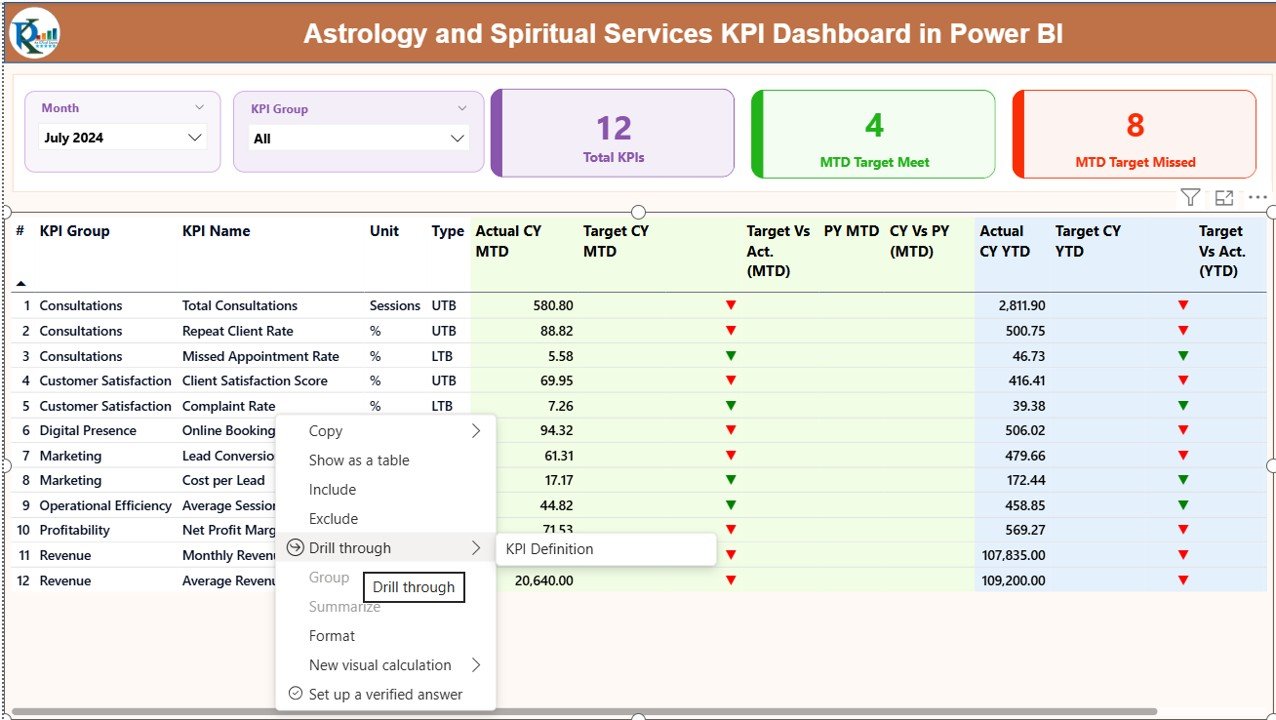
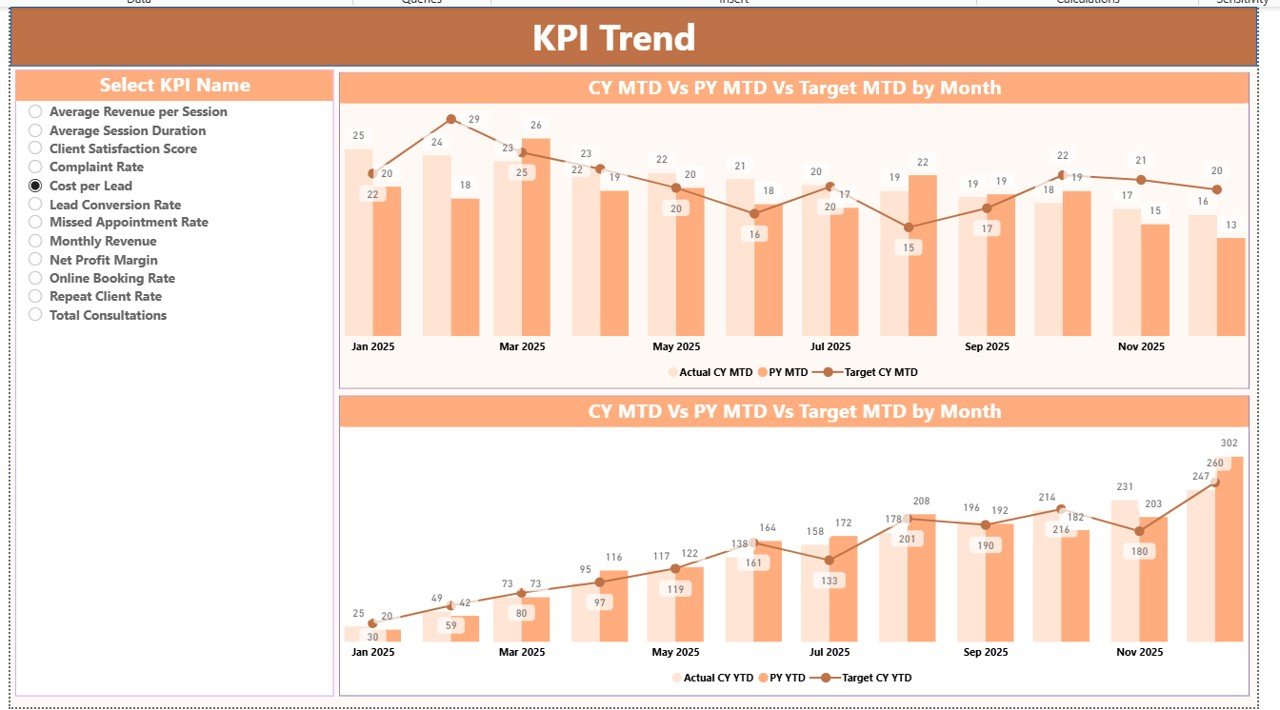
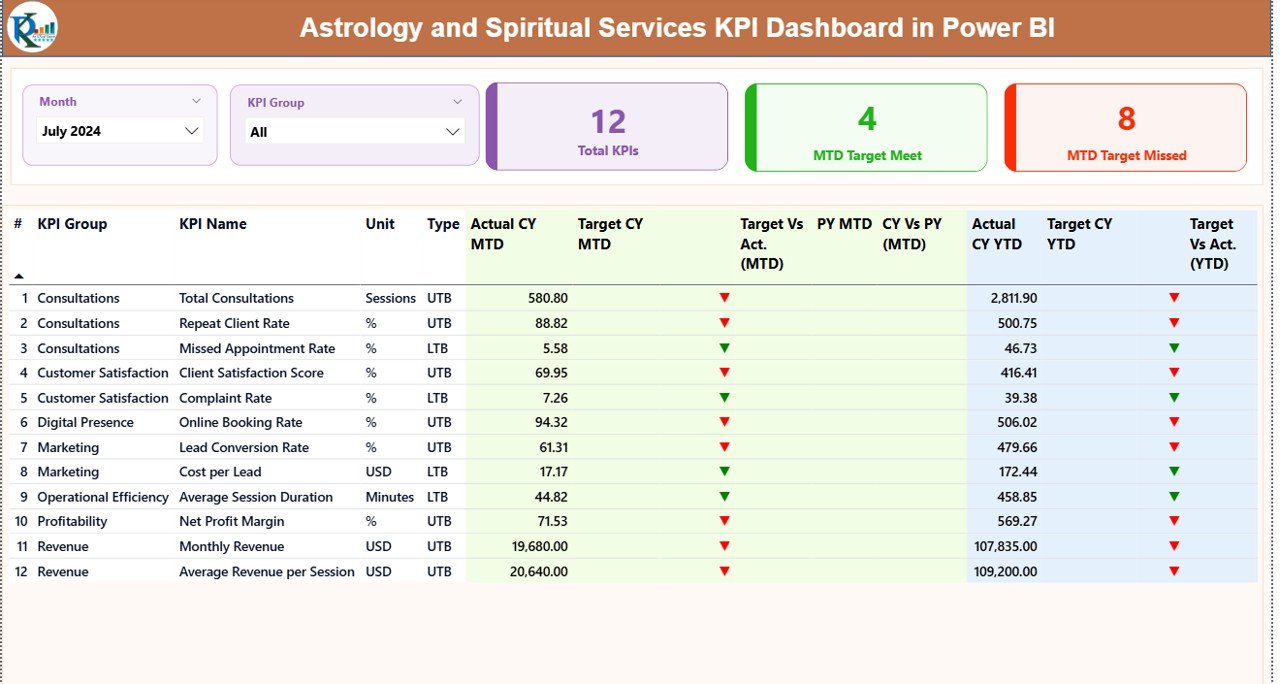
✨ 3 Powerful Analytical Pages – Summary, KPI Trend, and KPI Definition for complete performance tracking.
📊 MTD & YTD Analysis – Monitor Month-to-Date and Year-to-Date growth effortlessly.
🎯 Target vs Actual Tracking – Instantly see achieved and missed KPIs with visual indicators.
📈 Current Year vs Previous Year Comparison – Understand real growth patterns.
🧿 Dynamic Slicers – Filter by Month and KPI Group instantly.
📌 Green & Red Performance Icons – Identify strong and weak areas at a glance.
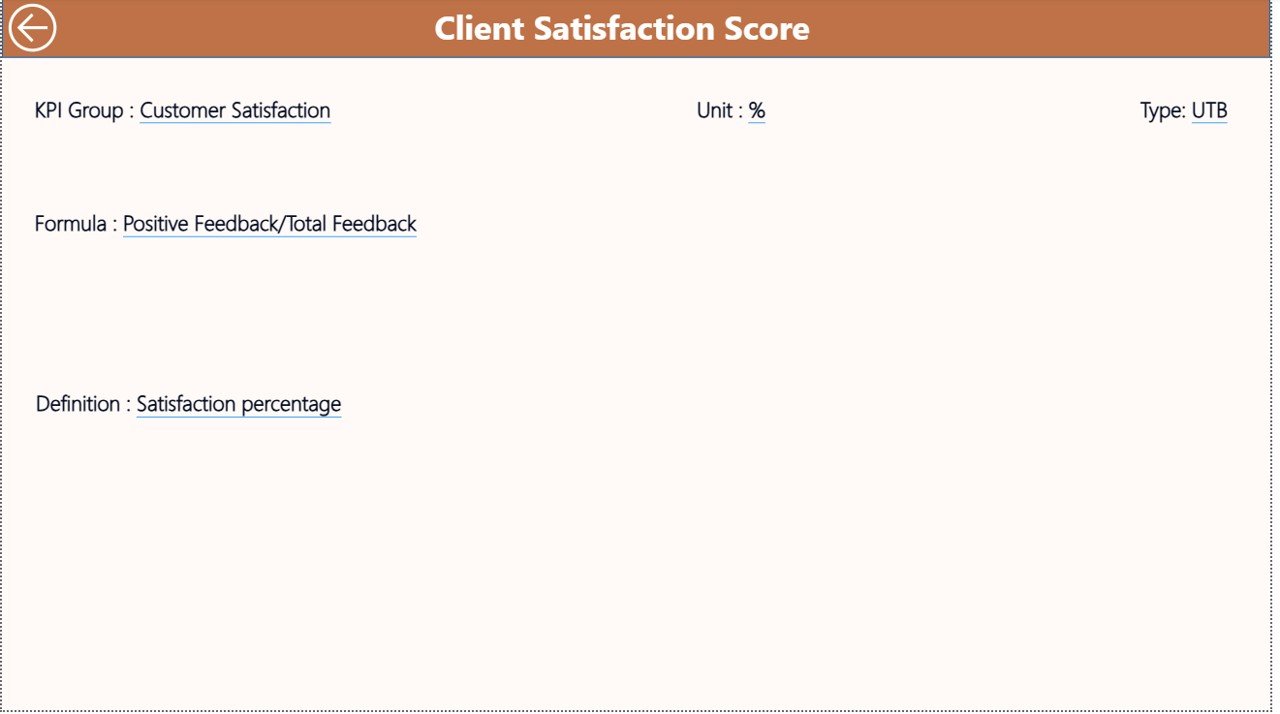
🔎 Drill-Through KPI Definitions – View KPI formulas and logic in seconds.
🔄 Easy Excel Integration – Just update Excel sheets and refresh Power BI.
This is not just a dashboard. It is your spiritual business command center.
📦 What’s Inside the Astrology and Spiritual Services KPI Dashboard in Power BI
When you purchase this dashboard, you get:
📁 Power BI Desktop File (.pbix) – Fully designed and ready to use.
📊 Structured Excel Data Template – Includes Input_Actual, Input_Target, and KPI Definition sheets.
📑 Pre-Built KPI Categories – Revenue, Client, Operations, Marketing, and Quality.
📈 Combo Charts for MTD & YTD Trends – Visual comparison of Target, CY, and PY values.
📘 Hidden KPI Definition Drill Page – Professional documentation within the dashboard.
Everything is structured professionally so you can implement it immediately.
🛠 How to Use the Astrology and Spiritual Services KPI Dashboard in Power BI
Using this dashboard is simple.
1️⃣ Enter KPI data in the Input_Actual sheet.
2️⃣ Add monthly targets in the Input_Target sheet.
3️⃣ Define KPI formulas in the KPI Definition sheet.
4️⃣ Open Power BI and click Refresh.
That’s it.
Within seconds, you will see:
Revenue growth trends
Client retention patterns
Cancellation and no-show rates
Satisfaction performance
Marketing ROI indicators
No advanced Power BI skills required.
👥 Who Can Benefit from This Astrology and Spiritual Services KPI Dashboard in Power BI
This dashboard is ideal for:
🔮 Astrology Consultation Centers
🃏 Tarot Reading Businesses
🌿 Reiki & Healing Centers
📿 Numerology Experts
🧘 Spiritual Coaches
🌙 Online Horoscope Platforms
📚 Spiritual Workshop Organizers
If you provide spiritual services and want predictable growth, this tool is for you.
Imagine knowing:
Which service generates the highest revenue
Which marketing channel brings repeat clients
Why cancellations are increasing
Whether your client satisfaction is improving
How your current year compares with last year
Instead of operating on intuition, you operate on insights.
Because when you measure performance:
✔ You increase repeat consultations
✔ You reduce no-show rates
✔ You improve client experience
✔ You optimize marketing spend
✔ You scale your business confidently
This dashboard transforms your spiritual practice into a data-driven enterprise without losing its essence.
Power BI provides interactive visuals, professional layouts, drill-through pages, and seamless Excel connectivity. Therefore, as your business expands, your reporting system grows with you.
No more confusion.
No more manual calculations.
No more scattered spreadsheets.
Only clarity. Control. Confidence.
Watch the step-by-step video tutorial:
Click here to read the Detailed blog post
Visit our YouTube channel to learn step-by-step video tutorials
Compatibility and Requirements
- Works in Power BI Desktop, which is free to download from Microsoft. Power BI Desktop runs on Windows.
- Your KPI data is entered in an Excel workbook with the Input_Actual, Input_Target and KPI Definition sheets, then loaded into the .pbix file with Refresh.
- Microsoft explains the download and setup in Get Power BI Desktop.
Frequently Asked Questions
Which pages does the dashboard have?
Three pages: Summary, KPI Trend and KPI Definition. The KPI Definition page is a hidden drill-through page that shows each KPI’s formula and logic.
How do I update the dashboard with my own data?
Enter your actual figures in the Input_Actual sheet, your monthly targets in the Input_Target sheet and your KPI formulas in the KPI Definition sheet. Then open the .pbix file in Power BI and click Refresh.
Can I filter the dashboard by month or KPI group?
Yes. The dashboard has slicers for Month and KPI Group, so every chart and number updates for the selection you make.
Does it compare this year with last year?
Yes. It shows MTD and YTD values for the current year against targets and the previous year. Green and red icons mark KPIs that met or missed their targets.
Is there an Excel version?
Yes. See the Astrology and Spiritual Services KPI Dashboard in Excel. There is also a broader Astrology and Spiritual Services Dashboard in Power BI.
Related Astrology and Spiritual Services Templates
- Astrology and Spiritual Services KPI Dashboard in Excel: the same KPI dashboard for Excel
- Astrology and Spiritual Services Dashboard in Power BI: another Power BI dashboard for the same business
- Astrology and Spiritual Services Dashboard in Excel: the dashboard edition in Excel
- Restaurants & Food Services KPI Dashboard in Power BI: a service business KPI dashboard in Power BI
- Power BI Dashboard Mega Collection: 15 Power BI templates in one download
Browse all Power BI KPI dashboards.