
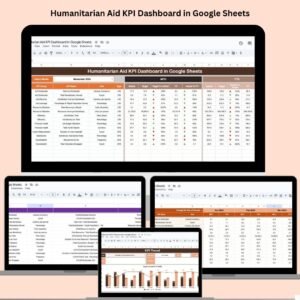
Managing humanitarian aid requires clarity, precision, and real-time visibility—especially when lives depend on timely action. The Humanitarian Aid KPI Dashboard in Google Sheets is the ultimate solution to help aid organizations track, measure, and enhance their operational performance effortlessly.
Designed for both small local teams and global NGOs, this ready-to-use dashboard brings powerful data visualization and automation directly into your Google Sheets—no coding or software needed! Whether you’re monitoring volunteer hours, donation flow, or distribution reach, this tool gives you the insights you need to make informed decisions and maximize your impact.
✨ Key Features of Humanitarian Aid KPI Dashboard
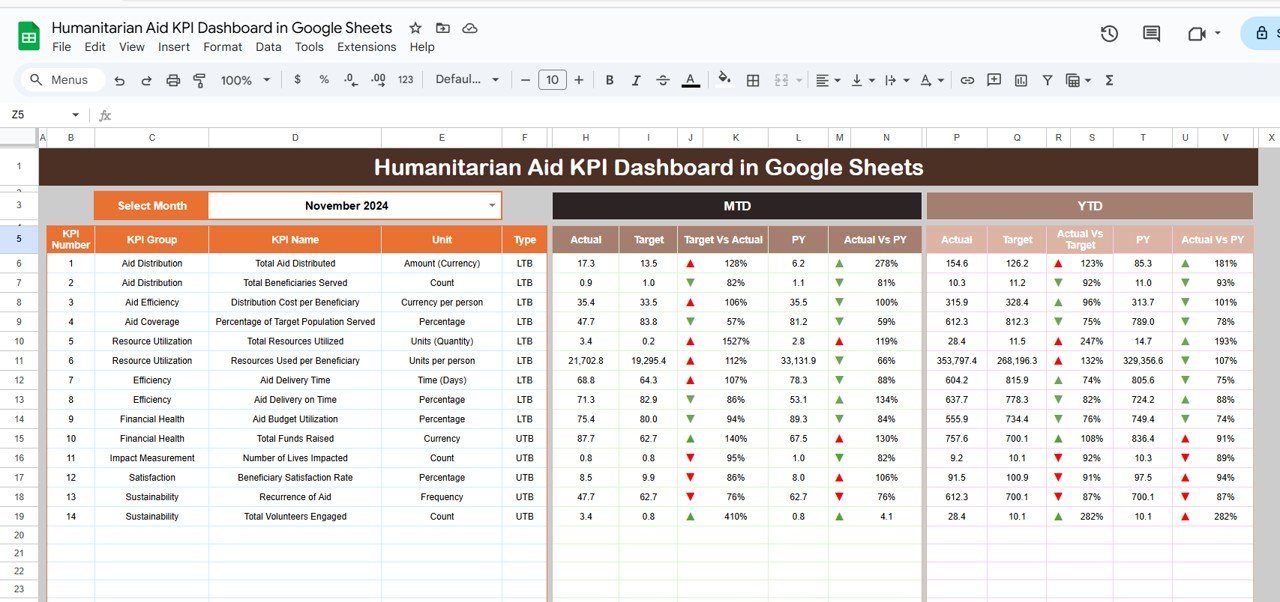
📊 All-in-One Dashboard View
Track MTD (Month-to-Date), YTD (Year-to-Date), Target vs Actual, and previous year comparisons—complete with smart conditional formatting and performance arrows.
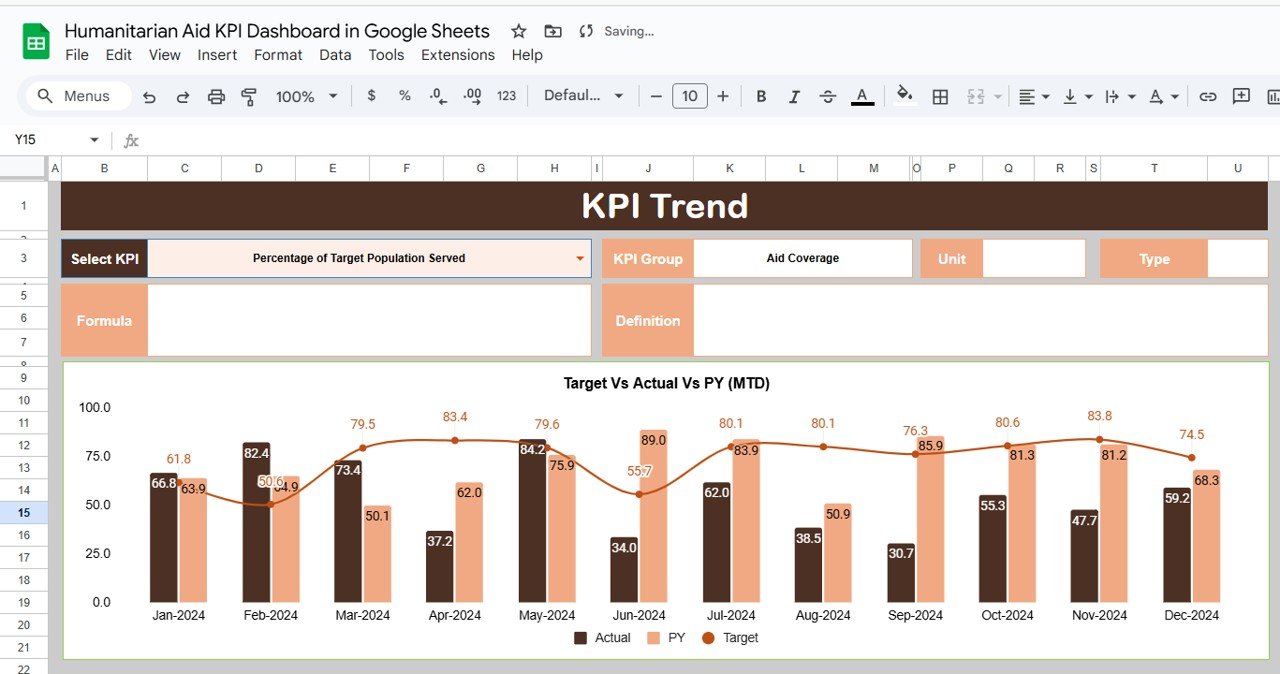
📈 KPI Trend Tracker
Dive deep into the performance of each KPI over time. Choose any KPI and instantly view trends, formulas, definitions, and categories.
📥 Dynamic Data Entry Sheets
Update your Actual, Target, and Previous Year data in dedicated sheets. Your dashboard updates automatically without any manual effort.
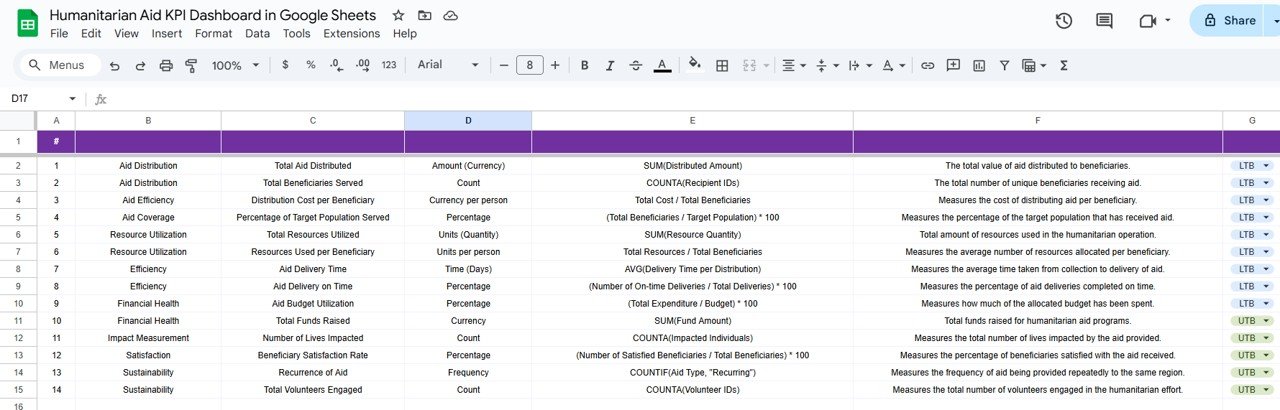
📘 Complete KPI Definitions Tab
Never guess what a KPI means again. Each one is clearly explained, with formula, group, and unit, so your whole team stays on the same page.
🧩 Fully Customizable Layout
Add new KPIs, tweak formulas, or modify charts easily to fit your organization’s needs.
🌐 Cloud-Based & Shareable
Since it’s built in Google Sheets, you can collaborate with remote teams in real-time from anywhere in the world.
📦 What’s Inside the Humanitarian Aid KPI Dashboard
The dashboard consists of 6 well-organized worksheets:
-
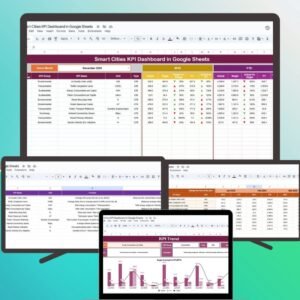
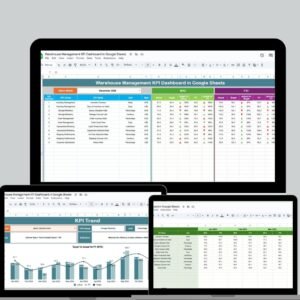
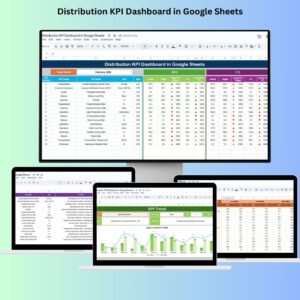
Dashboard Sheet Tab
Your mission control. Instantly view MTD, YTD, and previous year data, along with visual indicators (up/down arrows) to show performance trends. -
KPI Trend Sheet Tab
Use the dropdown to pick any KPI and view its unit, group, type (UTB/LTB), formula, and definition—plus a line graph for performance trends. -
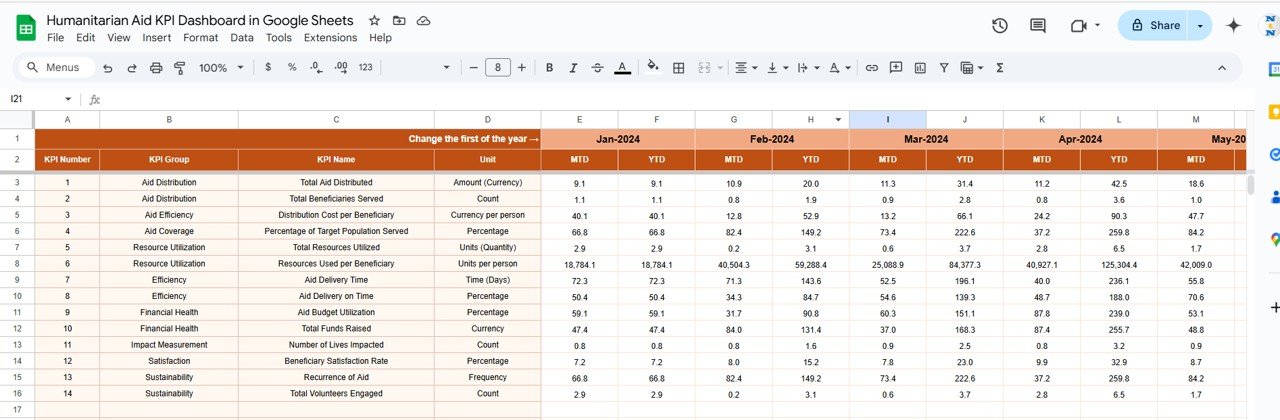
Actual Number Sheet Tab
Enter your real monthly and yearly data. Once you do, everything else updates like magic! -
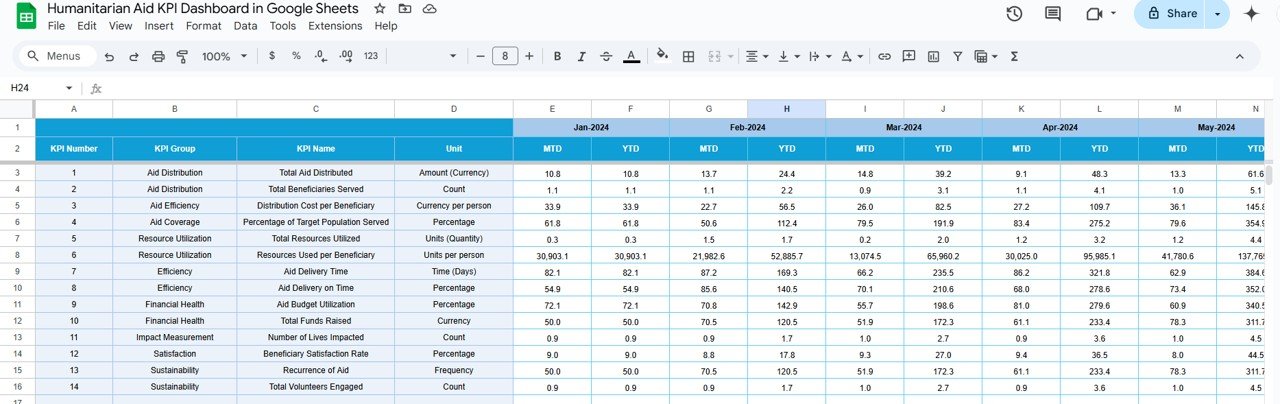
Target Sheet Tab
Set your monthly and yearly goals for each KPI—great for performance benchmarking. -
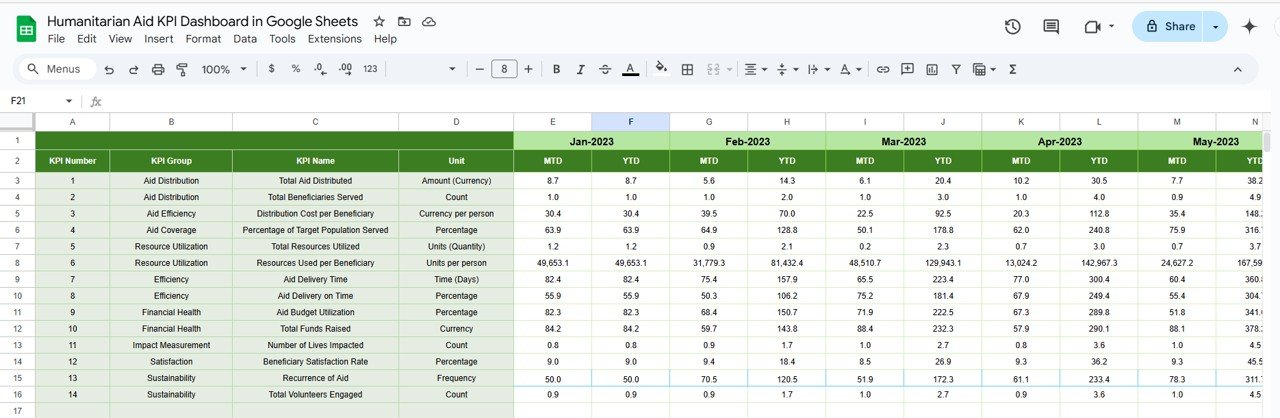
Previous Year Number Sheet Tab
Track and compare performance year-over-year by entering last year’s numbers. -
KPI Definition Sheet Tab
A reference guide for all KPIs used. Perfect for onboarding new team members or sharing with stakeholders.
🛠️ How to Use the Humanitarian Aid KPI Dashboard
🔹 Step 1: Enter your monthly actuals in the Actual Number Sheet
🔹 Step 2: Define your targets in the Target Sheet
🔹 Step 3: Add past year’s values in the Previous Year Sheet
🔹 Step 4: Go to the Dashboard for a real-time view of performance
🔹 Step 5: Use the KPI Trend sheet to analyze growth and make improvements
Everything auto-updates. No manual charting. No wasted hours.
🌍 Who Can Benefit from This Product?
🎯 NGOs & Nonprofits – Monitor resource allocation and performance
🧑⚕️ Field Managers – Track local-level activities and improvements
📢 Donor Teams – Share transparent data with stakeholders
📊 Analysts – Identify bottlenecks and opportunities using trends
📈 Executives – Make data-driven decisions quickly and confidently
🧑💻 Remote Teams – Collaborate seamlessly in real time via Google Sheets
Whether you’re saving lives, delivering food, or rebuilding communities—this tool keeps your mission on track.
🔗 Click here to read the Detailed blog post
Watch the step-by-step video Demo:


Reviews
There are no reviews yet.