


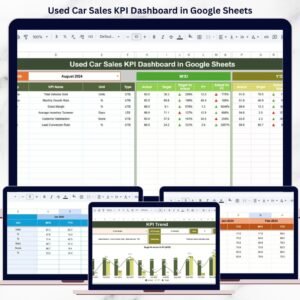
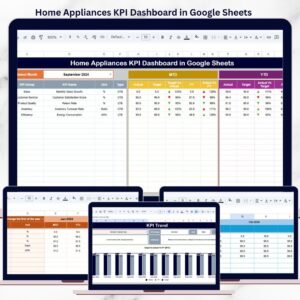
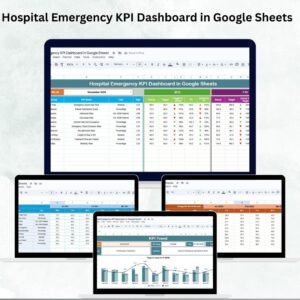
Hospital emergency departments face tremendous pressure daily to provide timely, efficient, and high-quality care. Delays or mismanagement can have serious consequences, making it vital to monitor performance with the right metrics. The Hospital Emergency KPI Dashboard in Google Sheets is a ready-to-use solution designed to help administrators, managers, and staff track, analyze, and visualize emergency KPIs in real time. 📊
This interactive, cloud-based dashboard consolidates all key performance indicators (KPIs) into a single platform. With features like Month-to-Date (MTD) and Year-to-Date (YTD) tracking, comparisons with previous years, trend analysis, and conditional formatting, hospitals can identify bottlenecks, optimize resources, and enhance patient outcomes.
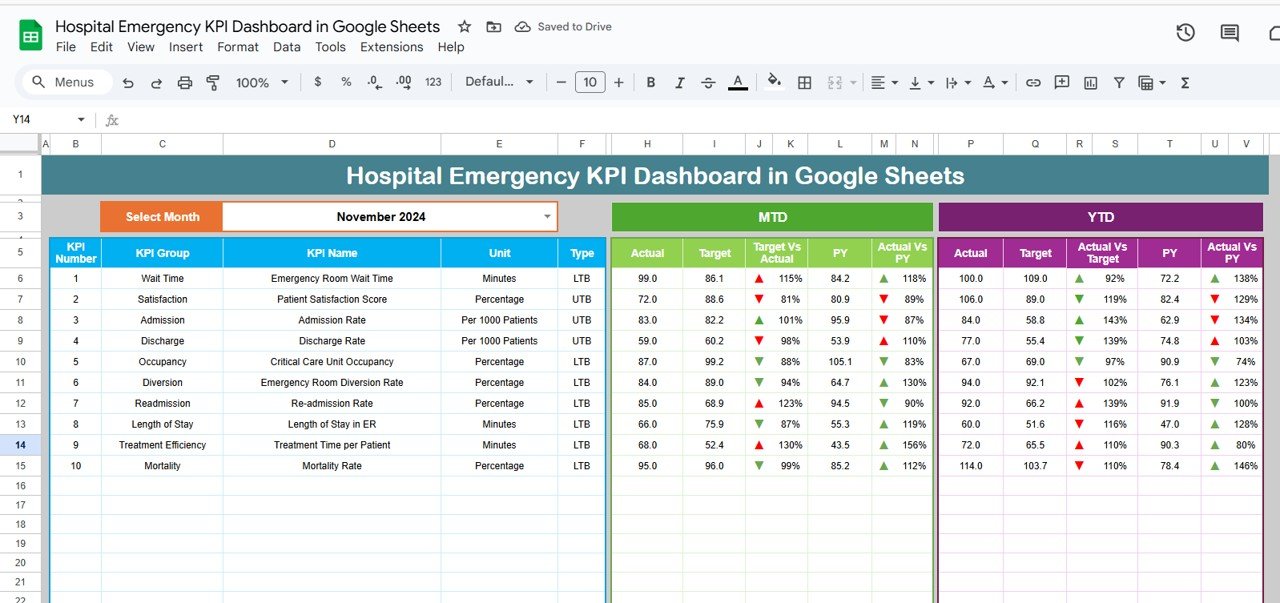
🔑 Key Features of Hospital Emergency KPI Dashboard
📊 Dashboard Sheet Tab
-
Central interface to view all KPIs.
-
Month selector updates the entire dashboard automatically.
-
MTD Actual vs Target and Previous Year comparisons.
-
Conditional formatting with arrows to instantly spot underperformance.
-
YTD analysis for long-term performance review.
📈 KPI Trend Sheet Tab
-
Dropdown selector to focus on any KPI.
-
Displays KPI group, unit, type (LTB/UTB), formula, and definition.
-
Helps staff understand how KPIs are calculated for accurate reporting.
🧾 Actual Number Sheet Tab
-
Input MTD and YTD actuals.
-
Auto-updates based on starting month.
-
Single source of truth for emergency data.
🎯 Target Sheet Tab
-
Enter monthly and yearly targets.
-
Aligns departmental goals with hospital objectives.
📉 Previous Year Number Sheet Tab
-
Store last year’s KPI data.
-
Compare year-over-year performance.
📑 KPI Definition Sheet Tab
-
Master list of all KPIs with formulas and explanations.
-
Ensures standardization and clarity across all users.
📦 What’s Inside the Dashboard
✅ 6 Pre-Built Sheets – Dashboard, KPI Trend, Actual Numbers, Targets, Previous Year, KPI Definitions
✅ Real-Time Tracking – Cloud-based with instant updates
✅ KPI Comparison – MTD, YTD, and YoY analysis
✅ Visual Insights – Conditional formatting with red/green arrows
✅ Plug-and-Play Setup – Just input your data
✅ Customizable KPIs – Add or adjust as per hospital needs
✅ Team Collaboration – Easy sharing and access with Google Sheets
👥 Who Can Benefit from This Dashboard?
🏥 Hospital Administrators – Monitor emergency KPIs in real time.
👩⚕️ Healthcare Managers – Track department efficiency and staff performance.
🚑 Emergency Department Staff – Optimize patient wait times and treatment flow.
📊 Data Analysts – Simplify reporting and performance tracking.
💡 Policy Makers & Regulators – Access standardized reports for compliance.
This dashboard is perfect for hospitals of all sizes looking for an affordable, easy-to-use performance tracking tool.
📋 Best Practices for Using the Dashboard
-
🔄 Update actual numbers weekly for accuracy.
-
🎯 Set realistic targets aligned with patient demand.
-
📊 Review trends to identify recurring issues.
-
🔎 Use conditional formatting to highlight weak spots.
-
👩🏫 Train staff to interpret KPIs consistently.
-
💾 Keep backups of monthly data for historical insights.
✅ Advantages of Hospital Emergency KPI Dashboard
-
Centralized Data – All KPIs in one sheet for easy monitoring.
-
Real-Time Insights – Cloud-based updates ensure accuracy.
-
Comparative Analysis – MTD, YTD, and Previous Year benchmarks.
-
Visual Indicators – Spot issues instantly with arrows and highlights.
-
Resource Optimization – Allocate staff and beds more effectively.
-
Simplified Reporting – Save time with pre-built charts and metrics.
🔗 Click here to read the Detailed blog post
Watch the step-by-step video Demo:


Reviews
There are no reviews yet.