

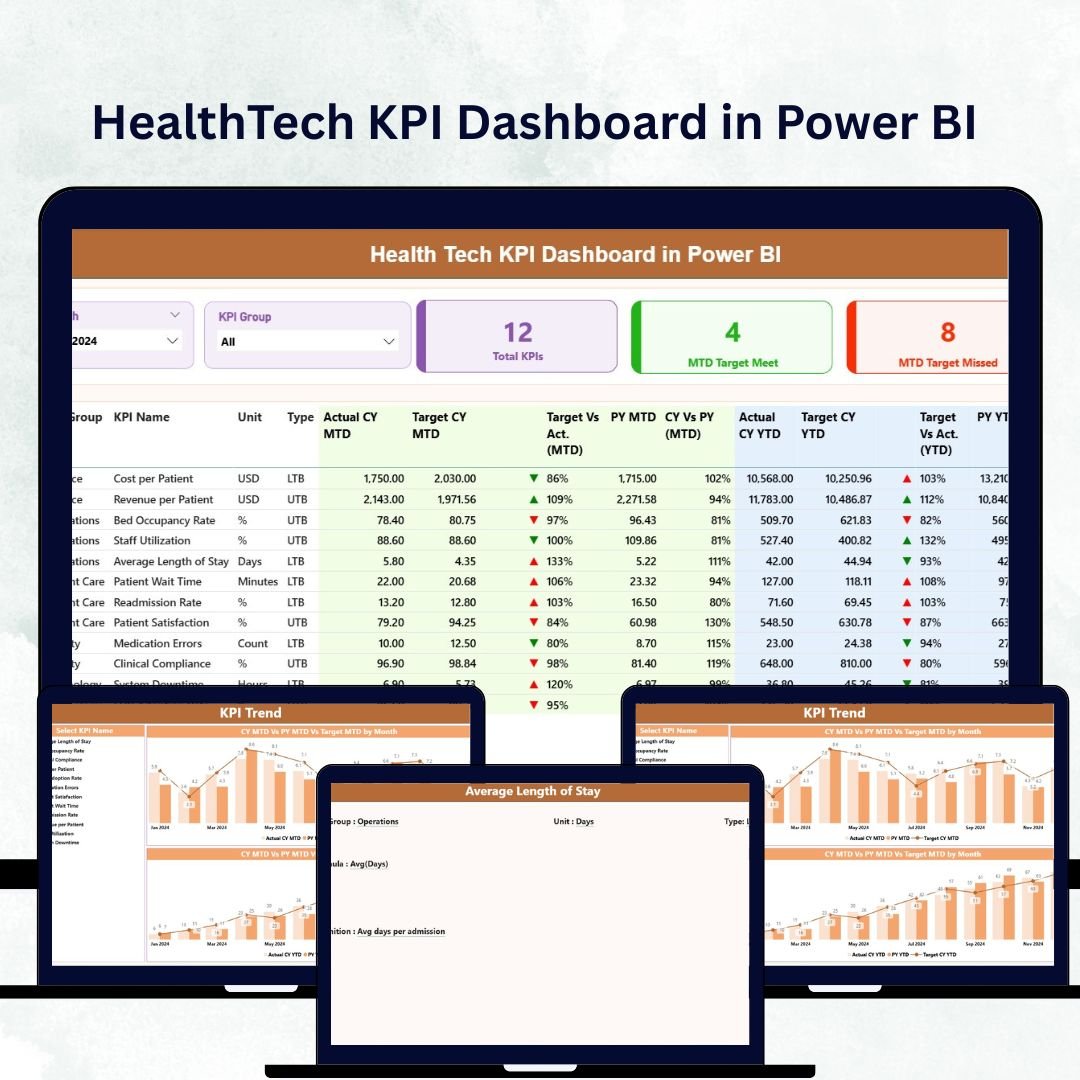

In the fast-paced world of healthcare, data saves time, money, and lives. Hospitals, clinics, and health-tech startups depend on precise, real-time analytics to enhance patient care and streamline operations. The HealthTech KPI Dashboard in Power BI transforms complex healthcare data into clear, interactive insights, empowering professionals to make smarter, data-driven decisions.
Built in Microsoft Power BI and powered by Excel data, this dashboard enables you to track performance, spot trends, and drive continuous improvement across your organization — from patient satisfaction to financial stability. Whether you run a small clinic or manage multiple hospital branches, this solution provides an all-in-one view of your healthcare ecosystem.
⚙️ Key Features of the HealthTech KPI Dashboard in Power BI
🏥 3 Interactive Pages – Summary, KPI Trend, and KPI Definition for complete analytics coverage.
📊 Dynamic Visuals – MTD (Month-to-Date) and YTD (Year-to-Date) analysis with instant updates.
🎯 Actual vs Target vs PY – Track performance metrics compared to targets and previous years.
🟢 Drill-Through Functionality – Dive deeper into each KPI to view formulas and definitions.
📈 Real-Time Filtering – Slice data by month, department, or KPI group.
💾 Excel-Powered Data Source – Easy to update and refresh without technical setup.
💡 Scalable & Customizable – Add new KPIs, departments, or hospitals anytime.
💰 Cost-Efficient Analytics – Leverage Power BI’s automation without expensive software.
🧩 What’s Inside the Dashboard
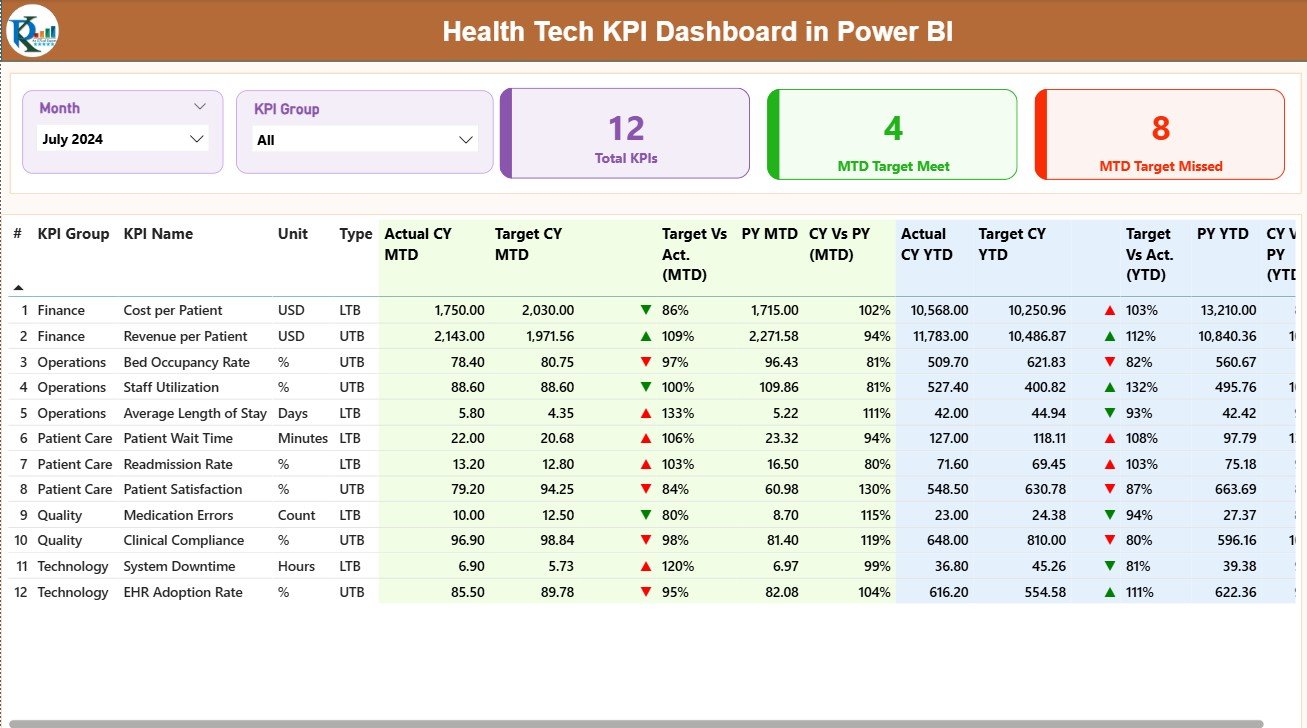
1️⃣ Summary Page – Central Overview
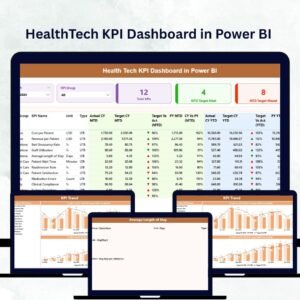
This is the heart of the dashboard — a real-time snapshot of all healthcare KPIs.
Month and KPI Group Slicers for focused analysis.
Performance Cards showing total KPIs, MTD Target Met, and MTD Target Missed.
Color-coded visuals and arrows for instant performance insight.
From patient flow to cost control, everything you need is displayed in one clean, professional view.
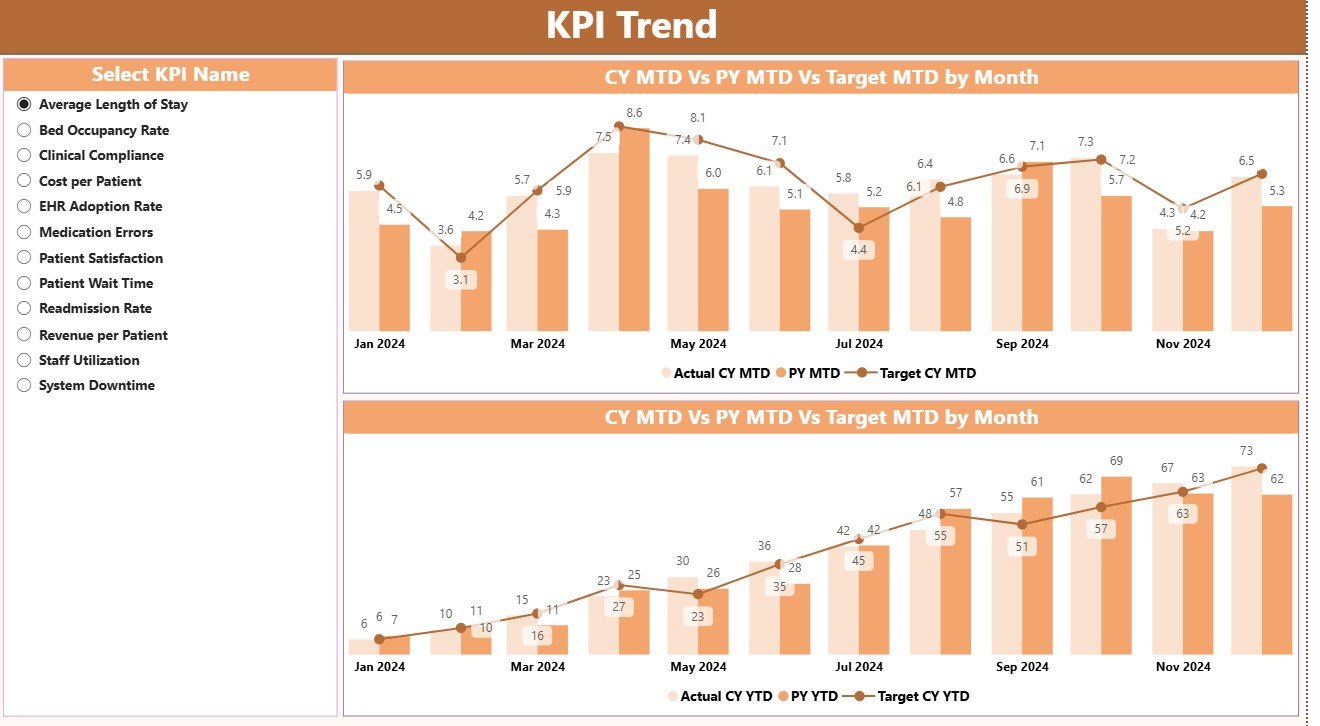
2️⃣ KPI Trend Page – Performance Over Time
Track the story behind every number 📈.
This page visualizes MTD and YTD trends for Actual, Target, and Previous Year metrics.
Use slicers to select any KPI and analyze its progress month by month — ideal for identifying seasonal patterns, operational bottlenecks, and improvement opportunities.
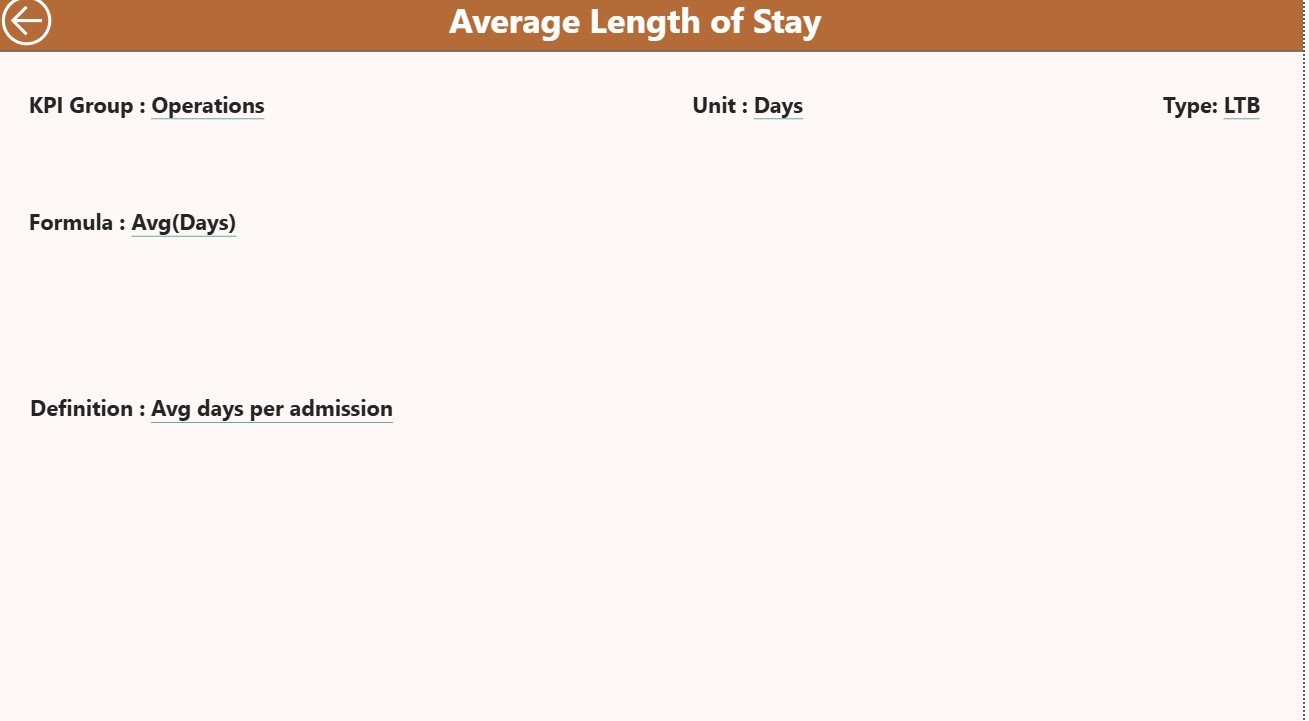
3️⃣ KPI Definition Page – Transparency & Clarity
Each KPI includes:
KPI Number and Name
Unit of Measurement
Type (UTB – Upper the Better / LTB – Lower the Better)
Formula and Definition
Users can right-click any KPI in the Summary Page to drill through for details, ensuring every stakeholder understands the data source and calculation logic.
📘 Excel Data Structure
This dashboard connects to a simple, well-organized Excel file containing three sheets:
1️⃣ Input Actual Sheet – Enter Actual performance values per month.
2️⃣ Input Target Sheet – Define monthly and yearly Target values.
3️⃣ KPI Definition Sheet – Document KPI Group, Unit, Formula, Definition, and Type (UTB/LTB).
Once the Excel file is linked, Power BI automatically refreshes visuals whenever the source data is updated.
🩺 Common KPIs Included
Clinical KPIs – Patient Wait Time, Bed Occupancy Rate, Readmission Rate, Emergency Response Time.
Operational KPIs – Staff Utilization, Appointment Cancellation Rate, Equipment Downtime, Turnaround Time.
Financial KPIs – Revenue, Cost per Patient, Claim Processing Time, Profit Margin.
Patient Experience KPIs – Satisfaction Score, Complaint Resolution Rate, Telehealth Completion Rate.
Technology KPIs – System Uptime, Data Accuracy %, Cybersecurity Compliance.
These KPIs combine to give a 360-degree view of healthcare performance — clinical, financial, and technological.
🌟 Advantages of Using the HealthTech KPI Dashboard in Power BI
✅ Real-Time Intelligence – Analyze live data from Excel or databases.
✅ Smarter Decisions – Track trends, forecast outcomes, and take corrective action early.
✅ Automation – Eliminate manual reporting; Power BI auto-calculates metrics.
✅ User-Friendly Visualization – Drilldowns, slicers, and charts simplify analysis.
✅ Collaboration Ready – Share dashboards securely with teams and management.
✅ Scalable Solution – Add new KPIs as your hospital network expands.
✅ Unified Reporting – One framework for finance, operations, and clinical care.
🧠 Best Practices for Effective Use
Focus on key KPIs that directly impact patient care and cost efficiency.
Maintain accurate and consistent data in the Excel source.
Use color coding (red/yellow/green) to highlight performance levels.
Refresh data weekly or monthly for real-time accuracy.
Encourage collaboration by publishing the dashboard in Power BI Service.
Use drill-throughs for KPI transparency and departmental accountability.
💡 Example: Real-World Healthcare Use Case
A hospital network, Medcore Hospitals, uses the HealthTech KPI Dashboard to track patient efficiency and financial health.
The Summary Page shows an increase in readmission rates.
The KPI Trend Page reveals a three-month upward trend in cardiac readmissions.
After analysis, the Drill-Through Page confirms that extended wait times in follow-up care are the cause.
Medcore implements a telehealth check-in program — resulting in a 25% drop in readmissions within one quarter.
📊 Result: Faster insights, better patient outcomes, and smarter operational planning.
🔗 Click here to read the Detailed Blog Post
🎥 Visit our YouTube Channel to watch step-by-step tutorials
Watch the step-by-step video tutorial:
Compatibility and Requirements
- Works in Power BI Desktop, which is free to download. Microsoft explains the download in Get Power BI Desktop.
- The data comes from an Excel file with three sheets: Input Actual, Input Target and KPI Definition.
- Publishing the dashboard for your team uses the Power BI Service, as noted in the best practices above.
Frequently Asked Questions
How many pages does the dashboard have?
Three pages: Summary, KPI Trend and KPI Definition.
How do I update the numbers?
Enter your monthly actuals in the Input Actual sheet and your goals in the Input Target sheet of the Excel file. Power BI refreshes the visuals when the linked data is updated.
Can I add my own KPIs?
Yes. Add the KPI to the Excel sheets and describe it in the KPI Definition sheet with its group, unit, formula, definition and type (UTB or LTB).
How do I see how a KPI is calculated?
Right-click a KPI on the Summary page and drill through to the KPI Definition page. It shows the KPI number, name, unit, type, formula and definition.
Is there an Excel or Google Sheets version?
Yes. See the HealthTech KPI Dashboard in Excel and the HealthTech Dashboard in Google Sheets.
Related Healthcare and KPI Templates
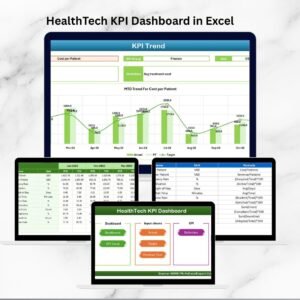
- HealthTech KPI Dashboard in Excel: the same KPIs in Excel
- HealthTech Dashboard in Google Sheets: a Google Sheets edition
- Healthcare Insurance KPI Dashboard in Power BI: a Power BI dashboard for healthcare insurance
- Operations KPI Dashboard in Power BI: operational KPIs in the same format
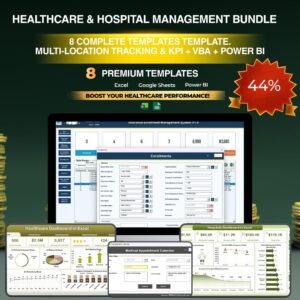
- Healthcare & Hospital Management Bundle: 8 healthcare templates in one download
Browse all Power BI KPI dashboards.





Reviews
There are no reviews yet.